Weird.
Back in 2007, the Puget Sound Regional Council reported that drive-alone car trips fellas a share of total travel between 1999 and 2006. Over the same period, PSRC found, the share of trips taken in carpools and other high-occupancy vehicles stayed about the same.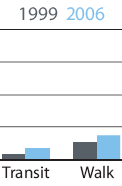

But just last month, they reported the reverse: from 1999 through 2006, drive-alone car trips stayed flat, as a share of all trips, while carpooling fell.
The data sources for both reports are perfectly credible. The earlier report was based on the PSRC’s regional Household Activity Survey. The numbers in the later report came from from PSRC’s Household Travel Survey. Same period, two reputable data sources—and opposite conclusions.
But where the two data sets agree, there’s good news: the share of trips taken on foot and by transit rose in both surveys. In absolute terms it was a modest boost, and from a low level. But if the data are to be believed, a small but important chunk of driving trips were replaced by walking and transit. And that was as of 2006—before fuel prices skyrocketed, and when the economy still seemed solid. I wouldn’t be surprised if 2008 figures—when fuel prices skyrocketed—showed even bigger gains in transit and walking.