
With the new 2010 Census data out, I thought it would be interesting to run the numbers on children in the Northwest. Like the nation as a whole, the region is aging. In many places, children now represent a smaller share of the population than they have in decades, and perhaps ever.
Here’s how the last decade shook out in the Northwest’s most populous areas:
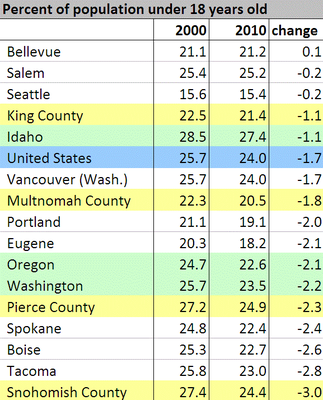

In keeping with national trends, nearly every large city and county in the Northwest saw its percentage of children shrink. Yet three cities stood out as relative child magnets with basically stable shares of kids: Bellevue and Seattle (both in King County, Washington) and Salem, Oregon. No other populous area in the region even comes close.
The reasons for the declining share of children are manifold. The biggest driver is probably the demographic fundamentals, as the nation and region experience the cycle of baby boom, bust, and echo boom. Other factors include temporary effects such as (perhaps) recession-induced anxiety, as well as longstanding shifts like reductions in teen pregnancy, women delaying or declining childbearing, and families choosing to raise smaller numbers of kids.
Still, in absolute terms, most places added kids. Over the last 10 years, for example, Bellevue grew by nearly 13,000 people, about 2,800 of whom were children. Salem added nearly 18,000, including more than 4,100 children. And Seattle added about 45,000 people, including more than 5,800 in the under 18 set.
Below the jump, I’ve included more specific analysis for Seattle, where hand-wringing about children sometimes feels like a civic duty.
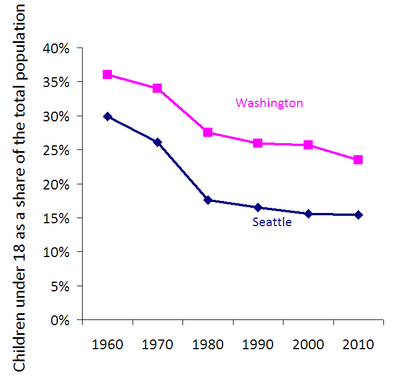
Seattle makes an interesting case for study. For decades, it’s been one of the most childless big cities in the nation. (Only San Francisco is really comparable.) Nonetheless, Seattle’s age demographics have tended to broadly echo the larger trends in Washington:

On closer inspection, however, it turns out that Seattle’s relative childlessness is largely a phenomenon of the 1960s and 1970s. In the chart below I analyze Seattle’s “kid gap,” expressed as a ratio of the share of Washington’s population that is children to the share of Seattle’s population that is children. (That’s the ratio between the pink and blue lines, in the chart above):
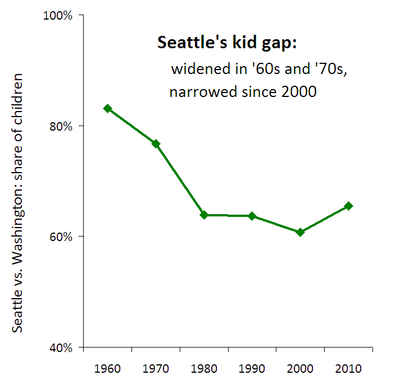

The analysis reveals a surprising trend. Between 1960 and 1980, children shifted out of the state’s largest city in a dramatic fashion. And even in the years between 1980 and 2000, the city’s kid gap widened just a bit further. But post-2000, Seattle’s “kid gap” narrowed for the first time in at least half a century.
***
Notes: All figures are calculated by me from the US Census Bureau, using the American FactFinder and American FactFinder2 tools. For the sake of concision, I limited my analysis to the most highly populated cities and counties (roughly above 120,000 for cities and 700,000 for counties). Data for the two Seattle charts come from Clark’s excellent analysis of these trends in his post “Childless in Seattle?” which should be required reading for anyone covering this topic. (I updated Clark’s numbers with the 2010 census figures.) The charts, along with a smidge of the writing, were modified on 5/4/11 to correct a data discrepancy.
joshuadf
Hi Erik, thanks for the great info. I was also curious, in my case about where in King County has “concentrations” of kids and ran some numbers by census tract. I really wasn’t sure what I would find. Interestingly Capitol Hill is one of the densest area for kids, and Seattle as a whole does quite well:http://joshuadf.blogspot.com/2011/04/population-under-18-per-acre-i-have.htmlOf course, the more detailed census files haven’t been released yet so there are still a lot of questions.
Gwen
Thanks for the analysis Eric. It might be interesting to note that in Bellevue, some of the densest neighborhoods saw the most growth in the number of children. Crossroads saw the largest increase of 709 children, or 27 percent, Downtown Bellevue saw the second largest increase of 419 children, or 335 percent, and Factoria saw an increase of 154 children, or 35 percent.
deborah barnes
As USA squanders 80% or so of the world’s resources it is about time we looked at lifestyle and population measured against environment, social and cultural impacts. Slowing population growth may mean that we are turning towards a value system of experiences, seeking to develop the full potential of everyone and trying to maximize health for all living things. Acknowledging our reliance on the natural services we have taken for granted forces us to see life in this new light. We need to be caretakers and wisdom seekers and that doesn’t get measured in GDP. (a whole new discussion of what is relevant)