We have new quarterly data in the latest coal report from the US Energy Information Administration, taking us up through the end of March 2013:
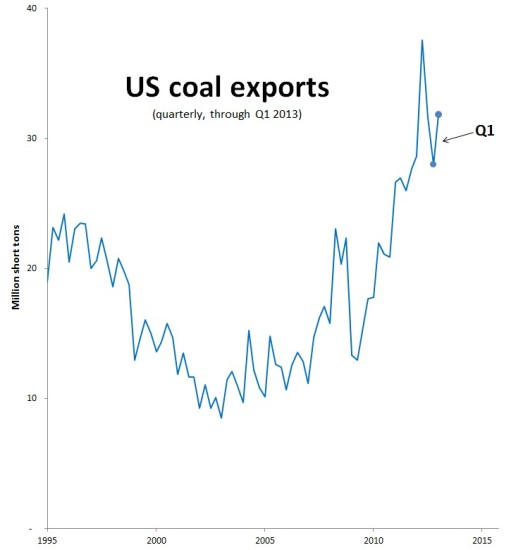
Nationally, coal exports notched up after two consecutive quarters of decline. The US shipped nearly 32 million tons of coal in the first quarter of 2013. That’s a lot by historical standards.
The Western Customs Region is only a bit player in national terms. Yet it’s also the scene of the roaring debate over planned coal export terminals, which would change that. The West Coast exported less than 1.4 million tons in the first quarter, a 36 percent fall off from the fourth quarter of last year.
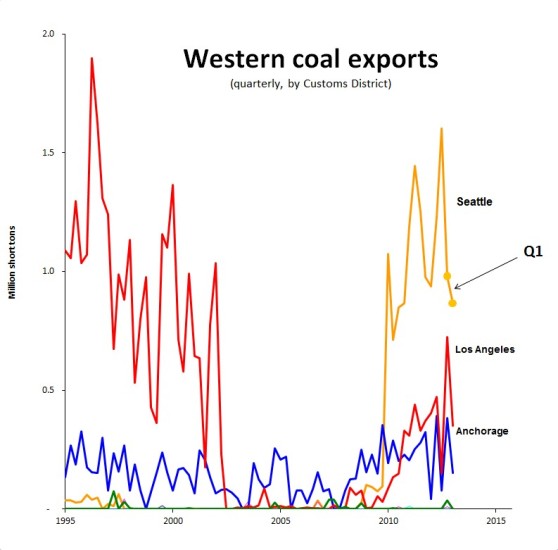

Every customs district in the West registered a decline with Seattle District shipments—entirely accounted for by coal traveling north from Washington into British Columbia for onward shipment to Asia—falling to 866,000 tons, a 12 percent decline from the fourth quarter of 2012. Coal exports also fell sharply in both the Los Angeles District (from LAXT at Long Beach) and the Anchorage District (from the Seward Coal Loading Facility).
The declines are likely driven by falling prices in Asian markets, which have substantially reduced the profitability of many US coal exporters.
That said, there are real questions about the accuracy of the official government numbers. Consider that in its first quarter investor report, Cloud Peak Energy claimed responsibility for 1.1 million tons of coal exported to Asia. In the past we have assumed that all of Cloud Peak’s coal exits via the Seattle District en route to British Columbia’s Westshore Terminal, which I still believe is right. But Cloud Peak’s Q1 figure actually exceeds the total reported for the Seattle District, a fact that I think raises further questions about the reliability of official US export numbers.
As I’ve noted in the past, the official US Customs figures reported by the US Department of Energy—those I’m relying on in this blog post—should be treated with caution. In some cases they are at odds with the numbers given by coal terminals, by anecdotal accounts of coal train movements, and with shipment claims by the coal industry. For example, financial information for the Westshore Terminal implies that the Seattle District exported something like 8.6 million tons in 2012, compared to the 4.7 million reported by US officials. (See p. 6, “Shipments from [US thermal coal] shippers accounted for approximately 29% of Westshore’s volume in 2012.”)
And there’s a continuing mystery in the Great Falls Customs District, which includes the Sweetgrass, Montana border crossing, the logical route from the Powder River Basin to the Ridley Coal Terminal at Prince Rupert. Official reports continue to show zero or near-zero figures at Sweetgrass. Yet rail watchers report that several coal trains are crossing the border each week, and the Ridley Terminal also claims to be handling at least a modest volume of US coal.
The EIA is promising second quarter 2013 data in September, and I’ll report on it here when it’s available.
Thanks to Pam MacRae for research assistance.
All figures in this post are given in short tons. All of my reporting on quarterly coal export volumes can be found in the series “Coal Export Trend Reports.” All data come from the US EIA’s latest quarterly coal report, covering the entire Western Customs Region. In addition to the districts shown on the chart here, the Western Region includes the Portland, Nogales, San Diego, and San Francisco Districts. These districts have been reporting virtually no coal exports.
Please note: The second chart shows Customs Districts, not individual ports. The Port of Seattle does not move coal, for example.