Late last week, the US Department of Energy released new figures in its quarterly coal export report. Here’s what happened up through the end of the year, 2013:
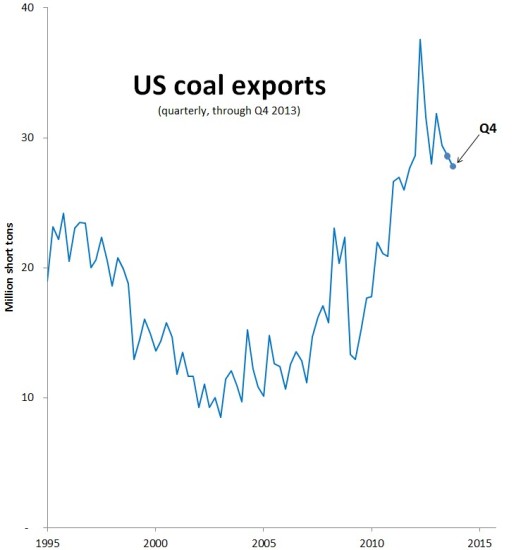
Original Sightline Institute graphic, available under our Free Use Policy
Nationally, coal exports were down nearly 3 percent in the final quarter of 2013.
Overall in 2013, the US exported almost 118 million tons of coal. It was unquestionably a lot by historical standards, but even so it represented a 7 percent decline from the record export levels of 2012.
The Western Customs Region, center stage in the ferocious debate over expansion capacity, is currently only a minor player in the national coal exports scene. The West Coast exported roughly 2.2 million tons in the fourth quarter of 2013, about 5 percent less than the previous quarter. Just so, total export figures for 2013 also registered about 5 percent lower than they did in 2012.
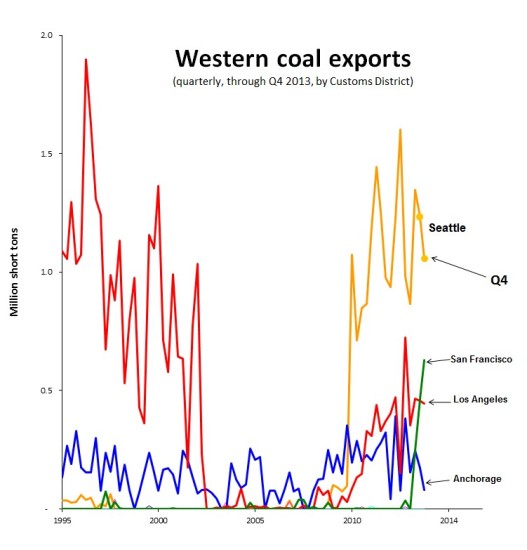

Original Sightline Institute graphic, available under our Free Use Policy
The Seattle District plays the biggest role in western coal exports, where the data refer solely to coal traveling north from Washington into British Columbia for onward shipment to Asia. In this region, coal exports declined 14 percent in the fourth quarter to just over 1 million tons.
In its fourth quarter investor report, Cloud Peak Energy claimed responsibility for 4.7 million tons of coal exported to Asia by way of BC’s Westshore Terminal. It’s a figure that slightly exceeds the total reported volume crossing the border to BC, and it implies that Cloud Peak coal accounts for all of the coal moving through Seattle en route to Canadian terminals for export.
Coal exports declined slightly in the Los Angeles District (from LAXT at Long Beach where Arch Coal ships small amounts of Western bituminous coal) and also declined in the Anchorage District (from the Seward Coal Loading Facility). In the San Francisco District, an area that has in recent years registered virtually no coal movements, exports continue to rise, reaching nearly 630,000 tons in the fourth quarter. (Observers believe these shipments are happening at the Port of Stockton and the Levin-Richmond Terminal.)
Please remember that there are serious questions about the accuracy of the official government coal export numbers. For more about these inconsistencies, please read this post.
The EIA is promising first quarter 2014 data in June for individual customs districts, and I’ll report on it here when it’s available.
All figures in this post are given in short tons unless otherwise noted. All of my reporting on quarterly coal export volumes can be found in the series “Coal Export Trend Reports.” All data come from the US EIA’s latest quarterly coal report, covering the entire Western Customs Region. In addition to the districts shown on the chart here, the Western Region includes the Portland, Honolulu, Nogales, and San Diego Districts. These districts have been reporting virtually no coal exports.
Please note: The second chart shows Customs Districts, not individual ports. For example, the Port of Seattle does not move coal.