It’s common knowledge near the US-Canada border that lots of things are cheaper down south. Head to Whatcom County, Washington, and the locals will complain about Canadians holding up the line at the gas station: “They’re even filling up black plastic garbage bags!” They will point you to a video of Canadian piranhas devouring a crowd of Bellinghamsters (or at least their milk supplies at Costco). They will tell you about the Facebook page called “Bellingham Costco Needs a Special Time Just for Americans.” They may even regale you with stories of Pirate Joe’s, whose business model is to buy out the Trader Joe’s stores near the border and then resell everything to Canadians desperate for pomegranate vinegar.
All of this brings to mind two questions. One, of course, is why don’t companies in Whatcom County expand their stores? (Answer: The smart ones are expanding. For example, Costco is seeking permits for a new store in Bellingham. As for Trader Joe’s… well, instead of opening a branch near the border, the company is still trying to sue its best customer.)
The second question is about the British Columbia carbon tax: How much of the reduction in petroleum consumption in British Columbia (see graph below) is caused by Canadians filling up south of the border?
The answer: not much.
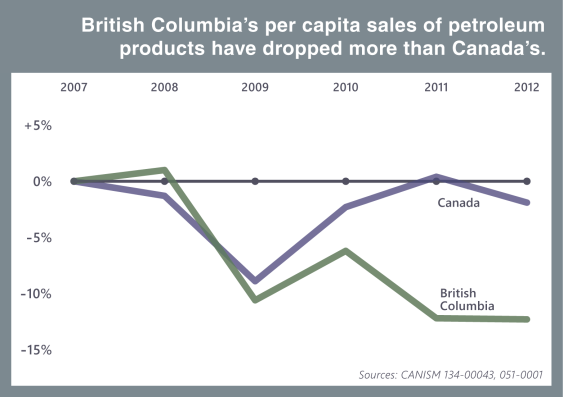
Original Sightline Institute graphic, available under our Free Use Policy.
Before I’m attacked by enraged Hamsters, let me be clear: I feel your pain, and your eyes don’t lie: cross-border trade is a huge economic player in Whatcom County, accounting for almost half of all credit-card transactions in Bellingham, according to one estimate.
But consider two key points, each of which independently supports the answer “not much.” (And, as we learned in middle school, “not much” times “not much” equals “really not much at all.”)
Key Point No. 1 is that we’re trying to estimate the amount of leakage caused by the BC carbon tax. It turns out that there are a host of other factors that affect the cross-border gasoline market, including exchange rates, regulations, other taxes unrelated to the carbon tax, and even the ease of crossing the border. For example, US government subsidies and other programs in both countries help explain Canadians’ insatiable demand for US milk. (Milk in Canada costs about US$8 a gallon.) And the Canadian-driven expansion of the Bellingham airport has nothing to do with the BC carbon tax because the carbon tax doesn’t apply to out-of-province air travel.
As for gas prices, the figure below shows ten years of gas price differentials between British Columbia and Washington State; on average gas has been about $1 a gallon more expensive in BC, and it’s currently more expensive by about $1.25. The impressive line at the top shows how much of that spread is the result of factors completely unrelated to the BC carbon tax; note in particular the impact of the financial crisis during the fall of 2008. The rather less impressive line at the bottom shows how much of that spread is the result of the BC carbon tax. (The tax started at Can$10 per ton CO2 in July 2008 and went up by Can$5 per ton per year until it peaked at Can$30 in July 2012; the smaller fluctuations in the carbon tax line come from exchange rate movements.)
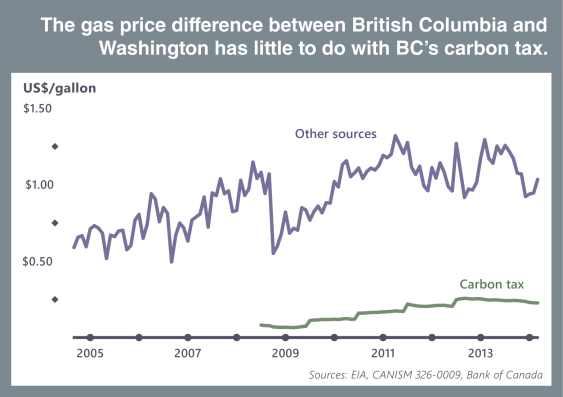

Original Sightline Institute graphic, available under our Free Use Policy.
It’s clear that the BC carbon tax is only a small part of the story here, perhaps as much as 20 percent (based on the share of the total gas price spread due to the carbon tax) but probably closer to 5 percent. That’s because the question is, How much extra cross-border gas consumption is happening because the spread is $1.25 per gallon rather than $1.00 per gallon? It’s hard to imagine too many people reacting to the extra 25 cents, especially because many Canadians cross the border for all sorts of shopping and adventure and just happen to fill up their tanks on their way home.
As for Key Point No. 2, take a look at the Pac-Man population figure below. There are 4.4 million people in British Columbia. That’s 22 times the population of Whatcom County (200,000) and 55 times the population of Bellingham (80,000). So Key Point No. 2 (no offense to our friends in Whatcom!) is that what looks like a mountain to Bellingham is only a molehill to British Columbia.
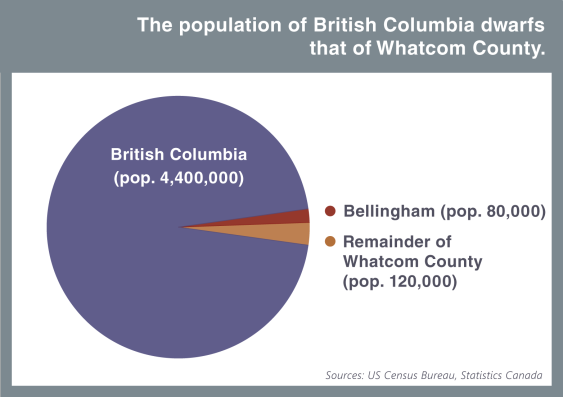

Original Sightline Institute graphic, available under our Free Use Policy.
To delve into this more deeply it would be great to have county-level data on gasoline consumption in Washington State, but there’s only state-level data. There are, however, other data sources that shed light on the story, including a complicated reckoning from Andy Skuce. The easiest path that I see comes from the correlation between gas stations per capita and gasoline consumption per capita: As shown in the figure below, 63 percent of the difference in the number of gas stations per capita across the 50 US states and the District of Columbia can be explained by differences in gasoline consumption per capita. A similar relationship is likely to hold at the county level—remember that we’re just looking for a ballpark estimate—and allows us to get around the unfortunate lack of county-level data.
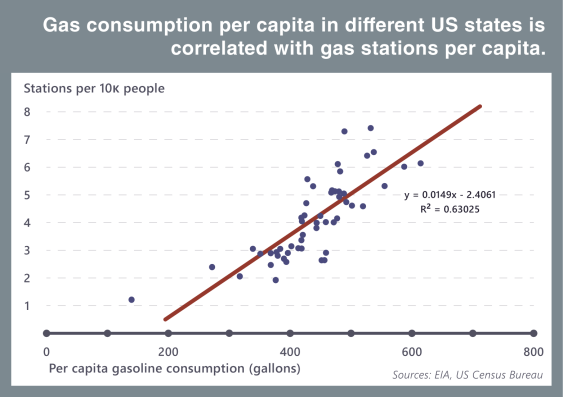

Original Sightline Institute graphic, available under our Free Use Policy.
Here’s how this approach works:
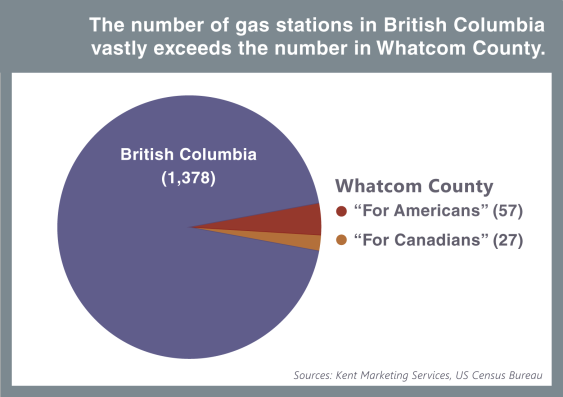
- According to the 2012 National Retail Petroleum Site Census, there are 1,378 gas stations in British Columbia, or about 3.1 stations for every 10,000 people.
- According to a 2011 study by the US Census Bureau, there are about 84 gas stations in Whatcom County, or about 4.1 gas stations per 10,000 people.
- The same data source shows that there are about 1,914 gas stations in Washington State, or about 2.8 gas stations per 10,000 people. So Whatcom County has about 4.1 – 2.8 = 1.3 “extra” gas stations per 10,000 people.
- If we attribute the “extra” gas stations in Whatcom County to demand from Canada, we can estimate that 57 of the county’s 84 gas stations are “for Americans” and 27 are “for Canadians.”
- The 27 gas stations “for Canadians” in Whatcom County make up 2 percent of the 1,378 gas stations in British Columbia.
So we end up with another Pac-Man figure:

Original Sightline Institute graphic, available under our Free Use Policy.
Want to add other Washington counties that get heavy traffic from Canada? Let’s throw in Skagit County (4.5 gas stations per 10,000 people), Okanogan County (7.5 gas stations per 10,000 people), and Ferry County (11.9 gas stations per 10,000 people). Comparing with the Washington State average of 2.8 gas stations per 10,000 people, we see that the Canadians pick up 19 of the 52 gas stations in Skagit County, 19 of the 31 gas station in Okanogan County, and 7 of the 9 gas stations in Ferry County, for a total of 72 “Canadian” gas stations in the four-county area. Our 2 percent estimate goes up to 5 percent. In other words, perhaps 5 percent of the gasoline consumed by British Columbians is purchased in the US.
One way to check this is to look at fuel tax receipts in five Whatcom County jurisdictions that are so close to the border that they are allowed to levy a 1 cent per gallon local gas tax to fund road maintenance. Annual revenues in those jurisdictions—Blaine, Nooksack, Point Roberts, Sumas, and Everson—of just under $200,000 means gasoline consumption of about 20 million gallons, which is about 1.5 percent of the 1.2 billion gallons consumed in BC. This 1.5 percent estimate might be too low because it doesn’t include the Bellingham Costco, or it might be too high because it includes gas purchased by Americans as well as Canadians, but as a ballpark estimate it’s in line with our 5 percent figure.
And remember that this isn’t the only mountain-and-molehill story here. Key Point No. 1 shows that the carbon tax accounts for perhaps 5–20 percent of the spread between gas prices in British Columbia and Washington. Put the two key points together and the cross-border effect on the BC carbon tax is at most 1 percent. This is similar to the result that Andy Skuce gets.
We can also try to estimate the “carbon tax effect” quantitatively from the gas station data. In 2007, the year before the carbon tax, there were 1,967 gas stations in Washington State, of which 80 were in Whatcom County (compared to 2011 figures of 1,914 and 84, respectively). If Whatcom County had followed the statewide trend between 2007 and 2011, it would have ended up with 78 stations instead of 84. So the extra number of gas stations “for Canadians” between 2007 and 2011 is only 6, which is less than 0.5 percent of the total number of gas stations in British Columbia. Double that if you want to cover the four-county area and you get the same 1 percent estimate, but remember that all these results are probably overestimates because they include not only the carbon tax but also exchange rate effects and other factors such as the development of the fast-pass NEXUS border system.
So to all our friends in Whatcom County, we say, “Cheer up!” Yes, you may have to put up with off-duty police officers directing traffic at Costco and cross-dressing Canadians buying out Trader Joe’s.
But at least the BC carbon tax is working well. What looks like a Canadian invasion turns out to be much more modest from British Columbia’s perspective. (And remember that 28 percent of them can’t invade because they don’t have passports!)
And, of course, for Washingtonians who really want to send the invading hordes back north, one good move would be to adopt a BC-style carbon tax in Washington State.


Elsa
Thank a Canuck for leaving a buck. Whatcom County thrives thanks to the Canadian consumers.