Despite its widely discussed woes, every year the European Union Emissions Trading System (EU ETS) cuts more carbon pollution than the entire state of Oregon spits out. That’s no small feat. The EU cap-and-trade program limits carbon dioxide emissions from more than 11,000 power stations and industrial plants in 31 participating countries, covering 45 percent of the EU’s total greenhouse gas (GHG) emissions. The market has operated for nearly a decade with no price manipulation and no deleterious economic impacts, and it is on track to reduce pollution 21 percent below 2005 levels by 2020.
Nonetheless, the early years were rocky for Europe’s carbon-pricing pioneer. Here’s what Oregon and Washington can learn from the EU’s missteps.
(1) Set the cap right
(1.1) Use actual emissions data.
The EU ETS began with a pilot phase from 2005 to 2007. During this phase, to quell industry fears and opposition, the EU gave companies carbon allowances for free. Because the EU did not have verified emissions data, it asked companies to estimate the number of allowances they would need. Unsurprisingly, some power plants and industrial facilities used over-optimistic growth projections and overestimated their future emissions, so the EU handed out more allowances than needed. When verified emissions data became available in 2006, participants realized that there were too many carbon allowances in the market, and the price crashed.
California learned from this experience and began collecting verified emissions data years before starting its cap-and-trade program. It then based its cap on actual emissions, not self-reported estimates. Cascadia can avoid over-allocation and price shocks by setting its cap based on verified emissions data. It can help the market function smoothly by making this data publicly available and keeping it transparent.
(1.2) Count other carbon-cutting policies.
The EU also neglected to account for other carbon-cutting policies, like its 20 percent renewable energy and energy efficiency goals. These other policies worked, pollution dwindled, and the cap was left even higher and dryer. Cascadia can set a more aggressive cap by factoring in its other GHG-paring policies.
(1.3) Don’t be afraid of affecting GDP.
Like the Northeast’s Regional Greenhouse Gas Initiative (RGGI), the EU ETS shows that we can reduce emissions without harming GDP. The chart below shows that EU GDP (aqua) grew while the cap (orange) required emissions (purple) to decline. As is often the case with programs to scale down pollution, naysayers predicted that the ETS price would be too high and that it would harm the economy. It turns out that the ETS has curtailed pollution at such low cost that the carbon price may be too low to stimulate further investment.
The lesson for Cascadia: Don’t bet against our own ingenuity. Push back against the inevitable political pressure to overestimate the costs of cutting pollution. Chicken Little has been wrong again and again. We can set a tight and fast-declining cap. Given the opportunity and the incentive, people will find ways to trim pollution.
 (Used with permission.)")
Source: Environmental Defense Fund, The EU Emissions Trading System: Results and Lessons Learned, 2012 (used with permission).
(2) Create confidence in the future market
The long-term price on carbon drives long-term investment decisions. For example, despite the low price during the second half of the pilot phase, the ETS still reduced carbon by 1 percent per year because companies anticipated a tighter cap in Phase II (2008-2012). During Phase II the ETS trimmed emissions by even more (about 3 percent per year).
However, pollution trimming in Phase III (2013-2020) is now undermined by the persistent oversupply of allowances and by the fact that the cap is uncertain past 2020. Although the EU has a target of 40 percent below 1990 levels by 2020, the current trajectory is too high to meet that goal or the EU’s 2050 Roadmap goals. Although the EU aspires to a permanent cap, its current trajectory is still too high. The current cap reduces at 1.74 percent per year, but to slash emissions to the levels needed in 2050 the cap would need to descend by around 2.4 percent per year.
Recognizing the surplus and the possibility that the market may not be inspiring the future paring of pollution, in 2012 the European Commission suggested six possible market reforms. But the process to implement reforms has been slow and politically fraught, with market prices following political decisions. This year the EU took its first action to mitigate the oversupply by “back-loading,” or delaying until 2019, about half of the allowances scheduled to enter the market in 2014. The EU is also considering establishing a market stability reserve to further shore up the future market. The reserve creates confidence that supply will not build up excessively.
The back-loading decision injected some confidence about the market, but it does not address the cap’s trajectory to 2020 and beyond.
")
")
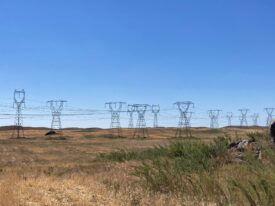
EU carbon prices have been low since 2008. Data from European Environment Agency and Intercontinental Exchange. (Used with permission.)
Cascadia’s programs could learn from Europe’s by including the following features from the start:
- A long-term, ambitious trajectory
- A review and reform mechanism
- Cost containment measures
- Transparent information
(2.1) Set a good long-term goal.
Cascadia can extend its carbon price to at least 2050 and aim to chop emissions by 80 to 90 percent. A cap that doesn’t last long enough will not motivate long-term action. Announcing the entire trajectory from the start gives everyone a crystal clear message about the enormous opportunities open to them if they invest boldly in a post-carbon future.
(2.2) Build in a review mechanism.
A carbon-pricing program cannot permit political meddling, but it should be able to respond to new information in a timely and orderly fashion. RGGI’s built-in review allowed the RGGI states to adjust the cap after the 2008 economic downturn, whereas the EU ETS, with no built-in instrument for change, is still struggling to respond to events from more than five years ago. A review mechanism that strikes the balance between certainty and flexibility can increase confidence in the price.
(2.3) Include price stability measures.
Built-in cost containment mechanisms such as banking, a price ceiling, and a market stability reserve can reduce price volatility and curb the urge to unnecessarily trigger the review mechanism. In Phase II the EU ETS began to use banking to help decrease price volatility, but is only now contemplating establishing a market stability reserve that would automatically withdraw allowances from the auction when the cumulative number of unused allowances gets too high. Cascadia can follow California and RGGI’s lead and include a package of these cost-containment measures.
(2.4) Make information easily available.
The EU ETS used national registries until 2012, when it finally instituted a single Union Registry. Balkanized information about the market impedes smooth functioning and long-term confidence. A centralized and transparent source of information starts the market on the right foot. Transparency also helps prevent fraud.
(3) Avoid windfall profits
In the first phase, unregulated power producers got their allowances for free but still charged customers a carbon price. Customers paid higher prices, and power producers pocketed the money. This development was not a surprise. It was, however, a design flaw, and it played out almost exactly as predicted.
(3.1) Auction allowances.
The simplest way to avoid windfall profits is to auction allowances instead of giving them away for free. The EU ETS started with zero auctioning in the pilot phase and a mere 3 percent auctioning in Phase II. Now it auctions 100 percent of power sector allowances and is moving toward auctioning 70 percent of industry allowances in 2020. RGGI neatly avoided any windfall profits by auctioning almost all allowances from the start. California auctions most allowances.
(3.2) If you must give away allowances for free, do it wisely.
If it is politically impossible to auction all allowances, Cascadia can, at a minimum, use the right information to decide how many allowances to give away.
Again in this situation the EU hamstrung itself at the outset. It initially allocated allowances based on each facility’s past performance. This scheme rewarded poor performers and dis-incentivized efficiency improvements. To correct course, the EU has since started allocating allowances to industrial facilities based on a benchmark set at the top 10 percent of performers in the sector. This rewards efficient facilities and encourages others to step up their game. And the system keeps upping the ante: most industries received 80 percent of the benchmark in 2013, but that will decrease to 30 percent in 2020, and there will be no free allocation by 2027. Cascadia can set benchmarks based on top industry performers and allocate allowances based on that benchmark, not based on (possibly poor) past performance.
The EU feared that a carbon price could put many industries at a competitive disadvantage, so it showered all emitters with allowances. The EU improved its policy starting in 2013; now only firms in sectors specifically identified as “emissions-intensive trade exposed” will receive 100 percent allowances up to the benchmark. California has also gone to great effort to identify sectors that would be at a competitive disadvantage and used allowance allocation to keep those sectors competitive.
Oregon and Washington would do well to carefully identify industries that do need to be protected from competitive disadvantage and not protect those that don’t need such safeguarding.
(4) Be careful with offsets
(4.1) Only allow high-quality offsets.
The initial design of the Clean Development Mechanism (CDM), an offsets program that allows EU factories to meet their cap by paying for pollution reductions in developing countries, contained flaws that allowed participants—particularly plants in China producing a particularly potent GHG called HFC-23—to manufacture credits without producing real reductions. One of the key concepts in the world of offsets is “additionality”—the idea that emissions reductions must be beyond the reductions that would have occurred anyway.
During the pilot phase, 20 percent of CDM projects had “unlikely or questionable” additionality, meaning they probably would not have pared pollution at all. The CDM Executive Board has since strengthened its verification process, and the EU has decided to phase out the more questionable projects. In fact, post-2012, no offsets from China or India will be allowed. California has put countless professional hours into developing high-quality compliance offset protocols, and the EU has now significantly improved its offset process. Cascadia can take advantage of their work.
(4.2) Limit the quantity of offsets.
Starting in 2013, the EU restricted offsets to no more than 50 percent of required reductions for the period 2008-2020. In practice, this means that existing ETS-regulated carbon polluters may substitute offsets for up to 11 percent of the emissions allowances they are obliged to hand over in each compliance period. This ratio is more permissive than California’s 8 percent limit or RGGI’s 3 percent limit. Offsets are just another cost containment measure. If Cascadia has a robust package, there is no reason to allow excessive offsets.
Conclusions
The EU ETS stumbled at the outset with overabundant free permits, inadequately regulated offsets, no mechanism for course-correction, and an insufficiently certain time horizon. It is much broader than RGGI, covering 45 percent of emissions in 28 countries (compared to 22 percent in nine states), but it has spent years bandaging over its design flaws to catch up to where RGGI and California started. Oregon and Washington can avoid most of the EU’s mistakes by simply joining California’s system or copying British Columbia’s carbon tax shift. However, both options would still leave Cascadia without enough certainty into the future, and a BC-style tax shift would not have enough carbon coverage. If Oregon and Washington really want to hit it out of the ballpark, the states could join California’s system and commit to a cap through 2050. Or Cascadia can emulate British Columbia’s system but cover more kinds of climate pollution and commit to continue increasing the carbon-tax and decreasing income taxes.


Sam Bliss
As to point (1.2) “Count other carbon-cutting policies.”
Economists tend to like cap-and-trade because, all else equal, businesses will collectively undertake the least costly set of emissions reductions to meet the cap. But all else is not equal. Subsidies for solar and wind the overlap with a cap-and-trade scheme implicitly tax energy-efficiency projects by making it cheaper to switch to renewable energy. Ultimately, the cap determines the total emissions from a carbon-trading system, so incentives for climate-friendly energy don’t actually reduce emissions! They merely alter the set of emissions-reduction strategies chosen by the ‘carbon market’ in favor of what’s being subsidized, at the expense of everything else. Cap-and-trade will perform best in the absence of energy subsidies (including those for fossil fuels, of course).
Furthermore, the ETS and RGGI and every market-based climate policy I know of fail on another level. Obviously, we need to decrease global emissions, not regional emissions. A regional carbon tax or cap-and-trade scheme must count GHG emissions based on consumption, not just emissions released within the border. In Europe, consumption-based emissions (the GHGs released in producing all the goods and services the EU consumes) have actually risen, even as the ETS cap has decreased modestly. This essentially means that climate-polluting industries have moved to places with less stringent climate policy, producing emissions reductions according to conventional GHG accounting methods.
John Day
Sorry, I don’t quite get “Subsidies for solar and wind… implicitly tax energy-efficiency projects by making it cheaper to switch to renewable energy.” How do subsidies that make it cheaper to switch to renewable energy “tax” energy-efficiency projects?
I think I get the part about the cap ultimately determining emissions, thus potentially nullifying alternative energy subsidies. That’s a good point, but isn’t it exactly the sort of problem that (1.2) Count other carbon-cutting policies is intended to address? I’m still not sure exactly how that would work, though.
Sam Bliss
Cap-and-trade sets a cap, firms trade emissions permits (the number of which corresponds to the cap) such that firms who can reduce emissions most cheaply will do so. In standard economic theory, it’s the most cost-effective way to achieve a given level of emissions reductions.
Now add in subsidies for solar and wind production. Reducing emissions by switching fuels to solar and wind just got cheaper, from the perspective of the individual firm (in the short run, it costs society the same but now the government is paying some of that cost with tax revenue and money creation). So permits will change hands among the group of firms such that more solar and wind projects are undertaken relative to the counterfactual, i.e. without a subsidy. So renewable energy makes up a greater emissions reduction, and thus energy efficiency will account for a smaller portion of the emissions reductions necessary to meet the cap. Check out this piece for a more in-depth description of how subsidies undermine carbon markets’ efficiency, and how to fix it.
John Day
I meant to add that your point about consumption-based emissions rising while the cap has decreased seems like an important one that must be addressed as a part of any effective GHG reduction strategy.
Sam Bliss
Yes John please spread this idea. A carbon tax at the border on embodied emissions would make a big difference, but would probably be shot down as ‘protectionism’ by the WTO or something like that.
Kristin Eberhard
An even playing field with no subsidies would certianly be better.
However, some complementary policies do play an important purpose even in the absence of subsidies. Complementary policies for sectors covered by the cap (like electricity) don’t decrease overall emissions, but they CAN decrease costs. A perfectly functioning market will seek out the lowest cost reductions. But markets do not function perfectly: there are many negative cost options (ie: we would make money by taking these actions) available right now that we are leaving on the table. See one cost curve here– the negative costs are on the left side and are mostly energy efficiency. If efficiency is already a money maker but we aren’t doing it, then adding a carbon price isn’t going to make us do it either. There are other market barriers at play, and we need policies that attempt to directly over come those market barriers in a way that a simple price never will.
As to the consumption-based emissions vs in our borders — this is absolutely true and needs to be addressed. California’s program does address all consumption in the state, whether the emissions were produced in the state or not. This is complicated, though, and a global program would of course be a much neater and simpler way to solve the problem.
Sam Bliss
Also, “The EU also neglected to account for other carbon-cutting policies, like its 20 percent renewable energy and energy efficiency goals. These other policies worked, pollution dwindled, and the cap was left even higher and dryer.”
It was not policies that reduced emissions — it was a global economic crisis that led to a long production slowdown.
John Day
Clearly the global economic crisis has resulted in reduced emissions. I believe Kristin Eberhard’s piece above acknowledges that. It seems a little disingenuous, however, to state that the major expansion of solar and wind power in countries such as Denmark and Germany has not had a significant impact on emissions as well.
Rogers Weed
I’m not sure how Kristin can conclude that the EU’s ETS did not harm the economy. Her chart simply shows that the ETS did not cause the economy to shrink. Am I missing something?