")
")
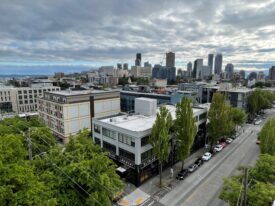
In my last post, I focused on Seattle’s nascent neighborhood greenway system, which aims to create a network of residential streets that elevates the needs of kids, cyclists, parents pushing strollers, elderly shoppers with carts, pet walkers, and other foot-powered travelers.
To get a sense of how that works, we only need look to the city that Seattle stole many of its ideas from: Portland. It’s been building some version of greenways since the 1980s. There, they evolved from traffic-calming projects to bike boulevards to what the city now calls neighborhood greenways.
In their most modern incarnation, family-friendly greenways elevate the needs of pedestrians and cyclists by making it difficult for cars to mindlessly speed through residential neighborhoods—usually through some combination of lower speed limits, speed humps, intersection art, other calming techniques, or traffic diverters that force vehicles off the greenway.
They also aim to reduce the chances that a walker or cyclist will be hit by a car. Typically, the city installs stop signs that force drivers to stop at minor intersections before crossing the greenway. A range of improvements—from signage to refuge islands to activated traffic signals—are installed to help pedestrians and bikers safely cross major intersections.
That formula wasn’t locked in overnight, though. It took years for Portland to learn how to build great greenways. Here are a few of the key takeaways:
- Greenways shouldn’t be all about bikes. Streets that feel comfortable to people on foot reduce the chances that kids and other pedestrians will be injured and are free of cut-through traffic benefit a much broader demographic.
")
")
- That said, they are popular with bicyclists—they report traveling out of their way to travel on Portland’s greenways. They don’t go out of their way to use painted bike lanes on busy streets.
")
")
Yay bikes! by Greg Raisman used under CC BY-NC-SA 2.0
- The jury is still out (though hopefully not for long) on whether greenways are actually attracting new cyclists in large numbers, or mostly serving people who were already active riders and previously used other routes.
- It’s essential to lower car traffic and speeds. Without adequate attention to traffic calming, the same things that make greenways attractive to cyclists can also make them attractive to cars. That makes them less safe and valuable for everyone else.
- It’s cheaper and easier to calm traffic on streets that already have low volumes to begin with. So it pays to pick routes wisely.
- Finally, outreach programs like Sunday Parkways—where eight-mile loops of neighborhood greenways are closed to cars—are great tools to help people discover where the best bike routes and other neighborhood gems are. (Spoiler: Seattle is stealing this idea soon…)
The Evolution of Portland’s Bikeways
To grasp just how far ahead Portland is, here is its latest map showing its network of “low-traffic, low-stress” routes, aka greenways:


Image by City of Portland
And here’s how that compares to Seattle, which built its first neighborhood greenway in 2012. The first map shows existing greenways, which clearly don’t connect yet, and the second highlights the 52-mile neighborhood greenway network the city hopes to build over the next five years.


Image by Seattle Department of Transportation
According to Portland Bureau of Transportation safety specialist and greenways guru Greg Raisman, the city really developed that network in three phases. Back in the 1980s, it experimented with some aggressive traffic-calming projects on streets like Lincoln, Clinton, and Harrison Streets in Southeast Portland, which in some cases cut traffic on streets that once carried 5000 cars a day by more than half. It was controversial, but people eventually saw benefits, Raisman said:
After these projects went in it turned out that not only was it safer to live there, but it was safer to walk and bike there. And they became popular bike routes. Hawthorne Bridge today is one of the busiest bicycle bridges in America, and that thing is basically fed with residential routes. You don’t see a lot of bike lanes feeding that—you see green lines.
That helped inform the development of the city’s Bicycle Master Plan in 1996, in which these traffic-calmed routes were rebranded as “bike boulevards.” Over the next five years, the city added to that network of residential, low-traffic bikeways as well as striped more than 100 miles of bike lanes on busy arterials.
As the chart below shows, for much of the 2000s—when Portland biking numbers really started booming—the city actually wasn’t adding that many miles of new bike infrastructure. Then in 2009, it started building a different kind of facility, based on research that suggested many residents were interested in biking but felt unsafe riding on unprotected bike lanes next to heavy car traffic.
That’s when the city starting building improved versions of bike boulevards on streets with even lower car volumes—which were rebranded once again as neighborhood greenways— as well as a much smaller number of protected bike lane miles.


Image by City of Portland
But that building boomlet didn’t last long. Even though Portland’s transportation department has accomplished a lot with little money (at its height, the department was dedicating about $1 million a year to neighborhood greenways), lack of funding for any kind of street improvements has seriously hampered Portland’s ability to keep building neighborhood greenways. Without the cash infusion from the proposed Portland Street Fund, that’s unfortunately unlikely to change.
New and Improved Greenways
Portland’s newest neighborhood greenways have a few key differences than the older bike boulevards. As the name implies, bike boulevards were conceived and sold primarily as bike infrastructure. The public conversations around greenways take into account pedestrian safety, neighborhood livability, community building, needs of families with kids, and improving mobility for users of all ages.
")
")
Installing 6th and Going by Greg Raisman used under CC BY-NC-SA 2.0
Another key difference is that bike boulevards were originally located on streets with as many as 3000 cars a day, while neighborhood greenways are targeted for streets that have fewer than 1000 cars. As Raisman puts it:
The difference between starting on a street that has 5000 cars a day and a street that has 800 cars a day is enormous. That really determines how effective I can be in creating a really family-friendly place. We really strive to be under 1000 cars a day now, and lower is better. A lot of our new neighborhood greenways have 600 cars a day. When you think about that, that means that essentially during rush hour that’s one car a minute.
Similarly, the city is aiming for much slower vehicle speeds now. On bike boulevards, if 85 percent of the cars were moving slower than 30 miles per hour, the city didn’t undertake any additional traffic-calming measures. On greenways, the city is now designing traffic calming measures to slow vehicle speeds to 20 miles per hour, following a change in state law that allows cities to reduce speeds on residential streets. Speed humps like the one below have been among Portland’s most effective tools.
")
")
Terry Neighborhood Greenway by Greg Raisman used under CC BY-NC-SA 2.0
To reduce volumes, the city in some cases also uses traffic diverters that allow bikes and cars to pass through but force cars to turn off the greenway. (Interestingly, Portland’s Michigan greenway showed a diverter can reduce traffic and make residents happier but doesn’t guarantee cyclists will immediately flock to the route.)
")
")
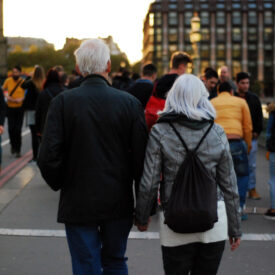
When greenways succeed in achieving lower traffic volumes, the calmer atmosphere allows for social interaction and people to ride next to each other and chat (unlike painted bike lanes on busy arterials):
")
")
Where neighborhood greenways cross busy streets, the city now revamps intersections to take the needs of pedestrians—who move more slowly than bikes—into account. And the last big difference is the attention Portland has paid to signage and wayfinding, which has made it easier for people to figure out how to get across the city on the greenway network.
But Who Uses Them?
As the chart below shows, bike traffic has generally (but not always) increased after greenway improvements were installed. But that doesn’t really answer the question of whether greenways are attracting new cyclists or just offering a quieter alternative for people who used to bike on other streets and just changed routes.


Image by City of Portland 2011 Bike Counts Report
That’s a key question for Portland, which saw huge numbers of new bikers taking to the roads from 2000 to 2008. Depending on what metrics you’re using, that growth has either slowed or completely stagnated since then. Curiously, as the next chart shows, the boom in people biking happened at a time when the city wasn’t really adding that many new miles of bike infrastructure. And that growth began to level off just as the city started investing in neighborhood greenways around 2009.


One could argue that the biking boom was the result of investments that the city made a decade earlier and that it takes time for people to discover and start using infrastructure. And that the same thing may happen as a result of the city’s recent investments in neighborhood greenways. But who knows?
That’s why people trying to figure out why Portland staggering growth in new bikers has slowed would love to know how effective greenways are in convincing people who were previously afraid or reluctant to hop on a bike and try it. The city is undertaking a deep dive into neighborhood greenway data to get a better handle on who who uses them and how they could be improved, with a public report due in 2015. As Raisman argues:
I think greenways are attractive for people who might otherwise feel uncomfortable on other kind of roads. I do expect and I do think that growth is already starting to happen. But even if the most negative potential hypothesis has any weight—when people say “oh gosh, you’re just moving cyclists from a busy street to a quiet street that’s safer and more comfortable”—is that bad?
Data collected so far do offer some tantalizing tidbits. Studies in 2009 and 2012 both found that cyclists will go out of their way to bike on greenways. In the latter, which used GPS to track where 164 Portland cyclists actually ride, people preferred separated bike paths and neighborhood greenways above other options. Bike commuters were willing to increase their trip distances by 10 percent to bike on a greenway, and non-commuting cyclists were willing to go 17 percent out of their way.
Interestingly, cyclists did not go out of their way to use unprotected bike lanes on busy arterials, where the study found the advantage of having that bike-specific infrastructure was washed out by the disadvantages of adjacent traffic.
Another Portland State University study, though, suggests greenways might under-deliver on some of the presumed benefits. It tracked the activity levels of Portland parents before and after a greenway was installed in their neighborhood and found that the greenway improvements made no difference in the amount they walked and did not increase the likelihood that they would take a bike trip. (The authors of the study did question whether it might have been done too soon to capture longer-term behavioral change.)
But that doesn’t mean that residents don’t value greenways. In this survey of people living next to the SE Salmon bike boulevard, one of the city’s original traffic calming projects, 68 percent said they liked living on it “a lot.” More than 18 percent of residents said the bicycle boulevard factored into their decision to move there. Fifty-four percent of residents said living on a bike boulevard didn’t influence whether or not they bike, while 42 percent said it made them more likely to bike. The number one improvement that people wished for (51 percent) was adding signals or signage to help people get across problem intersections.
So even with Portland’s decades of experience in building low-stress, low-traffic streets, it’s still an experiment in progress. We can all look forward to the in-depth results early next year on who uses them and how they’re changing the family-friendly fabric of the city.
Andrew Patrick
Thanks for the great recap.
I’m just curious about the kinds of measures the City or other government bodies have done to discourage auto use and how that might intersect with these efforts to increase greenway traffic etc.
I’m interested in the uncertainty over whether or not greenways actually increase bicycle use. The article details the “carrot” side of things nicely – i.e. expanded bike/ped infrastructure – but less is said about the use of “sticks”- i.e. carbon taxes, gas taxes, levies, or tolls.
I realize taking away lanes or calming traffic can have a discouraging effect on auto use and make bike commuting or walking seem more competitive (travel time comes to mind), but was curious about the scope of policy conversations explored in tandem with these developments that might be more focused on economic instruments, like taxes etc.
Many thanks!
Ruth Darden
I love to bike, but haven’t for years as I consider Seattle too dangerous. I hope very much that Seattle does something like Portland as I want to bike again!!
Kirsten Wert
The number of cyclists was only compared with added infrastructure. Education and encouragement also produces behavior change and more riders. Maybe there was an education push or cycling advocacy and events that corresponded with the growth in cycling when there weren’t more bike lanes added? Education is a much less expensive yet powerful tool in promoting behavior change. Unfortunately it is often dismissed or overshadowed by the big ticket and easily visible infrastructure projects.
Michael Andersen
Yes, Portland’s city-funded Smart Trips program was created in the early 2000s — essentially a sales team for low-car transportation and lifestyles. It’s probably responsible for some of the shift. One thing Smart Trips employees will tell you, however, is that they can’t shift behavior if they have nothing to sell. Smart Trips continues (and does good work that I respect a lot) but mode shift doesn’t.
Michael Andersen
Great piece. Maybe the single best summary I’ve seen of what neighborhood greenways are, why they matter and what the relevant questions about them are.