How Low-Carbon Can You Go: The Green Travel Ranking

How can you reduce your transportation emissions? Sightline does the math on the most climate-friendly way to travel. We chart CO2 emissions by transportation mode, from an SUV to a plane to a bus. Also shows differences based on occupancy (i.e. full bus vs. half-full bus).

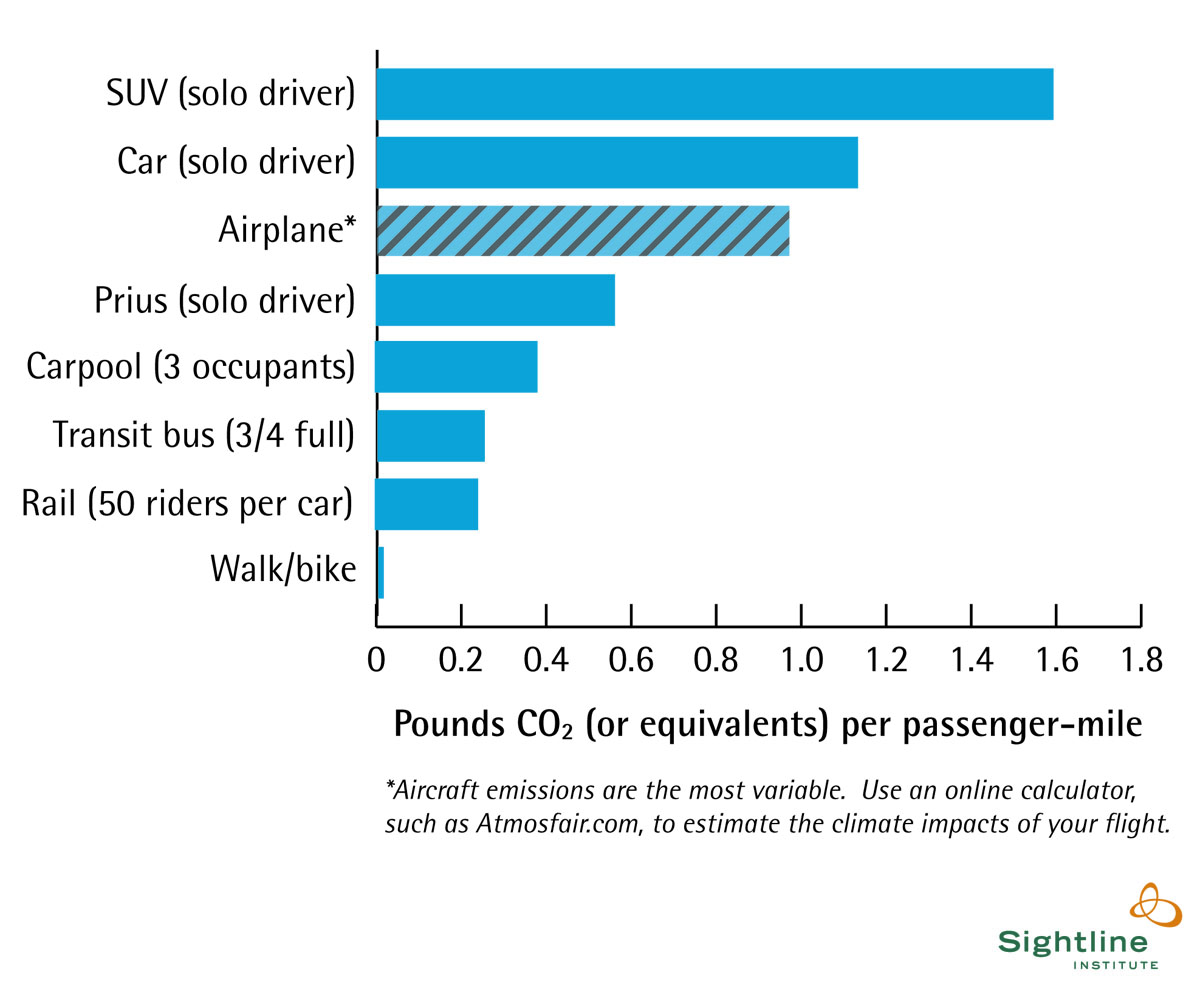
What is the most climate-friendly way to get there from here? Sightline did the math on that question, ranking different transportation options by greenhouse gas emissions (note that rankings vary depending on vehicle type and occupancy, see our sources and citations here). How do your transportation emissions measure up? Turns out that the best strategy for reducing your impact: walk, bike, or fill up a seat that's already going your way!

Transportation Emissions: The short version

Click image to see larger version, or download on the right.

Transportation Emissions by Mode


The long version: additional categories and data.


Click image to see larger version, or download on the right.
co2 emissions chart - expanded


See also:

Chart: CO2 Emissions from Fossil Fuels by Sector

(chart)

Map: United States of Climate Change

(map)

Map: Canada and Climate Change

(map)

Sightline's climate policy project


Date range: 2007

Publication date: 2008 | Topic(s): Energy & Climate Sprawl & Transportation | Graphic type: Chart
Download this graphic
Log in or register for free access to premium content.
Condensed Version-Medium 650x541 px, 72dpi, 44K
Condensed Version - Hi-res 1200x1000 px, 300dpi, 718K
Expanded Version - Medium 650x685 px, 72dpi, 54K
Expanded Version - Hi-res 1200 x 1270 px, 300dpi, 759K
Choosing the right version
Please read our Free Use Policy
Social Bookmarks
FlickrFacebookTwitter
MC Email Signup

Subscribe

Manage Subscriptions