
Sightline has developed a new pair of maps—here and here—that illustrate quite nicely the fairness of tax systems in the 50 states.
In the map below, states are color coded according to the tax burden shouldered by the state’s poorest families. The reason Washington is bright red—the brightest red of any state—is that the poorest 20 percent of Washington’s families pay 17.3 percent of their income in state taxes. It’s by far the highest amount in the nation.
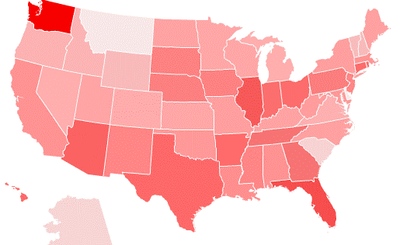

See the animated data-rich version: The Poorest Families: How much do they pay in state taxes?
By contrast, the wealthiest families have a nice little tax haven in Washington compared with other states. In the map below, states are color coded according to the tax burden on the highest-earning 1 percent of families in the state. The reason Washington is so pale is because the wealthy in the Evergreen State pay so little in state taxes—just 2.6 percent, which is less than their peers in all but a handful of states.
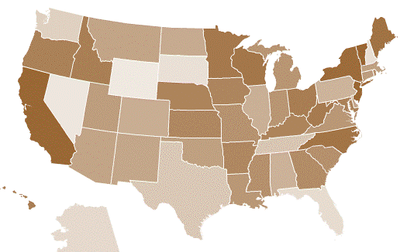

Again, don’t just glance at the map I’ve included here. Go check out the animated version, which comes complete with numbers and everything: The Wealthiest Families: How much do they pay in state taxes?
Thinking about tax fairness is apropos for voters in most every state this year. In Washington, for example, voters will weigh in on a range of ballot measures that affect the structure of state taxes. Chief among these is Initiative 1098, which would levy an income tax on very high income earners, allow modest reductions to taxes on property and small businesses, and provide new revenue for state services like education and health care. The measure will not do much to reduce the tax burden on the poorest families in the state, but it does provide a good opportunity to improve the state’s discussion of tax policy—not to mention basic economic fairness.
Notes: The maps were created by Sightline based on data from the Institute on Taxation and Economic Policy, which produces a detailed distributional analysis for each of the 50 states. ITEP’s calculations factor in sales and excise taxes, property taxes, income taxes, offsets from federal taxes, and other state-specific features.


JJJPL
Looking at the map, it appears that Vermont is the fairest. Here’s what the people who did the analysis (ITEP) had to say about Vermont last year:http://www.denpubs.com/Articles-c-2009-11-23-65391.113116-sub_Vermont_taxes_Fair_or_unfair_burden.htmlSeems like this is the only tune they know how to sing. Why should we care what a DC labor lobbying firm thinks about our state?
Matt the Engineer
I’d like to see a map of what might (or might not?) calm the fears of the anti-taxers: Where do rich people live? I’d bet most of them didn’t flee NY or CA because of the high tax on the rich.
Chris
I was wondering what Canadian numbers were and I stumbled upon this: http://www.policyalternatives.ca/sites/default/files/uploads/publications/National_Office_Pubs/2007/Eroding_Tax_Fairness_web.pdfFor the Bottom 20% the number is around 31%. For the Top 20% it is around 35%.
Eric Paulsen
I am a math teacher with 14 years experience teaching in Washington State. I have done research on the math of U.S. and worlds use of oil supplies, to help support sustainable development. Also I have studied I-1098. I do not oppose I-1098. I support the legislature in Washington State pass a Moderately Progressive Income tax, to completely replace the regressive tax system that it has. I share this research and proposals in a paper, Transition 2010-2030. The rates of the moderately progressive income tax would be set by the legislature, so that the state has enough money to meet its budget needs and have a surplus for emergency needs.Eric Paulsen, math teacher
Andrew
The Canadian numbers Chris posted include federal, provincial, property and corporate taxes.
morgan
Eric – can you take this a step further to deflate trickle-down theory? I’m guessing that you’re assuming that the poor are equally poor in different states. Were it the case that WA’s poorest were wealthier than those elsewhere, this argument would have a big problem. In the end, it’s not only important what we each contribute into the system, but what we get out of the system is equally important.
Jessica
Washington State does not have an income tax…we only pay federal income tax here…
Jessica (no, a different one)
Although we do not currently pay income tax to the state, we do pay sales tax (very regressive), property tax, and B tax. These must be included for a complete picture of the taxes we pay to support the community services we receive (roads, schools, public health and safety, and more).
Luci
I have lived in Western Washington, Northern Minnesota and the Twin Cities, and New York City (Queens). I don’t recall what the sales tax was when I lived in New York, but the sales tax in Minnesota is much lower than in Washington, and in addition to not taxing food, clothing is not taxed in Minnesota, either. Housing costs are comparable in all three places, if you’re renting, but in Minnesota low-income renters are eligible for a property tax rebate from the state. The biggest difference I notice in Washington is that food costs a considerable amount more here in Washington (I live in Olympia), and I pay higher taxes on all my non-food necessities. So, I’m spending more money on the things I need to live, paying a higher tax-rate on the higher prices, and yes, I think my quality of life is much lower here.