
There’s some good news in BP’s most recent Statistical Review of World Energy: in the US, total greenhouse gas emissions from fossil fuels fell 1.8% from 2010 to 2011. And in even better news, total US emissions have fallen by more than 7 percent from their 2005 peak. (Note that Barry Saxifrage recently spotted the same trends in data from the International Energy Agency.)
But there’s also some really, really bad news. In fact, here’s the most frightening chart I’ve seen in weeks, created by Sightline pal Devin Porter, showing total climate-warming emissions from fossil fuels consumed in the US and China:
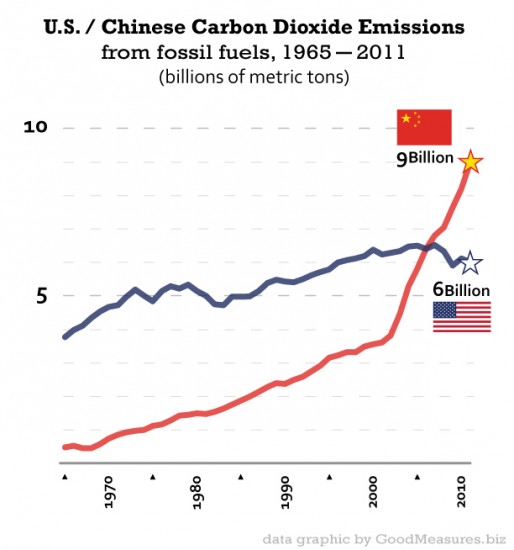
Just as US emissions started to moderate, China’s started to skyrocket. And in both countries, coal has played an outsized role in emissions trends.
In the US, a flattening in demand for electricity, coupled with a shift among electricity generators away from coal and towards natural gas, has been responsible for much of the decline in national CO2 emissions. Today, about 40 percent of the nation’s electricity comes from coal, down from 50 percent just a few years ago. In China, the reverse is true: demand for electricity is skyrocketing, and the vast majority of the nation’s power comes from coal. Even though China has made some impressive investments in renewables, the nation’s coal addiction has simultaneously created a public health crisis and pushed it past the US into the top spot among global climate polluters.
As US demand for coal declines, the coal industry is desperately trying to ship its products to China. But why on earth would we possibly want to make that red line rise any higher—especially when we can take pride in the fact that our own emissions are finally easing?


NJK
Beyond the obvious problems of coal dust and many mega-hauling trains, here’s another reason NOT to export coal – do we really want to contribute more to China’s output?
Wells
Generating electricity for household use should ideally include rooftop photovoltiac solar panel systems matched to (stationary) or portable battery packs onboard Plug-in hybrids. At 1/3 the size of an all-battery EVs like the Nissan Leaf, the battery resource directed to plug-in hybrids reach triple the market, reduces cost of each rooftop photovoltiac array, provides an emergency power supply in grid failure, optimizes grid efficiency by storing grid surplus and supplying additional power during peak demand. As China and India develop their grid and drive more, their opportunity to develop an ideal grid system along these lines will reduce their dependence upon fossil fuels. The plug-in hybrid may only offer a 10-20 mile all-electric driving range, but this too is ideal as it encourages local economy development whereby more routine trips can be taken without having to drive and mass transit systems for longer trips more practical to arrange. Local, regional and state economies must supplant national and global economies for human civilization to survive. Is tis too difficult to understand?
Michael
One key factor, often not appreciated in stats like this, is that manufacturing, and hence energy use, has been moving to China (and increasingly India) in a big way during this time period. Further, it’s not just in the US but in “Western” countries around the globe.
So on a global scale, the combined rates are going up but there is an underlying significant shift to China as other countries outsource their pollution along with their manufacturing.
The fundamental issues remain the same.
Clark Williams-Derry
Yes, very good point, Michael!
Bill Basford
Another related issue: not only have we shifted much manufacturing to India and China, but then we ship the products to NA in huge ships that burn the lowest quality fuel oil.