


In August 2021, the Intergovernmental Panel on Climate Change (IPCC) released its Sixth Assessment on climate change. It is a grim read, but it’s not a surprise. Every new IPCC report has been worse than its antecedent.
The report states the world has already warmed 1.1 degrees.1 Under a high emissions scenario, otherwise known as humanity’s current path, temperatures could rise four degrees by 2100 and sea levels could rise as much as five meters by 2150.
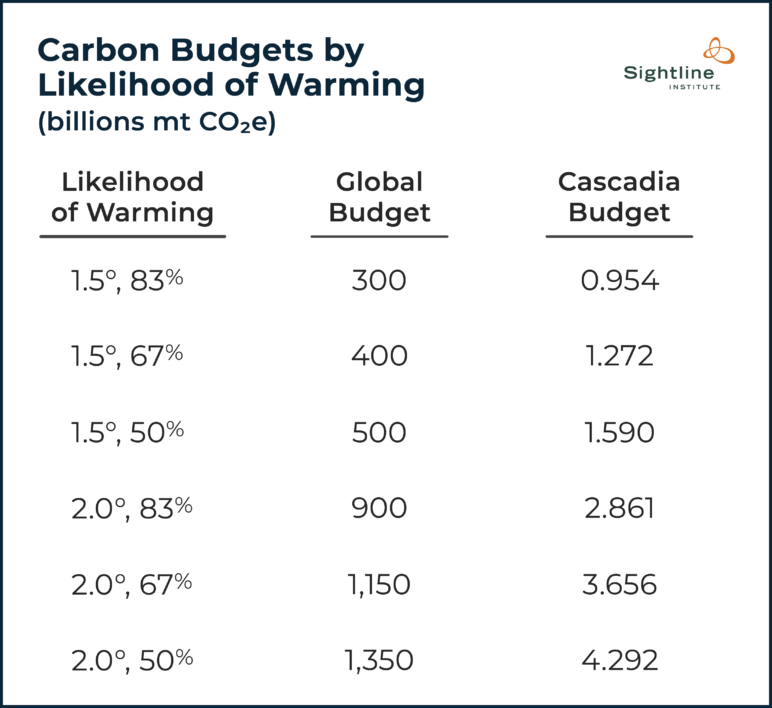
The report also details how much carbon humanity has already emitted and how much more carbon humanity could emit and still limit global warming to between 1.5 and 2.0 degrees above pre-industrial levels.2 Scientists refer to this as humanity’s “carbon budget.”
Humanity has emitted 2,390 billion metric tons of carbon dioxide (mt CO2e) since 1850.3 To have a 67 percent chance of keeping warming to 1.5 degrees, we can only emit an additional 400 billion mt CO2e. At our current global emissions of around 50 billion mt CO2e per year,4 we will exceed the 1.5 degree carbon budget by 2027. For a 67 percent chance of keeping warming to 2.0 degrees, our carbon budget is 1,150 billion mt CO2e. At our current pace, we will exceed that budget by 2042.
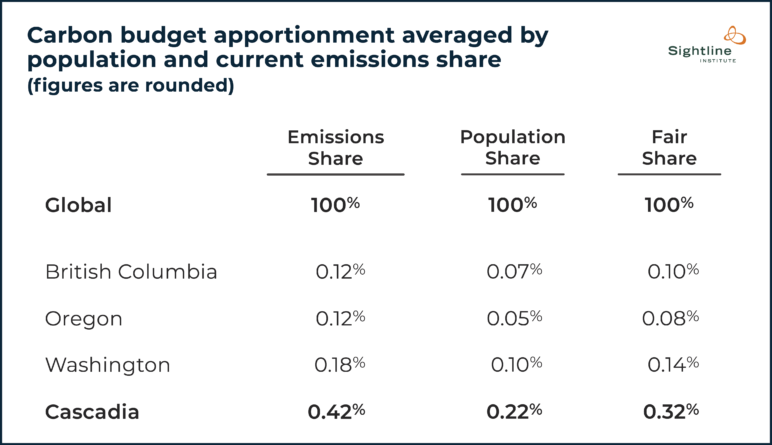
But these are the figures for the global carbon budget. What about a carbon budget for Cascadia?5 How much of the global carbon budget can and should Cascadia claim as its own? Given its population and current emissions, Sightline calculates Cascadia’s share of the global carbon budget to be 0.32 percent of the total budget.6 One third of one percent. Not bad for our relatively unpopulated corner of the globe.
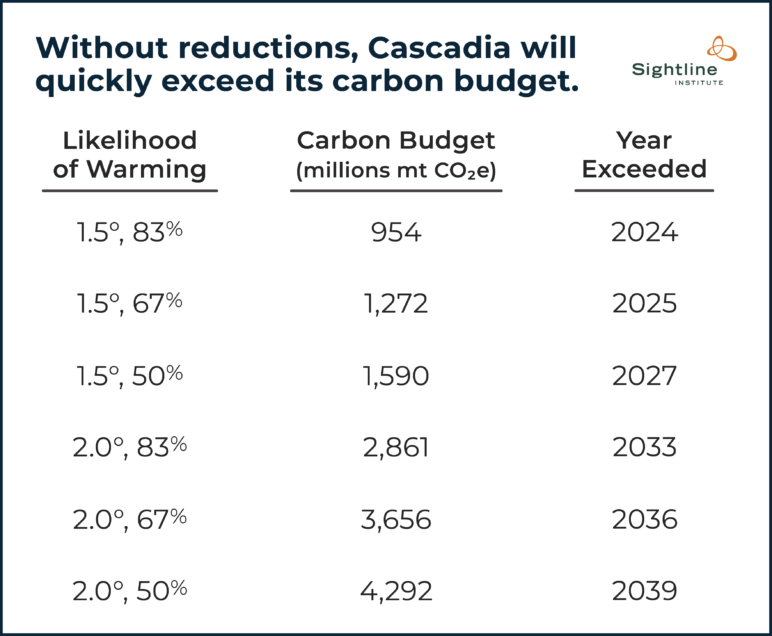
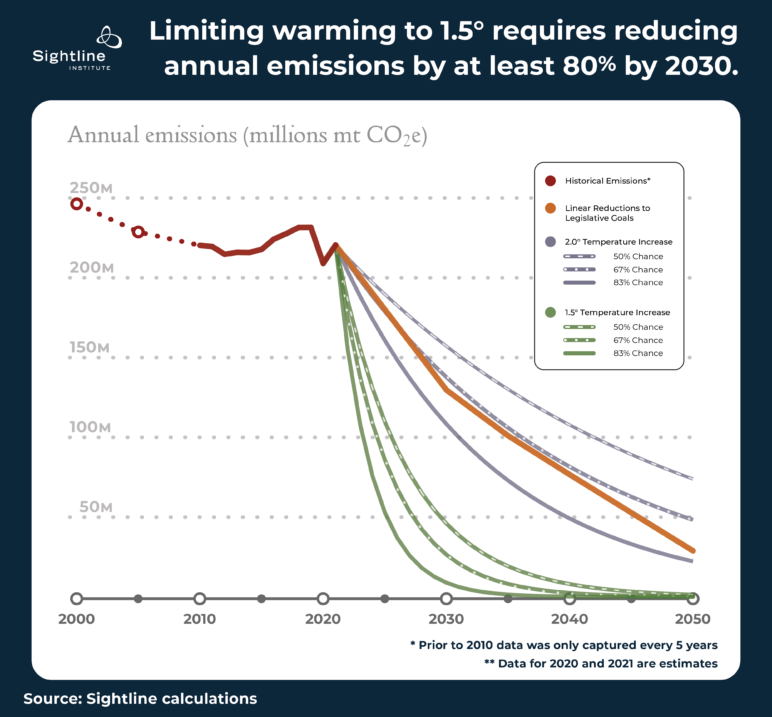
If Cascadia is to keep its emissions under budget, decarbonization must begin immediately. The clock on the carbon budget started in 2020; decarbonization has not begun and 2021 is almost over. In 2020, Cascadia’s emissions declined to 209 million mt CO2e due to the pandemic and economic turmoil. In 2021, Sightline estimates Cascadia will emit about 220.5 mt CO2e.7 Every year of delay makes it more difficult to stay under budget. If Cascadia continues emitting at 2021 levels, it will exceed the budgets for both 1.5 and 2.0 degrees warming within 20 years.
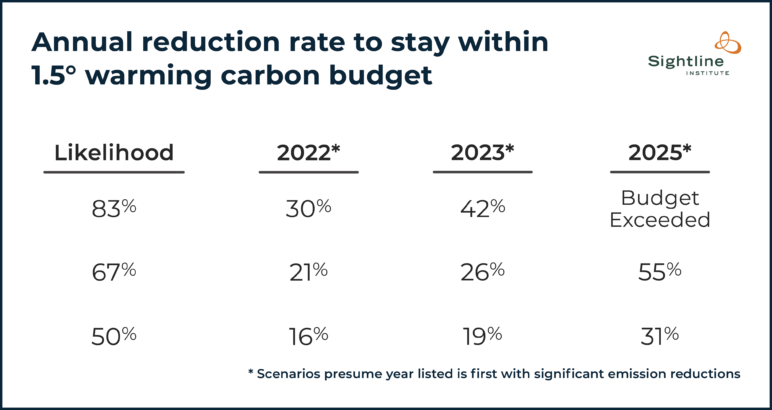
Assuming decarbonization begins in 2022,8 Cascadia would need to reduce emissions by 21 percent annually to stay under the carbon budget for a 67 percent chance of keeping warming to 1.5 degrees.9 For context, emissions dropped by about 10 percent in 2020 owing to the COVID economic contraction and reduced travel. And by December 2020, emissions in the United States had almost fully recovered to pre-pandemic levels. Our societal inability to maintain even a 10 percent reduction for more than one year illustrates the difficulty of sustained decarbonization.
If decarbonization is delayed by one year, meaning reductions begin in 2023 instead of 2022, Cascadia would need to reduce emissions by 26 percent annually to stay under the 67 percent chance of 1.5 degrees warming carbon budget. And if decarbonization does not begin until 2025, reductions would need to be 55 percent annually. If 2021 emissions levels continue, Cascadia will exceed the 83 percent chance of 1.5 degrees warming carbon budget by the end of 2025.
The magnitude of these reductions makes it all but certain that Cascadia will be unable to stay within budget to keep warming to 1.5 degrees.
What about Cascadia’s carbon budget for keeping warming to 2.0 degrees? How steep would annual reductions need to be?
Relative to the reductions necessary to stay under the 1.5 degrees carbon budgets, the reductions to stay under 2.0 degrees are small. But relative to current politics and policies, these reductions would be massive.
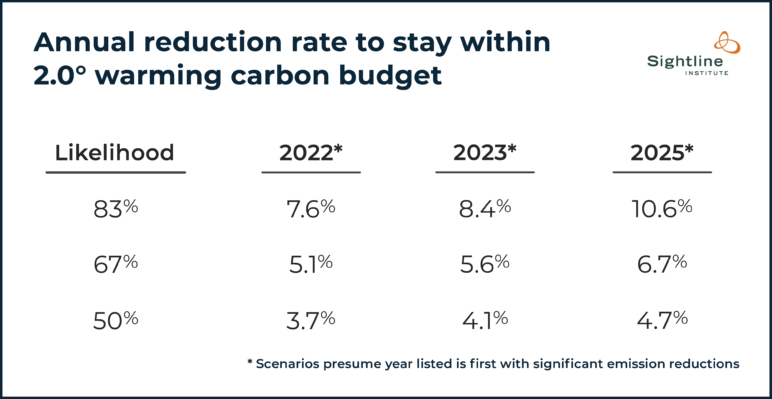
The reductions needed to stay within budget for a 67 percent or 50 percent chance of keeping warming to 2.0 degrees are between 3.7 and 6.7 percent annually, as long as reductions begin by 2025. However, considering the dire consequences of 2.0 degrees warming, a 67 percent chance, let alone a 50 percent chance, of keeping warming to 2.0 degrees is unacceptably low.10
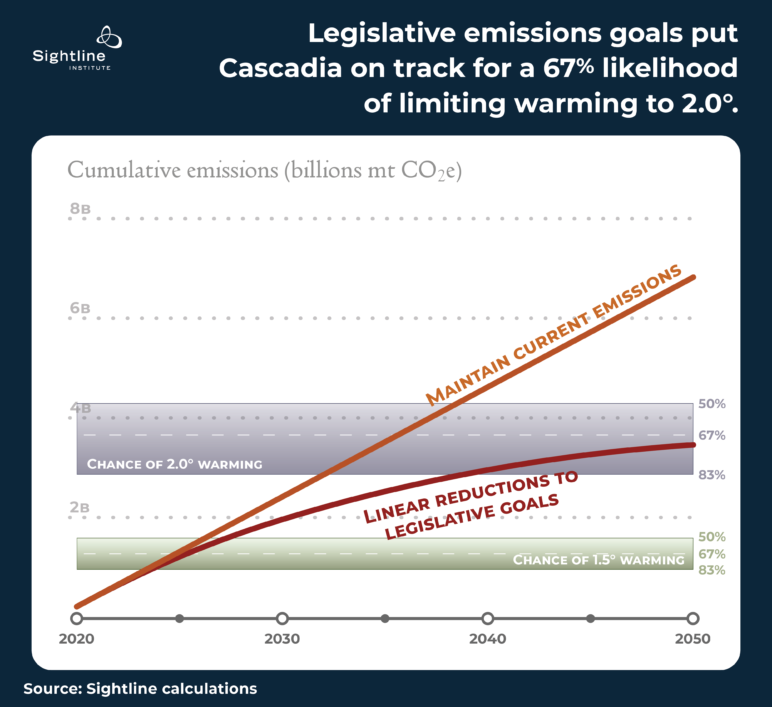
Since the reductions to stay within the 1.5 degrees warming budgets are likely too steep to be realistic, and budgets for 67 percent and 50 percent chance of 2.0 degrees warming leave too great a chance of exceeding 2.0 degrees, the focus should be on the carbon budget for an 83 percent chance of keeping warming to 2.0 degrees.
If decarbonization begins in 2022, Cascadia would need to reduce emissions by 7.6 percent annually for an 83 percent chance of keeping warming to 2.0 degrees. Annual reductions of 7.6 percent would see emissions drop 51 percent by 2030, 78 percent by 2040, and 90 percent by 2050.
Delaying decarbonization until 2025 would necessitate annual emissions reductions of 10.6 percent in order to have an 83 percent chance of keeping warming to 2.0 degrees.
How do regional decarbonization goals compare to emissions reduction rates necessary to stay within budget for an 83 percent chance of limiting warming to 2.0 degrees?
Linear emissions reductions, according to regional 2050 decarbonization goals set by the governments of British Columbia (80 percent reductions from their 2007 emissions), Oregon (80 percent below 1990 levels), and Washington (95 percent below 1990 levels), would exceed the 83 percent chance of 2.0 degrees warming budget by 2039. The linear reductions pathway would see Cascadia emit 3.5 billion mt CO2e by 2050, only barely within the 67 percent chance of 2.0 degrees warming budget.
According to the numbers from the latest IPCC report, Cascadia’s current goals are not good enough.
Decarbonization must begin now. We are out of time.
Methodology: Calculating Cascadia’s Share of the Carbon Budget
The most straightforward way of determining Cascadia’s responsibility for decarbonization—let’s call it Cascadia’s Fair Share for simplicity—is to calculate our share of total world carbon emissions and multiply that percentage by the IPCC’s carbon budget.
First, to estimate global emissions. In 2016, global carbon emissions were 49.4 billion mt CO2e. Emissions continued to trend upward each year until 2020, when the COVID-19 pandemic and economic recession cut energy consumption and emissions. The IEA estimates global emissions dropped 6 percent. Emissions kept rising after 2016 before falling in 2020, so it is reasonable to assume that global emissions in 2020 were around 50 billion mt CO2e.
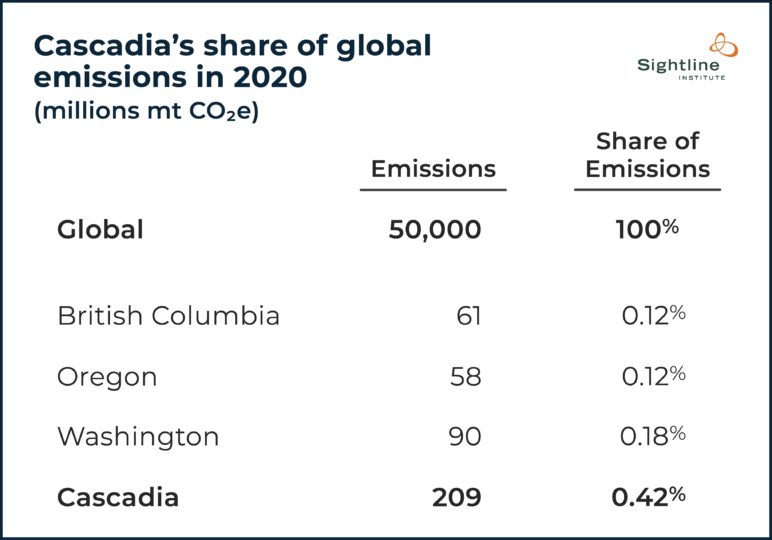
Sightline can estimate emissions in Cascadia using similar logic: British Columbia emitted 68 million mt CO2e in 2018, Oregon emitted 64 million mt CO2e in 2018, and Washington emitted 99.6 million mt CO2e in 2018. Factoring in the 10 percent decline in emissions owing to the COVID economic contraction, Sightline estimates that the emissions of Oregon and Washington in 2020 stood at roughly 58 million and 90 million mt CO2e, respectively. By December 2020, emissions in the United States had almost fully recovered to December 2019 levels, indicating that emissions in 2020 are likely more of a blip than the beginning of a downward trend. Assuming British Columbia’s COVID-induced emissions decline followed the same pattern, Sightline estimates BC emissions amounted to 61 million mt CO2e in 2020. Altogether, Sightline estimates Cascadia emitted 209 million mt CO2e in 2020, or 0.42% of global emissions.
Since Cascadia emits 0.42 percent of global emissions, one method would be to apportion 0.42 percent of the global carbon budget to Cascadia.
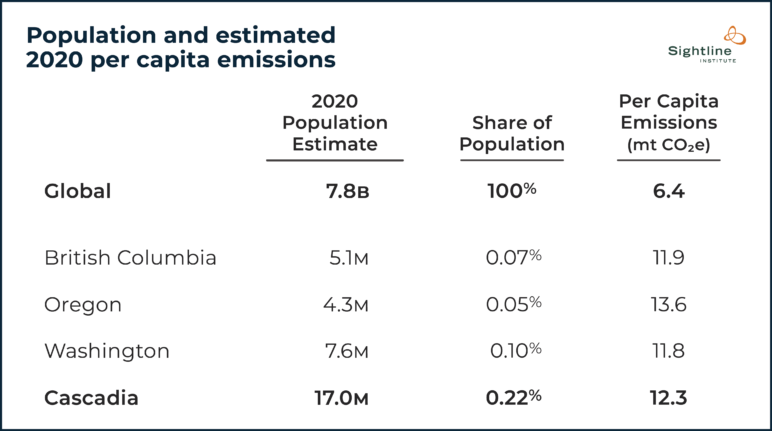
However, this method of apportioning Cascadia’s Fair Share does not account for the fact that Cascadia residents have, to date, emitted far more carbon per capita than most of the rest of the world. An average person living in India who emitted 1.8 mt CO2e in a year would be allocated a fraction of the carbon budget that a person living in Cascadia who emitted 12.3 mt CO2e in a year would be allocated. So maybe apportioning solely by current emissions is not that fair, after all.
Instead of apportioning the global carbon budget by current emissions, it could be apportioned equally by population. Under this method, each person would be allocated the same amount of the global carbon budget, regardless of their current or past emissions. The effect of this is to force high carbon emitters (like Cascadians) to reduce their emissions more quickly than low carbon emitters (like Indians).
Altogether, almost 17 million people called Cascadia home in 2020, about 0.22 percent of the 7.8 billion people alive today. Since Cascadia has a lower share of global population than global carbon emissions, apportioning the carbon budget by population would lower Cascadia’s remaining carbon budget.
There are strong arguments for different methods of apportionment that touch on controversial issues of justice and fairness. For those interested, Sightline recommends a 2011 paper by experts from Brazil, China, India, and South Africa, and a 2015 paper proposing a carbon debt/credit method for carbon budget allocation.
For this analysis, Sightline averages two apportionment methods—current share of global carbon emission and current share of global population—to determine Cascadia’s Fair Share of the world’s carbon budget. There are reasonable objections to our approach, but whatever method is used, the conclusion that the Northwest must rapidly decarbonize remains unchanged.
As a region, Cascadia’s carbon budget accounts for 0.32 percent of the global carbon budget. Nearly half goes to Washington due to its higher population and emissions, with British Columbia and Oregon nearly evenly splitting the remaining budget.
(Note that these emissions refer to carbon released within each jurisdiction, mostly from burning fossil fuels, not from the carbon that is “embedded” in consumer products nor the carbon in fuels that are exported for consumption elsewhere, which would increase BC’s emissions dramatically.)
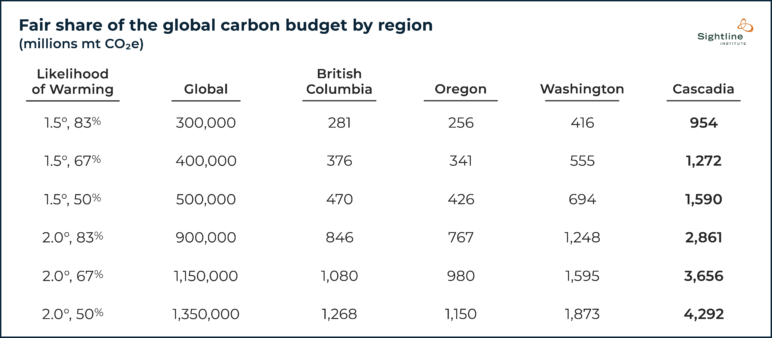
Cascadia’s share of the global carbon budget is about one-third of one percent of the total budget. The 2021 IPCC report calculates the global carbon budget to keep warming to 1.5 to 2 degrees Celsius to be between 300 billion and 1,350 billion mt CO2e. For context, from 1850 – 2019, humanity emitted roughly 2,400 billion mt CO2e.
One-third of one percent of the global budget means Cascadia’s budget is between 954 million mt CO2e for an 83 percent chance of 1.5 degrees warming to 4,292 million mt CO2e for a 50 percent chance of 2.0 degrees warming.


