fbpx

Washingtonians May Get a Democracy Upgrade in 2024

Find audio versions of Sightline articles on any of your favorite podcast platforms, including Spotify, Google, and Apple.

Author’s note: HB 1932 passed out of the House on February 8, 2024, 52-45. HB 2250, the VOICES Act, did not pass out of the House Rules committee before a February 13 deadline.

Washington State leaders are eyeing a suite of democracy and elections upgrades that would help ensure representation of communities, boost voter turnout, streamline administrative procedures, and offer more diverse candidate choices to advance the priorities of everyday Washingtonians.  

The legislature has considered ranked choice voting, moving to even-year elections, and other improvements in the past, gaining familiarity with these reforms although not yet passing them. But interest in and execution of such advances is growing across the US, with jurisdictions from Alaska to Arizona, Cambridge, Massachusetts, to Portland, Oregon, offering examples of their benefits in action. The issues before Washington lawmakers are gaining the momentum they need that may finally usher them across the finish line in 2024.  

Smoothing the path for local governments wanting to adopt ranked choice voting 

Washington legislators face a different opportunity regarding ranked choice voting (RCV) than they did in years past. The question is no longer if Washington will use RCV, but rather how the state will use it. Will it be inconsistent, varying from one county to the next? Or will it follow choreographed steps based on what we’ve learned works well?   

Washington state law prohibits most local jurisdictions—except for charter cities and counties, like Seattle and Clark County—from changing their election code. This restriction means that they have been prevented from using systems like RCV.  

In June 2023, however, the Washington State Supreme Court issued a ruling that specified that ranked choice voting is a remedy for violations of the Washington Voting Rights Act (WVRA). Because changes to local laws under the WVRA are allowed regardless of other state laws, the ruling opened the door for any governing body—from school district to city—to adopt RCV in response to a violation or potential violation of voting rights, as defined by the WVRA. 

This pathway for opting into RCV is an important acknowledgement of the power of the voting method to improve representation of community interests. Yet it could result in a wide variety of implementation procedures and voter education materials across the state, with each county effectively inventing its own wheel of getting RCV up and running for the community.  

Tweet This

HB 2250 (and companion SB 6156), the Washington VOICES (Voting Options, Implementation, Compliance, Education, and Standards) Act, sponsored by Rep. Gregerson, would clarify standards for local governments and convene a workgroup to help the Secretary of State create statewide guidelines for RCV implementation. The legislation would improve efficiency and consistency for local election administrators while ensuring that voters have the tools they need to make their voices heard.

Boosting voter turnout by allowing local elections in high-turnout years  

State law in Washington currently requires cities and towns to hold their regularly scheduled elections for local offices, such as mayor and city council, in odd-numbered years, when voter turnout rarely rises above 40 percent. Turnout in even-numbered years, in contrast, is often double that of odd-numbered years, including for local races. What’s more, national studies have shown that voters tend to be better represented by leaders elected in even years 

Three bills will address this issue this session: SB 5723, sponsored by Sen. Valdez (and companion HB 1882, sponsored by Rep. Farivar), would amend the state’s election code to allow cities and towns to hold elections in even years if they choose. This creates the option for more local governments to follow the example of King County, whose voters approved a switch to even-year elections in November 2022. Voters in the state’s largest county will soon enjoy fewer campaign cycles to track and leaders who have won support from more of their constituents.  

HB 1932, sponsored by Rep. Gregerson, also provides that option but goes marginally further: if a jurisdiction’s turnout dips below 40 percent in four consecutive odd-year general elections (i.e., across eight years), the switch to even-year elections is mandated. Her legislation would also apply to school district and port authority elections, not just cities and towns. [Author’s note, 1/17/24: House Bill 1932 passed out of the House State Government and Tribal Relations Committee on Friday, January 12, with bipartisan support, with amendments that removed the mandate and exempted judges due to a conflict with another state law.]

Either of these bills would go a long way toward ensuring that local electeds have support from more of the local population—that winners share residents’ values and priorities when making decisions that impact everyday life in their town. 

Diluting Big Money’s influence by empowering small donors 

Back in 2015, the city of Seattle adopted democracy vouchers, an innovative tool to lessen the influence of outsized contributors in political campaigns by giving more power to ordinary constituents. For candidates, it established more stringent disclosure rules and other good-governance measures, while also creating pathways for more people to run for office without depending on personal deep pockets or big campaign donors. The program has broadened participation in elections, helping create more diverse candidate and donor pools and increasing opportunities for small donors to engage with candidates and make their priorities known—again, changing who can win office and how aligned they are with the values of much of the public. 

Now, legislators have an opportunity to expand that program across Washington State: HB 1755, sponsored by Rep. Farivar, would create a statewide democracy voucher program for state legislative district races. This means each Washingtonian eligible to make campaign contributions would receive four $25 vouchers to support the candidate(s) of their choice for the state house and senate, increasing their influence against that of special interests and wealthy donors. 

And more: Honoring voting rights for incarcerated Washingtonians and protecting voters’ ballots 

While Sightline hasn’t done in-depth research on these topics, there are two other priorities that our democracy partners are advancing in the 2024 legislative session. First, restoring voting rights for Washingtonians in the carceral system by only revoking them for crimes punishable by death (HB 2030), ensuring that Washington citizens can vote even when incarcerated. Second, ballot signature curing reform, to create a standardized process for election administrators to fix ballot errors (SB 5890), which disproportionally impact people of color and young voters. These measures would help us move towards a democracy that values all people and all votes, regardless of race, age, or income.  

In sum, the governing institutions that shape our everyday lives are made up of people whom voters elect into office. When our elections operate such that they privilege special interests or wealthy donors or extremists, those groups’ priorities skew our institutions to serve them—at the cost of “we the people.”  

But when our elections systems are working well for voters and encouraging participation and accountability, it can help people win office who share the public’s priorities and will work toward relevant solutions, from pollution to healthcare, housing affordability to education to good jobs. State leaders have several opportunities this legislative session to improve our elections—and in turn, to better serve people across the Evergreen State.  

With Ranked Choice Voting Coming to Washington State, It’s Time to Coordinate Rollout

Find audio versions of Sightline articles on any of your favorite podcast platforms, including Spotify, Google, and Apple.

The time has come for the Washington legislature to act on ranked choice voting. 

Washington lawmakers are just making their way back to Olympia for this year’s legislative session. And though they’ve explored ranked choice voting before, they now face a different opportunity than they did in years past. The question is no longer if Washington will use ranked choice voting, but rather how the state will use it. Will it be inconsistent, varying from one county to the next? Or will it follow choreographed steps based on what we’ve learned works well? 

Whether or not the legislature steps in this year, people across the state are pursuing ranked choice voting (RCV) for the many benefits it offers communities. Back in 2020, plaintiffs in Yakima requested that their county implement RCV under the Washington Voting Rights Act (WVRA), and in June 2023 a state Supreme Court case explicitly named RCV as a legal remedy for voting rights violations. Charter counties and charter cities can switch to the voting method anytime they like, and Seattle voters took advantage of the opportunity in a 2022 ballot measure. In addition, the upcoming implementation of RCV in Portland, Oregon, which partners with the same voting equipment vendor as many counties throughout the Pacific Northwest, means that voting equipment across Washington will also soon be capable of tabulating RCV, clearing a major technical hurdle. 

While RCV is clearly on its way, statewide legislation could still help clarify standards for local governments and smooth the path for county auditors and administrators who might have to manage conflicting rules, ballot design, and reporting requirements across cities, ports, and school districts as more and more places look to adopt the electoral method. 

For years, lawmakers have considered a “Local Options Bill,” which would allow all local jurisdictions to choose to use RCV, even without a potential voting rights violation. Last year they also took up the idea of using RCV for presidential primaries. Legislation relating to RCV has not yet made it across the finish line in Olympia, but this year the need for legislative guidance is much more urgent. 

The Washington Voting Rights Act greenlights RCV 

Ranked choice voting, particularly the multi-winner proportional form, has been shown to improve representation of community interests. Acknowledging this benefit, a recent Washington State court case lit the way for any local government to employ RCV in the interest of voting rights. 

Passed in 2018, the Washington Voting Rights Act (WVRA) expands on the protections of the federal Voting Rights Act of 1965, intending to prevent voter exclusion in the face of polarized voting (when voters in a “protected class”—members of a race, color, or language minority group—prefer different candidates or election outcomes than the rest of the electorate). The law empowers a county, city, or special district to change its electoral method to respond to a violation or a potential violation of the law, superseding other state laws that would otherwise prevent that shift. Notably, under the WVRA, jurisdictions don’t need to be sued to implement an electoral change; they are permitted to institute a remedy even for a potential violation, in collaboration with affected community members.1The definition of a potential violation under the law is somewhat ambiguous. A governing body may need to receive notification of intent to file a suit from an affected party, or it may simply need to compile its own evidence.
 

In other words, a town council could proactively change from an at-large, plurality, winner-take-all election to another form of voting without going through an extensive court battle if they found that another method would improve voter representation. 

And RCV is recognized as a method that would achieve that goal. 

In 2020 plaintiffs in Yakima County filed suit under the WVRA and requested that the county switch to RCV to elect members of the Board of Commissioners. While their court case eventually settled with single-member districts, replacing the previous at-large representatives that underrepresented Latino communities, the request shows that advocates have considered RCV a promising option for ensuring fair representation for some time. 

Then in June 2023, the state Supreme Court’s Portugal v. Franklin County decision explicitly stated that RCV (particularly the proportional representation form known as single transferable vote) is a remedy for violations of the WVRA. “Other potential remedies include, but are not necessarily limited to…single transferable or ranked choice voting.”2Other electoral changes are also listed as remedies. Full text on p. 11: “Other potential remedies include, but are not necessarily limited to, limited voting, where a voter receives fewer votes than there are candidates to elect; cumulative voting, where a voter receives as many votes as there are candidates to elect, but may cast multiple votes for a single candidate; and single transferable or ranked choice voting, where a voter ranks candidates in order of preference, and votes are transferred to lower-ranked candidates who are not elected on first-place votes if a majority is not reached.”
While RCV was already implicitly allowed under the WVRA, the recognition in the court ruling illuminates a clear path for any jurisdiction in the state to adopt it. 

Constituents, advocacy groups, and elected officials are increasingly exploring where and how election reforms could improve community representation in local governments. Analysis from the national MGGG Redistricting Lab, which has modeled election methods of select governing bodies across the country, shows that Pierce County and Chelan County are among the Washington jurisdictions where RCV would be a more effective tool to help ensure representation than the current forms of county elections, which can deprive large groups of voters of a real chance to have their voices make an impact. 

With the state Supreme Court’s validation of RCV and recent updates to the WVRA that make it easier for individuals and organizations to bring cases forward, we’ll likely see more and more interest in RCV as a way to improve representation in local governments across the state, particularly since adopting RCV under the WVRA gets around other state laws that prohibit local electoral changes. And as noted above, cities, counties, and other governing bodies can preemptively improve their elections even without a lawsuit. 

It’s only a matter of time before more local governments implement RCV in their elections. Seattle is already doing it—without citing the WVRA. 

Washington cities and counties are moving ahead to improve their elections 

In November 2022 Seattle voters chose to adopt RCV for city primaries, demonstrating their interest in gaining more voice and choice in their elections, with 51 percent in support of changing the voting method and 76 percent in favor of RCV over a proposed alternative, approval voting.3After supporters of approval voting gathered enough signatures to put it on the ballot, the Seattle city council decided to add RCV as an alternative. With the competing ballot measures, Seattle voters were first asked whether or not they wanted a reform, and then, in a second question, which reform they preferred. This two-tier procedure is required for statewide competing ballot measures and has been adopted for local ballot measures as well.
 

Seattle isn’t alone in its support of RCV. Nationwide, 50 jurisdictions in more than 20 states already use it, and the list is growing. Voters in seven jurisdictions across the United States considered RCV on their 2023 ballots and universally affirmed it. Cascadia is demonstrating leadership here, with Alaska as one of two states to employ RCV statewide (Maine is the other) and Oregon voters deciding this November if they want to join that list (beyond the counties and cities in Oregon that already use RCV). 

As more and more jurisdictions throughout Cascadia and the country make the transition to RCV, appreciate the method’s benefits, and learn what works well, they are establishing best practices that Washington, too, can employ. And with the upcoming implementation of RCV in Seattle by 2027, King County Elections (with long-time election administration professional Julie Wise at the helm), which administers Seattle’s elections, will iron out many of the remaining nuances of executing RCV in the state. As Washington’s largest elections administration body, King County Elections will help pave the way for others to follow suit. 

Seattle is one of the few places in Washington with the authority to adopt RCV without citing the WVRA. Under current state law, only charter counties and first class (charter) cities, such as Seattle, have the leeway to change their election laws (for primaries, anyway—they are still required to hold top-two general elections). Other Washington jurisdictions are showing interest in using that agency as well. Clark and San Juan Counties (both nonpartisan charter counties) also voted on RCV in 2022, and although neither approved it (bucking the national trend), it’s clear that many voters and leaders are ready for RCV to take the electoral stage. 

While King County Elections is setting some preliminary tracks for future administrators, state-level guidance can streamline and simplify adoption to ensure that every jurisdiction in the state understands how to take up RCV and benefits from lessons learned across the country. 

Voting equipment will be RCV-ready 

Elections in Washington are administered at the county level. Each of the state’s 39 counties buys voting equipment, educates voters, prints ballots, and more for all elections in all jurisdictions in that county. An initial challenge for a town, school district, or other jurisdiction that wants to implement RCV is that its county’s voting system may not yet be equipped to handle the tabulation of a ranked ballot. But thanks to Multnomah County in Oregon, Washington’s neighbor to the south, that hurdle is about to disappear. 

Twenty-two of Washington’s 39 counties already have voting systems that can conduct a ranked choice election, according to analysis from the Ranked Choice Voting Resource Center. The remaining 17 larger counties, which hold 72 percent of the state’s population, use Clear Ballot equipment, which does not currently have RCV capability. 

However, Clear Ballot will soon be RCV-capable. Multnomah County, which is charged with implementing RCV in Portland by November 2024, uses Clear Ballot’s equipment. At Multnomah County’s request, Clear Ballot revised its system to accommodate RCV and has already submitted the updates for federal certification, which Oregon and Washington both require. Approval is expected in summer 2024, and when it comes through, all counties in Washington will be technically equipped to implement ranked choice elections.4 Washington also requires certification from the secretary of state, but federal certification is typically a longer process.
 

Then, not only will local governments in Washington be allowed to use RCV, but they will also be able to do so with the voting equipment they already have. 

Two possible paths forward 

If RCV is coming anyway, do Washington lawmakers need to act? 

Well…yes. As RCV continues to gain popularity, we’ll likely see local governments across the state start to adopt it through a few different avenues. More pre-authorized jurisdictions will change their elections, as Seattle has. Other places, from school districts to city councils on up, will look to RCV as a remedy to potential violations of the WVRA as they aim to make their boards and commissions more representative of their communities. 

If state legislators do nothing, we’ll start to see a patchwork of RCV adoption across the state. Some counties may follow whatever procedures King County develops, but others may try something new and create different forms of ballots and voter education across jurisdictions, multiple administrative processes, and a general headache for voters and the secretary of state. 

Or, Washington lawmakers could pass legislation that would sidestep that potential chaos by laying out a straightforward path for implementation. Local governments would then avoid the challenges Pierce County experienced in 2008, when the county wrote new rules, bought equipment, and had a costly and confusing rollout. All that can be easily bypassed by drawing on the wealth of knowledge and examples now available. 

Advocates and supportive lawmakers are currently working on a revised bill—the Washington VOICES (Voting Options, Implementation, Compliance, Education, and Standards) Act, similar to the Local Options Bill of years past—to address RCV in this session. If it becomes law, only one action would happen immediately: the secretary of state would be required to convene a work group of specific stakeholders to advise and aid the secretary in drafting rules to implement RCV and provide for voter education. While Secretary of State Steve Hobbs has expressed some skepticism about electoral reform, a dedicated work group with a variety of stakeholders would ensure that the rules align with national best practices and local context. These rules would help jurisdictions across the state coordinate ideas, formats, and procedures, smoothing implementation and creating clear guideposts to follow. 

RCV does not need to be adopted in desperation, in reaction to a potential WVRA lawsuit, or with governing bodies striking out on their own. Instead, it can be thought through and planned carefully. 

State legislators, it’s up to you: Disorder? Or coordination?

Washington Bill Would Legalize Low-cost “Co-living” Homes

Find audio versions of Sightline articles on any of your favorite podcast platforms, including Spotify, Google, and Apple.

UPDATES
March 19:
Governor Inslee signed HB 1998.
Feb. 22:
 HB 1998 passed the Senate 44 – 4.
Feb. 7: HB 1998 passed the House 96 – 0.

The remedy for Washington’s dire housing shortage is more homes of all shapes and sizes. Co-living homes—small apartments with shared kitchens—are a low-cost housing option that most communities lack because local zoning laws make them illegal or otherwise impractical to build. A new Washington bill, HB 1998, aims to fix that by setting standards to legalize co-living homes statewide.  

The potential affordability payoff is big. Rents in newly constructed, market-rate co-living homes in the Puget Sound region can be affordable to people earning as low as 50 percent of area median income, without any public subsidy. From 2014 to 2016 in Seattle, co-living accounted for fully 1 in 11 of total new homes built, before the city’s ill-advised raft of new restrictions all but killed off co-living construction. We can learn a lot from that instance—and apply the lessons statewide in a way that’s right for the variety of Washington communities. 

In this article, Sightline lays out:

What are co-living homes? 

Co-living homes are a low-cost, multifamily housing option in which each resident has a small, private living and sleeping room and shares with other building residents a common kitchen and other spaces. The housing type is also known as single-room occupancy (SRO), congregate housing, rooming houses, micro-housing, or residential suites.  

Technically, the defining feature of co-living homes is that individual rooms—“sleeping units,” in building code-speak—do not have full kitchens (but often have their own “kitchenette,” with a mini-fridge, double burner, and/or microwave). In co-living homes built within the past couple decades, the sleeping units almost always include their own full bathroom, though historically, shared bathrooms were not uncommon. Modern buildings often also have shared recreational spaces. The private sleeping rooms are typically 150 to 230 square feet. 

Over recent years in Washington, what little new construction of co-living homes that has occurred has been in Seattle, along with a sprinkling in a few nearby cities. The buildings can be large, with up to a few hundred sleeping units, but more commonly fall in the range of 20 to 40, built on small infill lots. Occupancy rates tend to be similar to standard apartments. See examples in Seattle (here and here), Kirkland, Redmond, and Shoreline.  

Co-living homes: Good for people, pocketbooks, and the planet 

Co-living homes are a housing choice that’s desirable for people in a variety of stages of work and life, like:  

  • Renters who want a small, low-cost rental, possibly while saving to purchase a home; 
  • Residents who wish to trade off square footage for location in a neighborhood they couldn’t otherwise afford; 
  • People who like shared community spaces, like courtyards, kitchens, and lounges, that facilitate social connections; 
  • Single seniors who want to downsize and appreciate the alternative mobility options often available near co-living homes (AARP, for one, also supports Washington’s co-living bill); and 
  • Individuals who want a more private alternative to living with roommates in a traditional rental, which frees up larger rentals for families with children. 

Critically, co-living homes provide unsubsidized workforce housing near jobs to meet the huge deficit most communities face—without the need for publicly funded subsidy. That directly benefits both employees and employers, to say nothing of taxpayers and anyone trying to balance the state’s budget.  

A 2023 real estate survey found that co-living homes in Seattle rent for an average of $1,027 per month. According to HUD’s standards, a single person earning 50 percent of the area median income (AMI) can afford $1,198 per month for rent and utilities. Assuming $150 for utilities, that leaves $1050 for rent, about the same as the average co-living rent in Seattle—and average means some co-living rents are even lower. 

Legalizing co-living homes supports the state’s environmental goals. Allowing more co-living homes will help the state reduce sprawl, improve energy efficiency, and lessen car traffic and pollution. This occurs when we create housing options for people who want to live conveniently and within walking (and rolling) distance to bustling community hubs, with plentiful transit, job opportunities, shops, and schools, rather than in car-dependent areas on the urban fringe. 

Co-living homes: Another casualty of exclusionary zoning  

Co-living homes were once far more common in Washington neighborhoods (and nationally). They provided a healthy inventory of rental homes on the most affordable end of the private housing market. By the 1950s, co-living comprised up to 10 percent of the rental stock in some US cities. Soon after that, however, local governments began adopting restrictive zoning and other exclusionary rules that increasingly banned co-living or made it impractical to build or operate. Its numbers plummeted. 

Modern co-living buildings are not your great-grandfather’s rooming house. Today’s strict building and fire codes ensure that co-living housing meets all the same health and safety measures that apply to any multifamily housing.  

Co-living regulations on the books today are overly restrictive and wildly inconsistent  

Most Washington jurisdictions enforce rules that tightly restrict the construction of co-living homes, but there is extreme variation in how they regulate it. This inconsistency is in itself a strong justification for a bill that establishes statewide standards. The variation between localities makes the statewide context difficult to distill and best illustrated with actual examples of city codes.  

Terminology: “Dwelling unit” vs. “sleeping units” 

Before getting to examples, though, it’s helpful to understand a key concept for the regulation of co-living housing: the distinction between dwelling units and sleeping units. The equivalent of a dwelling unit in co-living buildings is the combination of several sleeping units and their common kitchen. It’s analogous to how a house with multiple bedrooms is a single dwelling unit. A co-living building might include a handful of dwelling units each comprised of a group of sleeping units and their common kitchen. 

For some regulations that apply to co-living homes—off-street parking mandates and density caps in particular—it makes a big difference whether they are based on the number of dwelling units or on the number of sleeping units.  

Parking mandates stymie co-living options 

For typical parking requirements, a single-detached house with four bedrooms counts as one dwelling unit. So a mandate of 2 spaces per dwelling unit means the house needs 2 parking spaces. 

Many local government codes, however, treat each co-living sleeping unit as if it were an entire dwelling unit. So in a building of co-living homes, four sleeping units along with their common kitchen would be required to have a whopping eight parking spaces. More consistent, not to mention fair, would be to hold co-living homes to standards that reflect their unique configuration, where a sleeping unit is only a partial dwelling unit. 

But worse, that amount of parking isn’t just excessive for co-living residents’ needs; it’s also incompatible with typical co-living building designs, most likely rendering construction impossible. And even if all that parking could somehow be designed in, it would make the co-living homes much more expensive—adding costs for builders and for renters. 

Density restrictions also block co-living homes 

A similar line of argument applies to density caps, which can be a severe barrier to co-living homes. Co-living sleeping units are small, and that’s the main reason they can provide relatively inexpensive housing. But that smallness only translates to lower cost if you can put more co-living homes on a site than you can put standard apartments.  

For example, on a 10,000-square-foot lot, a density cap of 40 dwelling units per acre allows for 9 apartments, regardless of their size or number of bedrooms. If that same cap applies to co-living homes, it limits a co-living building to that same 9 units, even though they might be only one-fourth the size of a standard apartment. The project no longer pencils, not to mention that a community forfeits a slew of much-needed homes. 

Solving the dwelling-vs.-sleeping-unit dilemma 

The solution is to treat each sleeping unit as a fraction of a dwelling unit for the purposes of calculating requirements, whether that’s parking spaces, density caps, or other regulations that could create barriers.  

Below are summaries of co-living regulations in 11 of Washington’s larger cities, illustrating the tight restrictions in general, as well as the inconsistency among cities. Critically, most cities treat sleeping units the same as dwelling units in their parking and density rules. 

  • Bellevue permits “rooming houses” but only on a strictly limited scale—a maximum of 4 sleeping units per lot—and only on a small fraction of its residential land, and it requires 1 parking space per sleeping unit. 
  • Everett permits “micro-housing,” which by its definition is not the same thing as co-living housing, because each unit is independent with its own kitchen. We could find no reference to true co-living in Everett’s code.  
  • Federal Way’s municipal code does not include any definitions of co-living housing that we could find. The closest it comes is “group homes” but limits them to buildings with residents under the jurisdiction of the criminal justice system. 
  • Kent requires 1 parking space per sleeping unit for “boarding houses” but does not refer to boarding houses anywhere else in its municipal code that we could find. It allows “communal residences” but only up to 3 sleeping units per site.  
  • Renton permits “congregate residences” as a conditional use in just one of its multifamily zones, and mandates 1 parking space per sleeping unit. It also conditionally permits forms of group housing limited to supportive and assisted living.  
  • Seattle prohibits “congregate residences” in its neighborhood residential, residential small lot, and lowrise multifamily zones, plus in its two lowest-scale mixed-use zones. It permits them in midrise, highrise, higher-scale mixed-use, and commercial zones, but only within designated urban villages and centers. In areas where parking mandates apply, Seattle requires 1 parking space per 4 sleeping units.  
  • Shoreline permits “boarding houses” in its residential zones but caps the number of rented rooms at 2 in lower-density areas. It mandates one parking space per rented sleeping unit and requires an extra permit.  
  • Spokane permits “single-room occupancy housing” in all of its multifamily zones and does not require any parking. But for its density limits, it treats a sleeping unit as equivalent to 1 dwelling unit.  
  • Spokane Valley permits “congregate dwellings” in its multifamily zones. It requires 1 parking space per sleeping unit, and for density limits in multifamily zones, it treats a sleeping unit as equivalent to 1 dwelling unit.   
  • Tacoma permits “group housing” in its residential zones but limits the number of unrelated occupants to as low as 6 in lower-density areas, and typically requires at least 1 parking space per sleeping unit. 
  • Vancouver permits “micro-housing units” in all but its lowest-density residential zones and requires 1 parking space per 2 sleeping units. For its density limits, it treats a sleeping unit as equivalent to one dwelling unit. 

Washington’s HB 1998 would create statewide standards for co-living homes 

Zoning: Treating co-living homes like any other multifamily homes 

First of all, HB 1998 would require cities and counties to allow co-living homes everywhere within urban growth areas that they allow multifamily housing. In terms of the need for land use regulation, there’s no difference between, say, three people sharing one standard apartment unit and three people residing in separate co-living sleeping units. In other words, there is no legitimate justification for targeted bans on the co-living housing type. 

Parking: Right-sizing requirements to co-living designs 

Other than outright zoning bans, the next biggest barrier to co-living is excessive local mandates for parking. Requiring excessive parking not only makes co-living homes more costly but also can render it impossible to build due to space constraints, especially on smaller lots.  

HB 1998 would prohibit parking mandates for sites within a half-mile of a major transit stop, which includes bus stops with 15-minute service. Otherwise, it would cap parking mandates at 1 space per 4 sleeping units. Another way of saying that: for the purposes of calculating required parking based on the number dwelling units, 4 sleeping units would count as 1 dwelling unit. 

A 2014 survey of parking use in two co-living buildings in Redmond found that residents used the on-site parking at an average rate of 0.3 spaces per sleeping unit. The bill’s proposed cap of 0.25 spaces per sleeping unit ensures that local rules don’t force overbuilding of parking, while still giving builders flexibility to include more parking if they want to. 

Density caps: Counting homes to match the co-living form 

As with parking, treating sleeping units the same as dwelling units to set density limits penalizes co-living housing. To ensure density allowances sufficient to support typical co-living buildings, the bill requires cities to count a sleeping unit in co-living housing as no more than one-quarter of a dwelling unit when applying density limits. 

Habitable space minimums: Health and safety over arbitrary mandates 

A less common but nonetheless serious barrier to co-living is requiring an excessive minimum sleeping unit size. Most cities adopt the state building code, which sets a minimum habitable space” of 70 square feet for co-living sleeping units. (And this number excludes parts of the unit like bathrooms and closets, so it’s a smaller number than the total square footage that would be used to advertise the unit.) To preclude this barrier, the bill prohibits local governments from requiring more habitable space than the current state standard.  

Other safeguards to open up more co-living homes 

To prevent other potential barriers, the bill also prohibits local governments from: 

  • Requiring inclusion of standard apartments or commercial spaces in co-living buildings, 
  • Requiring design standards or review processes more stringent than those that apply to other housing types allowed in the same zone, or 
  • Counting a sleeping unit as more than one-fourth of a dwelling unit for calculating permitting and utility connection fees. 

Oregon passed a co-living bill in 2023 

To the best of our knowledge, Oregon is the only US state that has passed, or even attempted to pass, co-living housing legislation. The 2023 bill, HB 3395, included a provision legalizing co-living homes on all residential lots in urban areas throughout the state (it uses the term “single room occupancy,” or SRO)

A weakness in Oregon’s bill is that it doesn’t grant an extra density allowance based on sleeping units. But the bill didn’t have to address parking at all because the state already prohibits parking mandates for homes 750 square feet or smaller. 

It’s too early to say how Oregon’s policy will play out, but we look forward to tracking the co-living housing that crops up in cities around that state, and how co-living homes fill a niche for close-in, convenient, economical, community-oriented living. 

How many new homes could co-living provide? 

The lack of precedent and the inconsistency of current co-living regulations makes it difficult to assess the potential amount of new housing statewide that could result from passing HB 1998.  

The best available data are the co-living production numbers from Seattle before the city clamped down starting in 2014 and quashed their construction. In the peak co-living home construction years of 2014, 2015, and 2016, the city had an average of 609 co-living homes become available per year. That’s about 9 percent of the total housing units built on average those years. 

Extrapolating from that experience, plus the figures in HB 1998, here’s a back-of-the-envelope estimate of how many co-living homes this legislation could unlock for Washingtonians:  

  • About 6.2 million people (78 percent) live inside Washington state’s urban growth boundaries. 
  • Seattle’s population is 13 percent of that total. 
  • Scaling up Seattle’s 2014–2016 co-living home production by its share of the population yields 4,800 co-living homes per year statewide.  
  • To account for lower demand in places outside Seattle, assume the statewide co-living home construction rate would be half of Seattle’s. That yields 2,400 new co-living homes per year statewide. 

Now let’s put that estimate in perspective: 

  • Washington’s Department of Commerce projected the state will need 55,000 new homes per year over the next 20 years. 
  • Over recent years the state has been adding about 40,000 homes per year, leaving 15,000 more to meet the state’s need. 
  • 2,400 co-living homes per year would cover 16 percent of state’s production gap. 
  • And it would provide those homes in the range of affordability to 50 percent AMI, which, for other housing types, almost always requires government subsidy. 

There are big error bars on this estimate, but it’s safe to conclude that legalizing co-living could have a sizable impact on reducing the state’s housing shortage. It would help draw down prices and rents overall and, especially, make homes available near jobs and transit that are on the most affordable end of the spectrum.  

The road to passing the co-living homes bill 

The co-living housing bill—HB 1998 and its identical Senate companion, SB 5901—is off to a good start with bipartisan support, which is a key ingredient for passing zoning reform bills. Its prime sponsors, Representative Mia Gregerson and Senator Jesse Salomon, were each joined by Republican co-sponsors, Representative Andrew Barkis and Senator Chris Gildon. 

It also has a strong list of supporting organizations across the state, representing a healthy variety of constituent groups. So far, the following groups have declared their support for the bill, with more expected: 

  • AARP 
  • AIA Washington Council
  • Association of Washington Business
  • American Farmland Trust 
  • Build Back Black Alliance of Washington
  • Building Industry Association of Washington 
  • Coalition for an Accessible and Resilent Edmonds
  • Empire Health Foundation
  • Futurewise 
  • Habitat for Humanity King/Kittitas Counties 
  • Homes and Hope Community Land Trust
  • Housing Development Consortium 
  • Housing Solutions Network
  • Indivisible Skagit
  • Indivisible Whidbey
  • League of Women Voters 
  • Master Builders of King and Snohomish Counties 
  • Northwest Intentional Communities Association
  • Seattle Metropolitan Chamber of Commerce
  • Sightline Institute 
  • Spokane Low-Income Housing Consortium
  • Sustainable Connections 
  • Washington Multifamily Housing Association
  • Washington Realtors
  • Washington Community Action Partnership

For a shorter, shareable breakdown of co-living homes, see Sightline Institute’s FAQ on the issue. 

180 Sites Account for a Quarter of Cascadia’s Carbon Pollution

Find audio versions of Sightline articles on any of your favorite podcast platforms, including Spotify, Google, and Apple.

Cascadia chalked up major climate wins in 2023, from Washington’s renewed commitment to eliminating gas appliances in new buildings to Montana youth’s historic court win for a clean and healthy climate. At the same time, many Northwest climate hawks are gearing up for new challenges in 2024, including a likely bitter fight to defend Washington’s landmark climate law, the Climate Commitment Act, from a rightwing repeal effort.

Still, as policy debates rage, it can be easy to forget that every day, scores of huge polluters continue to dirty Cascadia’s air, making the worst effects of climate change ever more difficult to stave off.

Cascadia counts 180 stationary facilities that each spew more than 100,000 metric tons of carbon dioxide equivalent (CO2e) into the atmosphere every year.1See appendix for data sources and methodology. Carbon dioxide equivalent means “the number of metric tons of CO2 emissions with the same global warming potential as one metric ton of another greenhouse gas.”
(For the purposes of this article, Cascadia refers to Alaska, British Columbia, Idaho, Montana, Oregon, and Washington. The analysis covers the entirety of the states and province for data simplicity, not only the Cascadian bioregion.)

The biggest emitters range from coal-fired power plants to sugar processing plants, from electronics manufacturers to pulp and paper mills, from landfills to oil refineries to zinc mines. Across the region, power plants, oil and gas facilities, and the forest products industry top the list of biggest stationary polluters, as shown by the charts below, the first broken by down state and industry, the second simply by industry, and the following broken out for each state or province.

Collectively, these establishments emit roughly 80 million metric tons of carbon pollution annually from fossil fuels, about a quarter of Cascadia’s total greenhouse gas emissions.2Total greenhouse gas emissions data comes from US EPA’s 2021 state-level inventory and British Columbia’s 2021 provincial inventory. These state- and province-wide inventories only report emissions from burning fossil fuels, not biogenic emissions, which result from the combustion or decomposition of organic material, like wood.

These facilities’ emissions rise to more than 103 million metric tons of carbon pollution annually—more than comes from driving 23 million gasoline-powered cars in a year—when biogenic emissions are included.3Biogenic emissions result from the combustion or decomposition of organic material as opposed to from burning fossil fuels. Biogenic emissions data is only available at the facility level, not in state- or province-wide inventories. Sightline has included biogenic emissions in all analysis and charts, as indicated. Further discussion of biogenic emissions is in section 4 below and in the data and methodology appendix.
(For context, the United States counts 278 million registered vehicles.) Nearly half that carbon comes from just 20 facilities in Cascadia, indicated by the boxes at right in the chart below.

Cleaning up these institutions is no simple task. Few can easily decarbonize with current technology. Some employ hundreds or even thousands of people.

Still, policymakers can’t afford to ignore them in their efforts to address climate change and improve air quality. That’s especially important in British Columbia, Oregon, and Washington, which many consider to be the greenest jurisdictions in Cascadia yet are home to 120 of the region’s 180 top polluters. While all three state or provincial governments have passed policies to reduce emissions from big stationary sources, notable loopholes remain.

The first step, though, is understanding who the top polluters are and what exceptions to climate laws they enjoy today. With that in mind, Sightline offers four takeaways for Cascadian policymakers.

1. Coal may not power Oregon or Washington for long, but it could dirty Cascadia for decades  

Far and away Cascadia’s biggest polluter is the gargantuan coal-fired power plant in Colstrip, Montana. Emitting more than 10 million metric tons of carbon annually, it spews nearly three times as much CO2e as the next biggest polluter on the list. In fact, it releases so much carbon from burning coal to make electricity that it carries the dubious distinction of being one of the top emitters in the entire United States.  

Map: Cascadia’s Top Carbon Polluters


Source: Map by Sightline Institute. View a full, interactive version of map.

Today, six utilities across the Northwest—Avista, NorthWestern Energy, PacifiCorp, Portland General Electric (PGE), Puget Sound Energy (PSE), and Talen Energy—co-own the plant. But Washington and Oregon passed laws requiring utilities in these states to remove coal from their portfolios by 2025 and 2030, respectively. PGE demolished Oregon’s last coal-fired plant near Boardman in 2022, and TransAlta will shutter Washington’s last coal-fired plant by 2025. As such, residents in western Cascadia could be forgiven for assuming that they no longer need to worry about coal-powered electricity or Colstrip.  

TransAlta coal-fired power plant in Centralia, Washington. Source: Emily Moore

Unfortunately, though, Colstrip looks like it will be fouling Cascadia for the foreseeable future, even after Oregon and Washington utilities pull out. Avista and PSE, the Washington utilities that own a portion of the plant, announced in March 2023 that they will transfer their ownership stakes to the Montana-based companies in 2025, rather than push for the facility’s retirement. A similar proposal in 2020 elicited concern from Washington legislators that it undermined the intent of the state’s clean electricity law. But Washington policymakers’ response to this latest plan has been muted. Meanwhile, Oregon utilities PGE and PacifiCorp announced earlier in 2023 that they will delay their exit from the plant by five years, from 2025 to 2030—the latest possible exit date that Oregon law allows.

Perhaps alarm that Colstrip will keep belching pollution for decades after Oregon and Washington utilities have stopped relying on it is unfounded. The economics of coal plants look increasingly shaky. In fact, two of Colstrip’s four units closed in 2019 because of economic unviability. And in May 2023, the US Environmental Protection Agency (EPA) proposed a new rule to reduce carbon pollution from coal plants by 90 percent by 2030. In practice, the cost of the technology to comply with this rule would likely lead many coal plants, including perhaps Colstrip, to shutter.

Still, EPA has not yet finalized that rule, and it is likely to face legal challenges. Montana’s leadership, meanwhile, has shown it isn’t giving up on coal without a fight.

Oregon and Washington lawmakers committed to phasing out coal in the region would be smart to renew pressure to close Colstrip, rather than simply wash their two states’ hands of it.

2. Even without coal, generating electricity is a dirty business in Oregon and Washington

Unlike most other US states, both Oregon and Washington rely primarily on electricity generated without burning fossil fuels, due largely to the abundance of hydroelectric dams in the Northwest.

Even so, fossil-fuel-fired power plants top the list of big stationary polluters in both states. The vast majority of these are powered by burning fracked gas; the notable exception is TransAlta’s coal-fired power plant in Centralia, Washington, which the company will shut down by 2025.4 TransAlta shut down the first of its two units at the coal plant in 2020.

Thankfully, Oregon and Washington recently passed clean electricity laws that should phase out fossil-fuel-fired power plants over the next 20 years, if not sooner. Washington’s 2019 Clean Energy Transformation Act (CETA) mandates that the state’s electricity supply be greenhouse-gas-neutral by 2030 and powered 100 percent by renewable energy by 2045. Oregon’s 2021 Clean Energy Targets law, better known as HB 2021, requires electric utilities to zero out emissions by 2040, with interim targets between now and then.

Still, exceptions baked into both states’ laws could prolong these polluters’ lifespans beyond what lawmakers intended. Washington’s CETA considers utilities compliant with the law if their efforts to meet emissions reductions targets exceed a two percent annual average increase in costs to utility customers.5See section 3(a) and 4(a) in the law.
In other words, if it’s too expensive to leverage the wind and sun for power, Washington utilities can keep burning gas. Likewise, Oregon’s HB 2021 lets utilities miss emissions targets if generation from renewables is lower than expected or electricity demand is higher than anticipated.6See section 8 in the law.

One factor that could lead utilities to rely on these exceptions and keep gas-fired power plants spewing far longer than the region can afford? Not enough electric transmission capacity in the Northwest to be able to tap cheap and abundant renewable power. That’s in large part because most of the gas-fired power plants in both states—11 out of 17—are located west of the Cascade mountain range. By contrast, most of the best renewable sources are much farther away, whether wind in Montana and Wyoming or sun in eastern Oregon and Arizona. Utilities need big power lines to transport this energy to western Oregon and Washington, as Sightline has written.

Policymakers in the Evergreen and Beaver states have several tools at their disposal to increase the region’s electric transmission capacity and can at the same time remain vigilant in making sure utilities don’t abuse clean electricity law exemptions.

3. Oil and gas facilities dominate the list, even in Cascadia’s greenest places

As one of the United States’ top five oil-extracting states and the state with the fourth-largest gas withdrawals, Alaska unsurprisingly counts mostly oil and gas facilities in its list of big polluters. The majority are located in the Prudhoe Bay region on the North Slope, an area that contains six of the largest oil fields in the United States and one of country’s the largest gas fields. ConocoPhillips’ giant new oil drilling project, the Willow Project, will add another enormous fossil fuel polluter to Alaska’s North Slope. President Biden approved the project in March 2023, to the dismay of many of his supporters.

But the story of oil and gas in Cascadia doesn’t end in Alaska. Washington is the fifth-largest US oil-refining state, and its oil refineries dominate the state’s list of top polluters. Indeed, once the TransAlta coal-fired power plant shutters in 2025, the BP, HF Sinclair, and Marathon oil refineries will dirty Washington’s air more than any other stationary sources. The chart below shows the emissions of Washington’s top polluting stationary facilities, by industry.

Until 2023, Washington had not started to map out a potential future for the refineries the state hosts, despite Governor Inslee’s commitment to ramp up the transition to electric vehicles and thereby slash demand for oil. But, thanks in part to Sightline’s efforts to shed light on the risks to workers and the environment of an unplanned transition off of oil, the 2023 state legislature allocated a quarter-million dollars to start charting a smooth course for Washington’s refineries 

The US Oil refinery in Tacoma, Washington. Source: Emily Moore

Still, Washington has yet to fully reckon with ongoing colossal pollution from the oil sector. While the state’s landmark climate law, the Climate Commitment Act (CCA), includes the refineries under its declining state-wide emissions cap, it allows the facilities to receive free allowances to continue polluting at, or close to, their current levels for at least the next decade. Under the CCA, refineries can continue polluting for free at 100 percent of current emission levels until 2026; this figure drops to 94 percent of baseline emissions by 2034. The state has not yet established an emissions cap or allowance policy for oil refineries after 2035. The CCA’s carveouts for oil refineries and other large industrial facilities are part of why environmental justice group Front and Centered has criticized components of the law.  

In the short term, Washington policymakers could at least consider technical solutions to reducing oil refinery emissions; the think tank RMI offers several ideas, including cutting methane leaks and shutting down some especially dirty units. Still, soon the state will need to develop a post-2035 emissions reduction plan for these facilities to allow the CCA to meet its promise. 

Farther north, in what’s often considered Canada’s greenest province, fossil fuel facilities also dominate the list of top polluters. In British Columbia, though, fracked gas, not oil, is the name of the game. British Columbia accounts for 35 percent of Canada’s gas output; Canada, in turn, is the sixth-largest gas extractor in the world. Many of the province’s dirtiest facilities are found in northeast British Columbia where companies like Shell and TC Energy frack gas from what’s known as the Montney Formation. Fracking in the Montney Formation drove the province’s gas output to double since 2010. This fracked gas snakes its way through pipelines across the rest of Cascadia where homes and businesses burn it in furnaces, stoves, industrial processes, and more. Idaho, Oregon, and Washington, which have no gas reserves themselves, rely especially heavily on Canadian fracked gas.  

Like Washington, British Columbia has yet to fully reconcile its climate commitments with its dependence on the fossil fuel industry. In 2022, the BC government revised its oil and gas royalty system to remove some fossil fuel subsidies, but critics say the new regime still incentivizes fracking 

Meanwhile, the UN announced in November 2023 that Canada has the most yawning gap between climate commitments and concrete climate policies to achieve those commitments of any country in the world. That same month, Canada’s Auditor General warned that the country is unlikely to meet its 2030 emissions target. A step in the right direction would be a cap on emissions from the oil and gas sector, which Prime Minister Trudeau promised in 2021 that his administration would establish. As of December 2023, there is still no cap in place.  

4. Forest products facilities are top polluters, but Cascadian emissions limits give them a free pass    

The roots of the forest products industry run deep in western Cascadia. British Columbia exports more wood products than most other areas of the world, and Oregon and Washington top the United States’ list of lumber producers.   

At the same time, forest products facilities, such as pulp and paper mills and lumber mills, are some of the region’s biggest stationary carbon polluters—only most Cascadian climate policies give them a free pass.  

The reason stems from a distinction many make between biogenic emissions—carbon released from burning or decaying organic matter like wood—and fossil fuel emissions released from burning coal, oil, or gas. The vast majority of the carbon emissions from forest industry facilities are biogenic emissions. For example, pulp and paper mills release biogenic emissions when burning biomass or wood fuels as part of their industrial processes. The chart below shows the emissions from forest industry facilities in British Columbia, Oregon, and Washington, broken out by biogenic and non-biogenic sources.  

(The forest products emissions discussed in this section are only those from stationary facilities like pulp and paper mills, not the broader net release of carbon from forests via wildfires, clearcuts, etc.)  

Including biogenic emissions in carbon calculations catapults forest industry facilities to the top of the big stationary polluters lists in British Columbia, Oregon, and Washington. In British Columbia, pollution from pulp and paper mills and lumber mills is more than triple that of oil and gas facilities when accounting for biogenic emissions.  

But not everyone counts biogenic emissions. Some argue that new growing forests or other plants will reabsorb the carbon that burning wood products releases into the atmosphere. Others argue that because the timeframe within which a tree initially absorbed carbon and then later releases it when burned is relatively short (hundreds of years), burning wood in forest products facilities doesn’t lead to a long-term change in atmospheric carbon levels. By contrast, fossil fuels took millions of years to form, so burning them does change long-term carbon levels.  

As such, while British Columbia, Oregon, and Washington all require big stationary polluters like pulp and paper mills to report their biogenic emissions, none of these jurisdictions includes this type of pollution in state- or province-wide greenhouse gas inventories or carbon emissions limits. Washington’s CCA, for example, exempts “carbon dioxide emissions from the combustion of biomass or biofuels.”  

But the rationales for ignoring biogenic emissions in economy-wide greenhouse gas emissions look specious upon closer examination. The world needs to slash carbon emissions today to have a fighting chance of mitigating the worst effects of warming. Assurance that carbon that comes from burning wood products in an industrial facility will be reabsorbed later by some future hypothetical forest or other plant—or that that the carbon was recently already in our atmosphere, so putting it back doesn’t make a difference—is cold comfort in this context.  

At a minimum, policymakers in British Columbia, Oregon, and Washington can shed light on the region’s biogenic emissions by requiring that agencies include these sources of carbon in state- or province-wide greenhouse gas inventories. They can also explore technical solutions for reducing emissions from the forest products industry, such as the recommendations for reducing emissions from the pulp and paper and wood products sectors developed by the Clean Energy Transition Institute and the Stockholm Environment Institute in 2021. No matter what, Cascadian leaders can’t afford to ignore the pollution from these longstanding industries any longer.   

Cleaning up big polluters: Hard but necessary  

Major polluters, from oil refineries to pulp and paper manufacturers, sully the air across Cascadia, even in its greenest corners. The 180 dirtiest facilities in the region are also the hardest to clean up, whether because of their importance to the local economy or the technical challenges in doing so. Unsurprisingly, then, loopholes abound for these big emitters, even in Cascadia’s best climate policies. But Cascadian policymakers can’t afford to ignore them any longer. They can immediately start filling in cracks in current policies and exploring short-term technical fixes to clean up some pollution while they reckon with the longer-term role of these industries in Cascadia. No matter what, the clock is ticking.   


Appendix: Data and methodology  

Sightline relied on the most recent available data for large stationary emitting facilities as of December 2023 to identify all facilities emitting more than 100,000 metric tons of carbon dioxide equivalent (CO2e) in Alaska, British Columbia, Idaho, Montana, Oregon, and Washington. The emissions included in this analysis are direct emissions from the facilities only, not emissions associated with end use of a product. For example, the tailpipe emissions from a car burning gasoline refined at a Washington oil refinery are not included. Sightline excluded any facilities known to have closed since the data was released.  

The data source for British Columbia is the BC Ministry of Environment and Climate Change Strategy’s 2021 Large Industrial Facilities. Sightline removed one large emitter from the BC list (the PowerEx EIO facility) due to incomplete data. The BC Ministry of Environment and Climate Change Strategy did not provide Sightline with the missing data for this facility when requested.  

The principal data source for all Cascadian US states is the Environmental Protection Agency’s (EPA) 2022 Greenhouse Gas Reporting Tool. This data may differ slightly from state-level facility emissions data reported by Washington’s Department of Ecology and Oregon’s Department of Environmental Quality. However, as of this writing, both Washington and Oregon have only released facility emissions data through 2021. Additionally, Alaska, Montana, and Idaho do not collect or report state-level data on facility emissions. Thus, for consistency and to rely on the most up-to-date data, Sightline relied on EPA data for all states.  

The exception to using EPA data for US states is for facilities in Oregon or Washington that emit more than 100,000 metric tons of carbon when biogenic emissions are included but emit less than 25,000 metric tons of fossil fuel emissions. These facilities do not appear on EPA’s list, which is limited to facilities that emit more than 25,000 metric tons of carbon from fossil fuels. Thus, Sightline reviewed Oregon and Washington’s 2021 state-level data and added any facilities that, when biogenic emissions are included, release more than 100,000 metric tons of carbon dioxide equivalent. If these facilities were not on the EPA list, Sightline relied on 2021 state-level data for both non-biogenic (fossil fuel) emissions and biogenic emissions. 

One Year In and One Year Out: An Update on Portland Charter Reform

Find audio versions of Sightline articles on any of your favorite podcast platforms, including Spotify, Google, and Apple.

It’s been just over a year since Portland voters approved Ballot Measure 26-228 to completely revise the city charter. And we’re now less than a year away from the first time residents will exercise the city’s new proportional ranked choice voting (RCV) system to elect their new government. What do Portland voters and democracy reformers around the country need to know about the ongoing construction of this pioneering model? 

In brief, the city’s transition is on track, and Portland’s transition team and leadership have (mostly) been looking for the most effective pathways to implement the will of the voters. With the help of independent commissions and many partnerships, the city has crafted new districts, revised election rules, planned for voter education, and designed a new organizational structure. Candidates are already lining up to represent their communities. 

While the city’s transition team still has more to build, Portland’s progress so far demonstrates that intentional processes and continuous community involvement can create a solid foundation for a representative and effective government. 

Background: An opportunity for change but no guarantee 

Every ten years, the city of Portland reexamines its charter, the document that lays out how city leadership is structured and how it gets elected. The city council appoints a Charter Commission composed of volunteers from across the city to research and recommend changes to city voters. 

Many Portlanders have long been interested in change (and indeed advocated to institute regular charter review, which began in 2010), knowing that city council is not representative of residents’ diverse interests and that the current form of government impedes effective governance across the city, from trash to parking. Advocates for change paid close attention to opportunities for involvement in the Charter Commission, and many commission members (whom the city selected from a record-breaking pool of almost 300 applicants) hoped to use the process to forge a more representative government. 

In 2022, after more than a year of research and hundreds of hours of public comments, the commission recommended a suite of reforms (many of which Sightline previewed in 2017), including allowing voters to rank candidates, creating four new districts that will each elect three council members (aka proportional multi-winner districts), and replacing the commission form of government with a city council that sets policy and a city administrator who, along with the mayor, runs the city’s day-to-day operations. These changes, collected into Ballot Measure 26-228, passed in November 2022 with 58 percent of the vote. 

Big changes in government structure move forward 

City staff started planning implementation of the reforms almost immediately after the measure passed and published an annual report in November 2023 of progress thus far. A city transition team is managing the project, and a Government Transition Advisory Committee (GTAC) comprising community members advises the overall process. The city created a webpage and newsletter that tracks the transition and, in July 2023, published a full work plan that includes specific opportunities for public input and feedback. 

To guard against potential bias within controversial elements of the revisioning process, the charter amendments directed the city to appoint an Independent District Commission to draw the four new geographic districts and an Independent Salary Commission to establish salaries for the new officeholders. Both commissions prioritized input and representation from historically underrepresented groups, including communities of color and East Portland residents. 

This past July, the Salary Commission finalized the new councilors’ salaries, based on the thriving wage calculator from MIT and market data so that leaders will be fairly compensated for their service. Then in August, the District Commission adopted a new district map that reflects numerous rounds of community feedback, and in September it published a full background of its process, considerations, and public commentary. The district voting calendar also prioritizes participation from underrepresented groups; elections for the two districts with historically lower voter turnout rates will be held in presidential election years, which typically garner higher levels of turnout. And in November, city council approved a new government organizational chart. 

Electoral upgrades are on track 

The city has also prepared the scaffolding for the upcoming electoral changes. Under the new system, voters across the city will elect Portland’s mayor and city auditor using single-winner RCV, and each of the four new districts will elect three councilors using proportional multi-winner RCV (also known as single transferrable vote). Multnomah County also approved the use of single-winner RCV for all elected county offices, which will take effect in 2026. 

So far, Portland has followed many of the best practices the national RCV Resource Center recommends and has been communicating regularly with other experts in electoral reform. In addition to finalizing geographic electoral districts, the transition team’s actions in the past year related to elections include: 

  • Updating the election code with specifics for implementing RCV. The city convened a workgroup comprising city offices, Multnomah County Elections Division, and the RCV Resource Center to draft election code, which then moved through a public input process similar to that for the other new rules, with hearings, presentations, and public comment periods. In April 2023, city council adopted the election code, which specifies that voters can rank up to six candidates for each contest, eliminates the primary, and describes how skipped rankings and overvotes (when a voter gives multiple candidates in a contest the same rank) will be tabulated. 
  • Coordinating election administration across jurisdictions. Since fewer than 2,000 of Portland’s 460,000 registered voters live outside Multnomah County, Clackamas and Washington Counties agreed that Multnomah County will design ballots and count votes for Portland’s ranked choice contests. Multnomah County Elections Division is collaborating with Portland’s transition team to set up processes for the new election format and is learning lessons from the RCV Resource Center as well as other jurisdictions that have implemented single- and multi-winner RCV in other states. 
  • Moving toward certification. At request of Multnomah County, voting system vendor Clear Ballot initiated the federal certification and laboratory review processes (which the state of Oregon requires) for the RCV system in September 2023 and anticipates certification in early summer 2024. This authorization will also pave the way for the numerous other jurisdictions across the region that use Clear Ballot to easily implement RCV. 
  • Planning for voter outreach and education. The transition team developed a three-pronged approach to voter education: using existing channels like government websites and voter guides, candidate education, and partnerships for hard-to-reach voters. The city awarded a voter education contract to Portland’s United Way of the Columbia-Willamette to work with Hearts & Minds Communications, Portland United for Change, and Democracy Rising—a powerful combination of local community expertise and national RCV communication specialists—to engage directly with voters. Voter education kicked off in October 2023 and will ramp up next year. 

Attempts to upend the process have continued 

The transition process has hit some political obstructions. In July 2023, Commissioners Rene Gonzalez and Dan Ryan floated a proposal to limit some of the elements of the transition plan, including removing the use of proportional RCV (a counter that had been in the works for some time), but advocates of the voter-approved charter change united to oppose impairments to the original, carefully considered measure, and the alternative proposal did not move forward. 

More recently, the city transition team drafted a plan to move city administration from the current commissioner-managed bureaus to an interim city administrator in July 2024, providing a six-month period before the new council takes office in January 2025. While current commissioners rejected the initial proposed plan, Mayor Ted Wheeler supported the proposal as a way to ensure a smooth transition and is still considering using his authority to take back management of the bureaus in July. Commissioners also instigated a measure to hold more authority over decisions made throughout the transition, which they argued was necessary for them to see through their terms as elected representatives. Wheeler, however, noted that the increased line of authority may slow the process. 

These squabbles may slightly disrupt the transition, but hopefully will not swell enough to detract significantly from the planned shift. 

What we’re watching over the next year 

While Sightline Institute is following the city’s entire transition process, we’re inspecting the electoral reforms most closely. The upcoming voter education effort in particular will be hugely important to the overall success of the charter reform and whether it delivers improvements to Portland’s elections and governance. The city seems to be headed in the right direction, with staff taking the charge seriously and partnerships with both national groups that have contributed effectively elsewhere and local leaders who best know how to engage their communities. The statewide primary in May 2024, which will not use RCV because no Portland offices are on the ballot, slightly complicates efforts to get the word out early: advocates don’t want to roll out instructions for a new kind of ballot to city voters too soon. 

We’ll also be looking for the city’s plans for reporting electoral results. According to the RCV Resource Center, transparently sharing results round by round is the best way to keep voters’ trust in the electoral process. Portlanders should also be alerted that full results won’t be available the night of the ballot return deadline, since so many ballots come in on the last day (this delay is sometimes blamed on RCV, although it’s already a facet of most elections). 

Finally, we’ll be watching how Portland’s transition plans interact with Oregon’s statewide ballot measure to adopt RCV. Next November, voters in Portland will use RCV for the first time and decide if they want RCV statewide, so any education efforts aimed at either will hopefully cover both topics. 

When they cast their ballots in 2022, Portlanders voted for a more representative and effective government. And despite a few wrinkles, Portland’s transition team has had a productive year working to execute that goal. As the changes progress, we’re hopeful that Portland can continue to be a regional and even national leader in upgrading our democratic systems. 

How Parking Ratios Kill Homes

Find audio versions of Sightline articles on any of your favorite podcast platforms, including Spotify, Google, and Apple.

The trouble all started at a city council meeting in August 2022. An affordable housing developer was unveiling a potential project. 

It was happening in Washougal, a town of about 17,000 in housing-strapped southwest Washington. In the chain of events that followed, the city lost roughly 40 future affordable homes and may have accidentally blocked any future downtown apartments from being built under the new code. 

“It will make future projects incredibly difficult, if not impossible,” said Matt Edlen, whose firm is in the midst of constructing a six-story building that will add 46 new homes to Main Street. It’ll be one of the last projects built under the old rules. “Anything like that just stops.” 

The Walden building coming to downtown Washougal at Main St and Pendleton Way would need 56 percent more parking spaces to be permitted under the new code. Image by Edlen & Co. Used with permission.

The Walden building coming to downtown Washougal at Main St and Pendleton Way would need 56 percent more parking spaces to be permitted under the new code. Image by Edlen & Co. Used with permission. 

Local zoning codes, the thick binders of monospaced text that shape how modern cities are allowed to evolve, are often thought to be carefully crafted regulations that are uniquely tailored to each town’s history and needs.  

But Washougal’s story shows what often happens instead. Key regulations that limit how many homes can be built on any given lot are simply copy-pasted from one place to the next based off of what feels right, with scant research into the origins of those numbers or how they fit into the local context.  

When this mood board regulating new construction becomes too prescriptive, one false move by people with the best intentions can do dire economic damage. The rules can also become so complicated that even a trained city planner can easily misinterpret them. That’s exactly what happened in Washougal. 

How a parking mandate is born 

“Council really liked the project, but the question of parking came up during part of that presentation,” recounted Mitch Kneipp, Washougal’s community development director. It was still early in the process, and the Vancouver Housing Authority (VHA) hadn’t yet finalized exactly how many subsidized homes or parking spaces it planned to build. But if it went forward with 80 new homes, council members learned, Washougal zoning code required only 40 off-street parking spaces.  

Nobody had ever built to that ratio. Since Washougal had set that parking minimum in 2006, every downtown developer had voluntarily provided at least one space for every home. But if someone actually were to build to that minimum allowed ratio of 0.5 spaces per home, “that’s going to create a demand for parking that is—in their opinion, not acceptable for the city,” described Kneipp. The council tasked Kneipp with increasing the parking requirements. “So that’s what we did.” 

Washougal, like most cities, started by looking at its neighbors around the county. Ridgefield mandated at least 1 parking space per home. Battle Ground required 1.5, like Washougal did in areas outside of its downtown core. Out of the other cities in Clark County, only the much larger city of Vancouver, Washington, gave more flexibility over parking spaces.  

Not wanting to be an outlier, in August 2023 the Washougal city council voted to increase residential parking mandates in its downtown to match those of neighboring Camas: 1 space per studio, 1.5 spaces per one-bedroom, and 2 spaces for homes with two or more bedrooms.  

Unfortunately, Washougal officials had failed to notice a snippet of code that relaxed these mandates for multifamily housing projects—provisions that were critical to making apartments financially feasible. 

Parking flexibility was critical for new housing in downtown Camas 

It’s easy to see why any town would want to copy what Camas is doing. The former mill town of 27,000 has reinvented itself in recent decades, attracting new businesses and the highly paid workers that come with them. This October, Camas was selected as one of eight semi-finalists for the national Great American Main Street award, recognizing the Downtown Camas Association for its work reducing commercial vacancy rates from 60 percent in 2009 to less than 1 percent today. 

Downtown Camas. Photo by the Downtown Camas Association. Used with permission.

Downtown Camas. Photo by the Downtown Camas Association. Used with permission.

“When I first opened a store in 2004 there was not much going on,” said Carrie Schulstad, executive director of the Downtown Camas Assocation. “We had plenty of parking, because there weren’t people.” For decades, there were only 32 homes downtown. That number doubled in 2020 after the opening of the Clara Flats building with 30 new residences. Another building about to break ground, named Hudson East, will add 56 more.

Left: Clara Flats in downtown Camas. Photo by Catie Gould. Right: Hudson East building. Image by Cascadia Development Partners.

Washougal thought it was copying Camas. But neither of those buildings would be legal to build under Washougal’s new code, which would require each to be surrounded by a big parking lot. 

Washougal’s planners had missed that for many years, Camas’s code has contained a unique and complicated rule that effectively cuts parking minimums for multistory buildings by half or more. Where that exemption came from is anyone’s guess. But without it, neither of the town’s new downtown housing developments would have been allowed. 

Thanks to the snippet that discounted the upper stories from the high parking requirements, the pair of new buildings only were required to have 0.6–0.9 parking stalls per home.  

To Schulstad, buildings like these are exactly what a healthy modern downtown needs. “In the Main Street world, you want lots of people living downtown,” she said. 

Washougal builders grapple with town’s new parking ratio 

The increased parking mandates run contrary to the vision Wes Hickey has long had for downtown Washougal. His aim was to create a vibrant city center rather than more strip malls on the outskirts of town, and he has been working for decades to make it happen. His company, Lone Wolf Development, built the iconic Town Square building in 2007, among several others. 

This decision does not seem like it was really thought out,” he said about the policy change. “There was no discussion of ‘how does this impact anything’ or ‘is this helpful to move downtown redevelopment forward’.”  

“I am not able to envision what any private developer could build in downtown Washougal right now with their current parking requirements,” said Hickey. 

Victor Caesar said the new rules will force the VHA’s tax-subsidized affordable housing project to house fewer people than it would have. Due to the August code change, VHA has pivoted from an initial goal of 80–90 units of workforce housing down to just 40–50 homes for seniors, in part because Washougal still allows lower parking ratios for senior housing.  

The homes are sorely needed. Half of renter households in Clark County are considered rent-burdened, spending more than 30 percent of their income on housing.  

In response to the city’s inquiry into parking minimums, the VHA prepared a capacity analysis to show the city what a higher parking ratio would mean. The site, which covers three-quarters of a city block, could fit a maximum of 40–45 parking spaces on the ground floor. To meet higher parking ratios, the building has no option but to shrink.

Graphics by schemata workshop. Used with permission.

A parking garage, which officials from the city suggested the VHA could consider, was out of the question. “I’ve worked in real estate and affordable housing for almost a decade now,” Caesar said. “There’s just no way you can get a parking garage to pencil.” A multi-level structure can cost upwards of $80,000 for each parking space. 

Even the market-rate Walden building, currently under construction a block away from the VHA site, can’t shoulder the cost for a multi-level parking garage in the small-town market. “Mass excavation, shoring costs, water considerations. All of these things make going down [to build underground parking] very, very expensive,” explained Edlen. Building multiple levels of parking above ground wasn’t a good option either, due to overall building height restrictions. More floors dedicated to parking means fewer floors remaining for housing and other uses that actually make money for the building. “You’ll never recoup what you spent on the parking stall based on what you can charge for parking,” said Edlen. The cost—hundreds of dollars in additional rent per month to finance each parking stall—gets passed on to the tenants upstairs, whether they use the parking or not.  

“That is going to make development really challenging,” Edlen said about the increased requirement. “That’s the kind of parking ratio that you would have seen 20 years ago.” 

The only way Edlen could fit a parking space for every home in the downtown Walden building was through a mechanical stacking system that fits three cars into the space of one. The system costs roughly $30,000 per parking space. But even accounting for the fancy mechanical car stacker, the building would still be 20 parking spaces short of the new requirements. This project was lucky. It had already gone through permitting before the change. But without special permission to deviate from the zoning code, it wouldn’t be allowed again.  

Bar graph showing how parking requirements would cause more parking lots to be built
In other cities, Edlen might be able to provide additional parking by leasing spaces from a city-owned lot nearby. Washougal has no such lots available. Ironically, the desire to avoid having to build a
public parking facility in the future was one of the primary reasons that the council increased the off-street parking requirement in the first place, effectively shifting the cost of presumed parking needs to the private market. 

In practice, high parking mandates—like the 1.5 spaces per home required outside of downtown Washougal—require acres of land for surface parking for projects to be viable. Sites this large are rare to find in the city center. Washougal’s Ninebark apartments, which opened in 2023, provided 1.6 parking spaces per home. Residents will need cars for daily life here. Its location far from downtown means it only has a walk score of 20.  

Under the new city code, if the complex was located downtown where residents might not need to drive for every trip, the project would require even more parking than it has now. 

The Ninebark Apartment’s 1.6 parking spaces per home wouldn’t be enough to meet the new downtown parking minimum. Image by Ninebark Apartments. Used with permission.

The Ninebark Apartment’s 1.6 parking spaces per home wouldn’t be enough to meet the new downtown parking minimum. Image by Ninebark Apartments. Used with permission.

Caesar is still exploring options for the VHA project, including purchasing a nearby property for surface parking or securing a slightly lower parking ratio through a development agreement with the city. A discretionary approval is not as good as a by-right allowance, though, Caesar explained. The project loses points on funding applications, and the agreement is subject to change with a shift in the political winds. But with parking mandates so high now, such agreements are likely to be the only way any new housing will be feasible to build in downtown Washougal. 

Unfortunately, Washougal is not unique 

Setting parking requirements is more of a political activity than a professional skill, professor and parking economist Donald Shoup writes: “I have never met a city planner who could explain why any parking requirement should not be higher or lower.” Planners, he insists, are winging it. 

Case in point: Washougal’s story is unfortunately not the exception but the rule. “A lot of jurisdictions kind of rely on each other,” Camas planner Robert Maul replied when asked where his city’s parking minimums originated.  

The hyperlocal politics of parking incentivizes cities to participate in this game of telephone. Every single trip a driver takes must both start and end in a parking space, providing an abundance of opportunities for frustration and panic at the prospect of not finding one. The housing that goes unbuilt—and the anguished calculations of those who find they can’t afford to live where they want—are invisible by comparison.  

In any given town, only a handful of builders and city staff might know the extent of the damage. 

Indeed, the high parking requirements that threaten future housing in downtown Washougal prevail across Washington. Pasco requires 2 parking spaces for every home. So does Puyallup. Even for studio apartments, where tenants forgo a bedroom for cheaper rent, Auburn and Bremerton require 1.5 parking spaces apiece; Lynnwood requires 1.25. At that ratio, builders must dedicate as much land to parking cars as to housing residents. This, in a state that has calculated it needs to build 1.1 million more homes in the next 20 years to address its severe housing shortage and high rents and prices. 

In recent years, cities and states have increasingly been reducing or removing their parking minimums in order to reduce red tape for sorely needed housing. This past year Spokane eliminated residential parking mandates for the vast majority of the city. Across the border in Oregon, nine cities have eliminated their minimums citywide to comply with new state land use rules. 

Washington does have some guardrails in place to protect new housing from excessive parking mandates. In 2019 and 2020, the state capped how much parking cities can require for certain affordable housing, homes for seniors and people with disabilities, and regular market-rate multifamily homes. But those protections only apply within a short distance of frequent transit, as if those are the only locations that a parking mandate can possibly be set too high. Smaller communities like Washougal and Camas don’t qualify. 

Kneipp said that in the next year-and-a-half, Washougal will likely conduct a parking management plan for downtown. Maybe after that, its council will be moved to re-lower parking mandates, making new downtown housing possible again. 

“Downtown is where we need to look at getting the density,” Kneipp said. “This is where we have our services. It’s much easier to build here than up on the hill, put in bigger pipes and everything else.”  

That growth won’t be possible if new housing is hamstrung by parking every time. “I believe we are going to have to change regulations again,” Kneipp said. “I don’t think there’s a way that we can get away from it.” 

Sightliners’ 2023 Giving Tuesday Recommendations

At Sightline Institute, our efforts focus on building sustainable communities throughout Cascadia; we believe we are all in this place together, sharing its burdens and benefits, rising or falling as one. Sightline stands for strong communities. To ensure our communities thrive, we must also work together to support the unique organizations addressing the complex challenges our neighbors encounter.  

With Giving Tuesday happening today, Sightline is encouraging folks to give to causes close to their hearts and to bolster their local communities. If you’re seeking inspiration, our team has curated a list of impactful organizations that have captured our hearts this Giving Tuesday. On this global day of generosity, we hope that Sightline readers and fans will help support sustainable and strong communities. 

Community Cycling Center 

Portland’s Community Cycling Center expands the community’s access to bicycling, giving more people a chance to use all that beautiful bike infrastructure across the city. It provides educational classes, repairs, low-cost bikes and parts, and other services to help get people out and about on (approximately) two wheels. Or if policy reports are more your style, they also provide crucial research on the barriers to bicycling across all parts of Portland. –Jay Lee 

Ballard Food Bank 

I really love the local food bank because of the way it is structured. It provides such amazing opportunities for local members of the community to be respected and treated with dignity. I particularly love the fact that the food items are set up in a grocery shop-like fashion that allows individuals to browse the shelves for what they need. There are also options for prepared food that does not require a kitchen. Even something as simple as a mail program for people to pick up their mail for free without a mailing address increases the respect for an individual immensely. I am proud to know that they serve all of Seattle. –Nashrah 

Wing Luke Museum 

The Wing Luke Museum in Seattle’s Chinatown International District focuses on the culture, art, and history of Asian Americans, Native Hawaiians, and Pacific Islanders. The Sightline staff had the privilege of participating in one of the museum’s informative and moving neighborhood walking tours during our annual retreat this summer. We learned about the history of dispossession, displacement, and incarceration of Seattle residents of Japanese descent in WWII and the destruction of much of the city’s once 20-block-long Japantown, as well as heard inspiring stories of resilience and community in the neighborhood. The Wing Luke Museum was unfortunately the victim of a racially motivated attack earlier this year. I recommend supporting this important institution, whose importance stretches beyond Seattle. –Emily Moore 

Get Out the Native Vote (Be sure to choose GOTNV in the drop-down menu) 

Get Out the Native Vote (GOTNV) was founded with the belief that the right to vote is a fundamental component of a healthy democracy. GOTNV’s roots are in working to ensure every eligible Alaskan is registered to vote and in removing barriers that prevent registered voters from casting their ballots. GOTNV encourages every Alaskan, regardless of background, to engage in the civic process at the local and state levels through nonpartisan outreach and education. –Jeannette Lee 

Northwest Immigrant Rights Project 

Washington state has more than 250,000 undocumented immigrants, many of whom have fled violence or insecurity. Northwest Immigrant Rights Project provides legal aid and community education to help Washington’s immigrants navigate our complex legal system and receive fair protection under the law. –Kate Macfarlane 

Anchorage Housing Club 

The Anchorage Housing Club is a new organization that welcomes all members of the community who are interested in ensuring Anchorage can become a community where everyone thrives. The club aims to actively influence housing and transportation policy by mobilizing Anchorage residents who share our vision of human-centric transportation and abundant, quality housing. –Jeannette Lee 

Family Promise 

Family Promise is a Bozeman-based organization that empowers families experiencing homelessness to secure a safe, affordable home, a livelihood, and the chance to build a better future for their children. Family Promise provides prevention and diversion services to prevent families from experiencing homelessness, emergency shelter when homelessness becomes a reality, and transitional and workforce housing to ensure long-term sustainability. –Alice Buckley 

Outdoors for All 

One of the highlights of living in the Seattle area is the abundance of outdoor recreation activities and how much you can learn about yourself just by getting out and playing in our beautiful surroundings. There are some real barriers to outdoor recreation for many marginalized communities, but for people with disabilities, it can seem insurmountable. Outdoors for All provides access to many outdoor pursuits through its programming and adaptive equipment rentals. Outdoors for All also offers group programming and provides training and equipment to make sure that social, recreational activities are as accessible as possible for all audiences regardless of ability. –Leah Quinn 

Freedom Reads 

This program is very special, as it builds small libraries in prisons to allow individuals a sense of adventure and transform a vision of what they could picture for themselves outside the walls of the prison. I love that the founder created this after his time in prison in solitary confinement and had a book completely change the course of his future. It is so special to know how important books can be for this population at risk for so many challenges as they reintegrate back into life outside prison. As its website states, “Books become essential when you want to imagine a new life for yourself.” –Nashrah 

The Uproot Project 

It will probably surprise no one that as a communications professional and a speculative fiction fiend, I deeply believe that today’s most important climate work is happening in organizing and storytelling spaces, especially those that reach beyond white-centering or apocalyptic visions and themes. The Uproot Project was founded “to address an urgent gap: the lack of representation of journalists of color in newsrooms across the country covering communities that are hit first and the hardest by the climate crisis…. We set out to create a network to support the work of our peers, while advancing the careers of reporters of color who have been historically underrepresented in environmental journalism.” While I can’t claim to keep up with its bustling Slack channels, I attended a great panel discussion it hosted last month on covering Indigenous stories as a non-Indigenous journalist, and I’ve read a number of articles from its member journalists to include in our Sightline Daily news roundup that I may not have stumbled on otherwise. –Serena Larkin 

Pike Market Senior Center and Food Bank 

During my time as an AmeriCorps VISTA, I had the pleasure of serving at the Pike Market Senior Center and Food Bank. I witnessed the incredible work they do in downtown Seattle. The Pike Market Senior Center strives to make each day better and safer for older adults, while the Food Bank serves people of all ages who face hunger. Together, they provide services, activities, and support to promote healthier, more self-sufficient, and fulfilling lives. With increasing food prices and more demand than ever, it’s a vital part of the Seattle social safety net that’s under considerable strain. Every dollar given goes to creating a better life for our neighbors downtown. –Terry Satran 

Bureau of Fearless Ideas 

The Bureau of Fearless Ideas is a dynamic community of youth, adults, volunteers, and families committed to harnessing the transformative power of words. Its programs, which are entirely free, offer tutoring, writing guidance, and publishing opportunities to young people aged 6 to 18. By fostering strong writing skills and celebrating diverse communication styles, the organization empowers these young folks to share their unique stories and become engaged, confident leaders. In each neighborhood it serves, the Bureau of Fearless Ideas creates a welcoming space that connects with the local community, promoting the belief that words can open doors to opportunity, create understanding, and build a better world. Alexa Woodard 

Is the Permitting Process for Transmission Lines Really Broken?

Find audio versions of Sightline articles on any of your favorite podcast platforms, including Spotify, Google, and Apple.

Editor’s note: This is the third of three articles discussing the major challenges—planning, paying for it, and permitting—to building the transmission lines needed to transition to a cleaner energy future. 

Permitting reform is the topic du jour in US climate circles. Renewable energy advocates and fossil fuel boosters alike are rallying to speed governmental approval of energy projects. At the same time, some progressives decry this effort as a misguided ruse to dismantle bedrock environmental and community protections. 

How should climate leaders make sense of these debates? Just how big a barrier is permitting, really, to building the electric power grid Cascadia needs to decarbonize its economy? In short, how much should we worry about permitting? 

At first glance, permitting transmission facilities in the Northwest looks like a hot mess.1This article and series focus on transmission capacity just in the US portion of Cascadia, given the fundamental differences between American and Canadian electricity systems and grids.
The only new regional line, the Boardman to Hemingway (B2H) project, crawled through federal and state approval processes for 14 years.2Idaho Power started seeking permits in 2008 and in 2022 received one of the final authorizations necessary to begin construction.
Idaho Power and PacifiCorp, the line’s sponsors, still have not broken ground. B2H being the only new big wires project that is even close to construction in the Northwest may be further evidence that permitting is broken. 

However, future transmission projects in the region could have it easier. Recent federal policy and regulatory efforts to shorten review processes and improve permitting coordination may lower some of the hurdles B2H faced. And Oregon’s state-level review, which B2H underwent, is among the most complex in the region; projects routed through other states might start moving dirt more quickly. 

Still, the mounting climate crisis demands that Northwest policymakers do more than wait for the next transmission project to come up and hope for the best. They can bulk up staff capacity at regulatory agencies and tribes, which must review unprecedented volumes of new clean energy projects. They can immediately identify high-priority routes for new transmission lines and conduct preemptive environmental reviews and tribal consultations. They can enable—or better yet, require—tight alignment between state and federal review processes. None of these actions would mean jettisoning bedrock environmental protections or trampling on tribal and community rights. 

With 2023 on track to become the hottest year on record, the Northwest needs to move fast to approve critical transmission projects, without surrendering its tools to block dirty or unjust energy proposals. 

What is permitting, and how does it work in the Northwest? 

Permitting is the process of federal, state, and/or local governmental agencies granting a developer the necessary approvals to build, upgrade, or operate a transmission line.3Definition adapted from NRDC’s policy brief “Down to the Wire,” Sept. 2023.
The types of permits a transmission facility needs depend largely on where developers site the project and who owns the land it will traverse. 

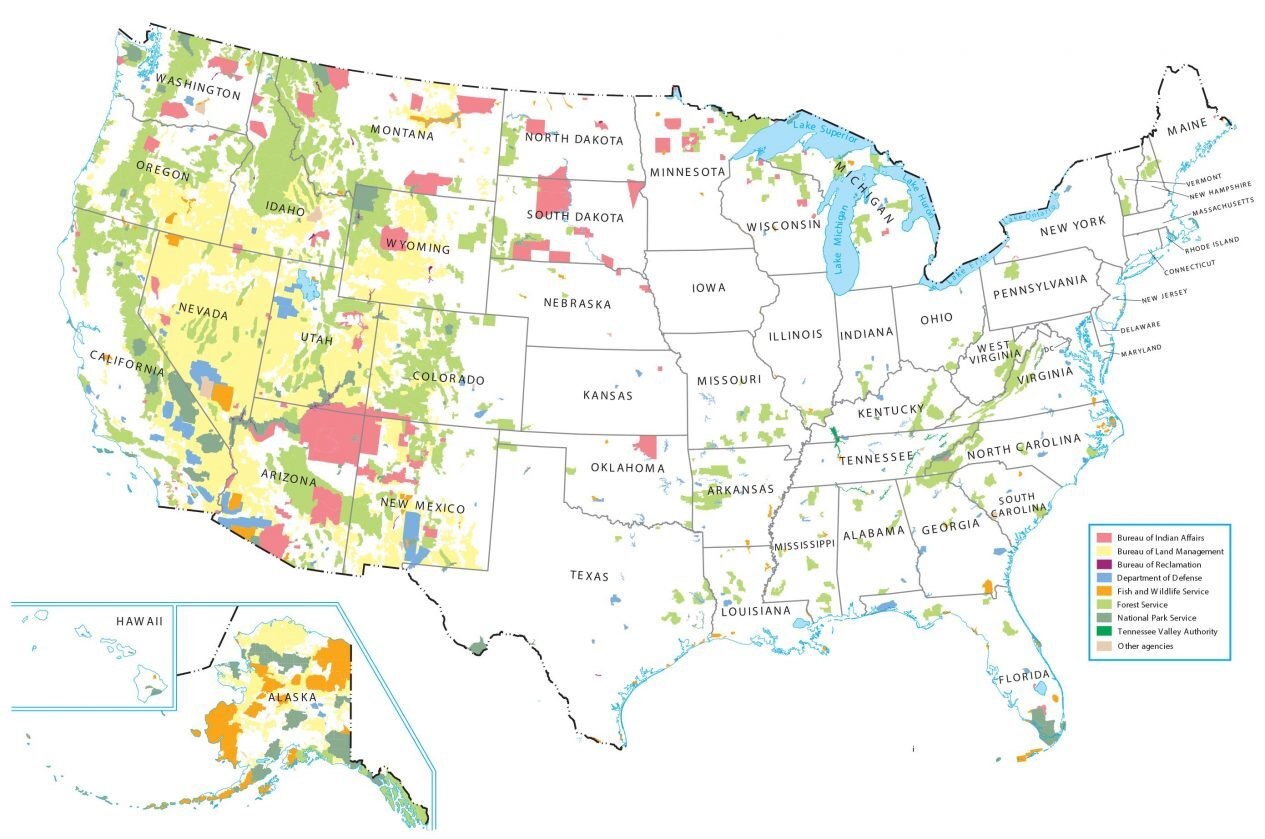
In the Northwest, as in the West writ large, the high percentage of land the federal government owns almost guarantees that interstate transmission lines require federal permits. One-third of the B2H route, for example, runs across federal land. The map below shows the federal land in the United States, with different colors identifying which federal agencies have jurisdiction; areas shaded pink and labeled as Bureau of Indian Affairs are tribal reservations.4 See 2020 Congressional Research Service report of all the federal acreage as a percentage of total acreage for each state.
  

If a project crosses federal land, it will trigger review under the National Environmental Policy Act (NEPA) and likely several other laws, such as the Endangered Species Act, the Fish and Wildlife Conservation Act, and the National Historic Preservation Act. The National Historic Preservation Act requires government-to-government consultation with federally recognized tribes the project could affect, whether because it crosses tribal land or because the land it traverses holds tribal religious or cultural significance. 

Figure 1. Map of federal lands in the United States. 

Map of US federal lands

Source: GISGeography.

In addition, transmission line developers are likely to need state and/or local approval. In Montana, Oregon, and Washington, the state holds the ultimate authority for permitting most big transmission lines. Before state agencies can issue permits, both Montana and Washington compel environmental reviews modeled after NEPA, while Oregon requires a bespoke process for assessing projects against a set of environmental and other standards. Idaho has neither a state-level environmental review process for energy facilities nor a state-level permitting process. A transmission line running through the state needs permits from each county it touches. 

Is permitting broken? Examining three common claims in the Northwest 

Idaho Power gives at least three explanations for B2H’s snaillike approval process, and these arguments echo those that permitting reform advocates tend to make across the United States.5Idaho Power and PacifiCorp jointly own the B2H project, but Idaho Power took the lead on permitting.
Sightline analyzed each in turn, exploring their relevance given recent policy and regulatory developments and the broader Northwest context. 

Claim 1: Environmental reviews are unnecessarily protracted 

Permitting reform advocates tend to direct much of their ire at the purportedly excessively long environmental review processes that federal and/or state laws oblige governmental agencies to follow before issuing permits.  

At first glance, B2H’s experience supports reformers’ arguments. It took seven years for the Bureau of Land Management (BLM) to complete a NEPA-mandated federal Environmental Impact Statement (EIS) and another four years for Oregon’s Energy Facility Siting Council (EFSC) to complete its state-level review.6There are three progressively more stringent levels of NEPA reviews depending on the likely significance of environmental impact: finding of non-significance, an environmental assessment, and an EIS. Regional and interregional transmission lines are almost guaranteed to trigger an EIS given the inherent complexity of transmission lines.
 7See BLM’s 2017 Record of Decision for additional details about B2H’s federal process.
 

However, the same fate may not befall future transmission projects in the Northwest. For starters, the seven years it took BLM to complete B2H’s EIS is an outlier; multiple independent analyses have found that EISs take, on average, roughly three years to complete. Further, the 2023 Fiscal Responsibility Act imposed a new, albeit controversial, two-year deadline on the NEPA process. And in August 2023, the US Department of Energy (DOE) proposed a new rule that would set two-year deadlines for federal environmental review and permitting of transmission facilities specifically. The DOE rule also aims to improve coordination between the multiple federal agencies that must grant a project approval. (B2H, for example, needed authorization from BLM, the US Forest Service [USFS], the Department of the Navy, and the Bureau of Reclamation.) 

In addition, some states in the Northwest impose deadlines or timeline goals, which could lead to faster future state-level assessments than the one Oregon completed for B2H. Montana, for example, gives its Department of Environmental Quality (DEQ) nine months to complete state environmental reviews of transmission lines. 

“I don’t see the state being the roadblock,” Craig Jones, who leads environmental reviews and permitting at Montana’s DEQ, told Sightline. 

Indeed, Oregon may have the lengthiest review process in the Northwest. Some renewable developers consider the state to impose “one of the—if not, the—most onerous permitting processes in the country,” Max Greene, deputy director at the energy advocacy organization Renewable Northwest, said at a recent public EFSC meeting. While Oregon sets a 12-month deadline for EFSC to issue a site certificate, in practice, timelines can extend far longer than a year. That’s in large part because of Oregon’s automatic appeal requirement, known as its contested case proceeding, which allows members of the public to raise concerns about a project. A contested case proceeding is not subject to any deadlines. In the case of B2H, the process stretched for nearly two years—roughly double the time it took for other recent non-transmission projects in the state.8According to information provided to Sightline by email from Oregon’s EFSC.
EFSC is currently undergoing a rulemaking proceeding to improve the efficiency and clarity of its contested case process. 

Even so, multiple sources Sightline spoke to hypothesize that Idaho Power’s lack of familiarity with and experience in Oregon may be partly to blame for B2H’s lengthy state-level review. Plus, some decry the emphasis on time limits as ignoring the deeper issue of regulatory agency capacity constraints. Indeed, one of the only comprehensive reviews of NEPA timelines found that “staff availability, a lack of expertise, [and] inconsistent funding” are major drivers of NEPA delays. A senior representative at a major utility in the Northwest echoed the sentiment in a conversation with Sightline. 

“We don’t want a bad project pushed through that doesn’t answer questions,” she said. “Then we’re faced with lawsuits.” Instead, she said, she’d rather see further investment in staff capacity at state permitting agencies. 

Claim 2: Federal and state permitting processes are out of sync and duplicative 

Federal- and state-level environmental reviews are also difficult to align, even when they effectively work toward the same goal, according to permitting reform advocates. 

Again, this claim does appear to hold true in the case of B2H. Idaho Power first attempted to initiate its federal and Oregon environmental review processes in parallel. However, the company quickly found that doing so was virtually impossible, Mitch Colburn, Idaho Power’s vice president of planning, engineering, and construction, told Sightline. Thus, the utility paused the state-level review until the federal government had completed its analyses and approved the project. 

The difficulty in syncing the two processes is largely because, unlike nearly 20 other states, Oregon did not model its environmental requirements after NEPA. NEPA obliges federal agencies to evaluate a “range of alternatives” to a given project before making a decision, whereas Oregon’s process requires application of a set of standards to single project.9See here for a summary of the differences between NEPA and Oregon’s EFSC process.
 

“An applicant really must know what the final route approved by the lead federal agency will be to be able to conduct surveys and prepare materials necessary [for Oregon’s review],” an Oregon EFSC representative told Sightline. Oregon’s standards demand detailed analysis that often goes above and beyond what NEPA calls for, she explained. BLM analyzed more than 40 route variations for B2H; applying Oregon’s standards to all 40 of them would have been a gargantuan task. 

A future transmission project running through Montana or Washington may be better able to sync up state and federal reviews. (Idaho has no state-level review.) Both states modeled their policies after NEPA and allow state agencies to adopt NEPA analyses to avoid duplication. 

“We work together on one document to meet both of our needs since a lot of our [work] overlaps with [the federal government’s],” Jones of Montana’s DEQ explained. 

Similarly, in Washington, “if there is going to be a [state environmental policy act (SEPA)] review and a NEPA review, you can adopt portions of each other’s analyses,” a representative from Washington’s siting and permitting agency told Sightline. 

Claim 3: State and local interests hold too much sway over nationally important lines. 

One of the most common calls for transmission permitting reform in the United States is to expand the federal government’s power and allow it to override state or local inaction on or opposition to new wires. Unlike for interstate natural gas pipelines, the Federal Energy Regulatory Commission (FERC) cannot authorize interstate transmission lines over state objections or grant project developers eminent domain power over state, local, or private land.10The Natural Gas Act grants FERC the authority to issue a certificate of public convenience and necessity for interstate natural gas pipelines and for the holder of that certificate (i.e., the developer) to exercise eminent domain powers over state, local, or private land.
 

“I would have FERC be the one-stop shop [for permitting],” Adam Richins, Idaho Power’s chief operating officer, said on a 2023 podcast during which he shared “horror stories” from B2H’s permitting process. 

In fact, the 2021 Infrastructure Investment and Jobs Act did marginally expand FERC’s permitting authority over transmission lines. The agency can now approve a line that the DOE deems to be in the national interest if states have denied a permit for the project. Previously, FERC could only use this authority in the case of state inaction, not outright denial.11Since 2005, FERC has had the authority to permit transmission lines that are in DOE-designated “National Interest Electric Transmission Corridors” (NIETCs) if a state withheld approval for more than one year. It has never used this authority. The DOE is still in the process of designating corridors.
 

But many argue for expanding FERC’s authority even further. Senator Joe Manchin’s (D-WV) controversial 2022 permitting bill would have allowed FERC to authorize interstate transmission lines that DOE deems are in the national interest without waiting for state denial or inaction. It also would have given transmission developers that received a permit from FERC eminent domain powers over state-owned land. Lawmakers cut these provisions, though included the rest of Manchin’s so-called dirty deal in the 2023 debt ceiling bill. Separately, Senator Sheldon Whitehouse (D-RI) and Representative Mike Quigley (D-IL) have twice introduced the Streamlining Interstate Transmission of Electricity (SITE) Act. This measure would grant FERC permitting authority over certain large interstate transmission projects even if they are not in DOE-designated National Interest Electronic Transmission Corridors. 

Expanding FERC’s transmission permitting authority is a worthy national decarbonization strategy. But doing so would change nothing about the federal permitting process, which was the longest part of B2H’s approval timeline. Plus, expanding FERC’s authority could spark political backlash in Oregon and Washington, given it would essentially render these states’ bedrock environmental review processes obsolete for certain transmission lines. It might be a better strategy, then, to exempt certain high-priority transmission lines from state-review processes through state policy that Northwest leaders devise with tribes, environmentalists, and others. 

State leaders can do more to alleviate permitting headaches 

Still, Northwest leaders can take proactive steps—and indeed, Washington already has—to hasten permitting processes for future wires projects critical to the region’s decarbonization goals. 

1. Fully staff state agencies and tribes 

State permitting and siting agencies and tribes need enough staff to be able to properly and quickly evaluate the swell of new clean energy projects, not just transmission lines, coming their way. But Oregon and Washington’s relevant agencies each count just roughly ten full-time employees working directly on siting and permitting.12Oregon information according to a conversation with a staff member from Oregon’s EFSC.
And many tribes lack the staff to evaluate projects for cultural or environmental impacts, let alone evaluate them more quickly. 

“When I first started [in 2005], we reviewed approximately 200 projects a month. We are up to, on average, 1,000 projects a month,” Steven Moses, the Snoqualmie Tribe’s director of cultural resources, explained as part of Washington’s 2022 Transmission Corridors Work Group. Moses was presumably referring to any projects requiring tribal review, not just clean energy ones. He works with a team of just three people who review projects. 

Partly as a result of the state’s Transmission Corridors Work Group’s recommendation, Washington directed $2 million of its 2023–2025 operating budget to the state’s permitting and siting agency, the Energy Facility Site Evaluation Council (EFSEC) and more than $16 million to tribal capacity grants, including to support tribal “consultation on clean energy siting projects.”13Not to be confused with Oregon’s EFSC.
Oregon also recently granted its EFSC the authority to hire another siting analyst, according to Diane Brandt, Renewable Northwest’s markets and transmission director. 

Still, states can do more. A Sightline source who works closely with several tribes in the region argued that resources for tribal capacity are still far from sufficient to meet the tidal wave of new projects. Similarly, a utility executive told Sightline, “From my perspective, you can’t have enough [Washington] EFSEC staff.” 

All Northwest states would be smart to continue and deepen these capacity investments. 

2. Map and assess priority transmission routes 

Northwest leaders can also get a head start on future environmental reviews. They can convene tribes, renewable developers, utilities, the Bonneville Power Administration, local leaders, environmentalists, and others now to map all the potential transmission corridors in the region, assess their likely environmental and cultural impacts, and identify the highest-potential and lowest-conflict routes. As part of this effort, they could evaluate the suitability of siting transmission lines along highways or other already developed land. And they can leverage existing analysis by BLM to identify routes on BLM or USFS land in 11 western states that avoid “known resource and environmental conflicts.” 

Here, too, Washington is beginning to lead the way. In 2023 the state directed EFSEC to conduct assessments, known as “nonproject” EISs, for electric transmission lines in geographic areas suitable for those types of facilities. The law compels EFSEC to request input from federally recognized tribes and overburdened communities and to use the nonproject EISs as a starting point for future project-specific ones. However, as of September 2023, EFSEC had not yet started this work; the council was still trying to hire someone with the necessary expertise. 

Other states in the region can follow Washington’s example. In fact, in 2023 Oregon considered but did not pass a bill that would have required state agencies to identify ideal locations to site transmission lines. Lawmakers would be smart to revive that effort. 

And if advanced assessments end up failing to shorten the timelines for project-specific state reviews, leaders in the region could consider going a step further: they could waive some or all components of state-level project-specific reviews for proposals sited within designated priority corridors. (For a somewhat analogous example, in 2023 Washington exempted from its State Environmental Policy Act [SEPA] housing developments that comply with local comprehensive plans.) However, the state would need to solicit genuine tribal agreement on any effort to waive state-level reviews. Efforts to reform Washington’s SEPA several years ago “went horrible from a tribal perspective,” according to Moses of the Snoqualmie Tribe, who said tribes were “called in late” and “bullied by various groups.” 

3. Enable and formalize federal-state coordination

Finally, Northwest leaders, especially in Oregon and Washington, can do more to sync federal and state environmental reviews and avoid unnecessary duplication. Idaho Power, the permitting lead for B2H, and Oregon’s EFSC actually agree that that state’s process is fundamentally misaligned with the federal review process—a fact that suggests that action from Oregon policymakers is in order.  

The federal EIS for B2H, which stretches thousands of pages, assessed the project’s impacts on dozens of issues, including cultural resources, soil, minerals, paleontological resources, sensitive plant species, wetlands, wildlife habitat, endangered and protected species, agriculture, recreation, and wilderness lands. Oregon’s own review, which came in at more than 700 pages, assessed the project on several similar, if not identical, topics. At a minimum, surely Oregon can devise a way to conduct at least some of its assessments in conjunction with federal partners. 

In Washington, coordination between SEPA and NEPA may be easier. Still, no recent transmission project has practically tested it. As such, policymakers could proactively bolster and formalize collaboration between state and federal permitting agencies. Washington’s EFSEC could develop standard Memorandums of Understanding or cooperative agreements with federal agencies likely to be involved in transmission line permitting. Indeed, the agency could do that now with the federal agencies that will, along with Oregon, need to assess the Cascade Renewable Transmission project, the first new line to be proposed in years that would span Washington. 

Still, Oregon and Washington lawmakers may find that syncing federal- and state-level environmental reviews continues to elude transmission projects. In that case, they could again consider taking the further step of exempting certain new wires facilities—namely those already undergoing federal reviews and in agreed-upon corridors—from the additional layer of state-level review. 

Permitting reform that preserves PNW values 

Permitting reform has captured the attention of the United States’ climate and energy circles, including those in the Northwest. With B2H as the only regional transmission project in the Northwest moving forward, it’s hard to say definitively yet if its drawn-out permitting experience is the exception or the rule.  

Leaders shouldn’t wait to find out. They can expand state regulatory and tribal capacity to review new projects; identify and assess high-priority, low-conflict corridors for transmission lines; and formalize federal and state coordination of environmental reviews. Taking these actions does not mean jettisoning the region’s commitment to environmental protection or repeating the historic injustices of the last century’s energy build-out against tribal nations, when utilities and public agencies dammed salmon runs and homelands with little regard for the rights of Indigenous groups. 

The region can’t afford another 14 years to permit the next big transmission line. Proactive steps now, alongside a plan and way to pay for new lines, can help us get to yes at the clip the climate demands. 

In Every Washington City, Odd-Year Elections Crush Voter Turnout

Find audio versions of Sightline articles on any of your favorite podcast platforms, including Spotify, Google, and Apple.

In every city in Washington, a 60-year-old state law suppresses voter turnout. It prevents municipal governments from doing the one thing that would reliably boost citizens’ participation in elections—a single change that would increase voter turnout by, conservatively estimated, 62 percent. 

The one thing in question would be to let cities and towns move their elections to the same date and the same ballots as state and federal elections. Doing so would allow localities to ride the turnout coattails of presidential and Congressional elections. 

Consolidating local with federal elections, a growing trend in US cities, is immensely popular with voters of every political stripe, enhances the representativeness of the local electorate, holds local leaders more accountable to local values and policy preferences, and can save millions of dollars of public funds. 

But the principal benefit of election consolidation is none of these things. The principal benefit is that it increases voter participation, giving many more residents a say in how their lives are governed. Election consolidation does so dramatically, and it does so ubiquitously. To quantify these effects, Sightline developed a new method for estimating the turnout penalty for cities’ off-cycle elections and the turnout bonus for legislative races’ on-cycle schedule. 

Every city suffered an off-cycle turnout penalty 

Specifically, Sightline calculated the turnout penalty of off-cycle elections in all of Washington’s cities and towns with populations of 10,000 or greater and found a turnout penalty in every single one for which data are available. The “turnout penalty” is the difference in turnout in a city between the 2021 general election and the 2022 general election.  

For example, the city of Seattle had 267,414 ballots cast in its November 2021 municipal election, when the mayor, city attorney, and two at-large city council members were elected. The following year, in the November 2022 general election, when Congressional and state legislative seats were decided, the city’s voters turned in 333,912 ballots. The off-cycle city races had about 66,500 fewer ballots, which is 20 percent lower than the on-cycle turnout. The turnout penalty of holding its municipal election off cycle was therefore 20 percent. 

Seattle’s penalty was relatively small. Spokane had a turnout penalty of 39 percent, and Tacoma’s was 43 percent. Lumping together all mid-sized and large municipalities, defined as those with 10,000 or more residents of voting age, the turnout penalty in the 2021 off-cycle election was 37 percent of all voters—more than 578,000 ballots not cast that year. That turnout differential is many multiples the size that get-out-the-vote drives ever achieve; indeed, no other election reform promises comparable gains in participation.  

All cities took an off-cycle hit, no matter size, urban or rural location, demographics 

As remarkable as the size of the penalty was its universality. As shown in Figure 1, not a single mid-sized or large municipality came close to matching its 2022 turnout in 2021.1Figures 1 and 2 cover municipalities of 10,000 or more voting-age residents. Sightline analyzed all municipalities of fewer than 10,000 voting-age residents as well. In every one of these municipalities for which data were available (143 of 208) turnout also increased from November 2021 to November 2022 (see accompanying spreadsheet).
Even the smallest penalty was fully 18 percent, in Anacortes in Skagit County. The largest penalty was a whopping 53 percent, in southern King County’s Covington. Stated in the inverse, Covington’s 2022 turnout was more than twice its 2021 turnout. (A complete list of Washington’s large and mid-sized cities with all their relevant data is in the appendix of this report, along with details of the methods Sightline used to compile and calculate them.) 

The size of the turnout penalty showed no pattern among cities. It doesn’t scale with city size, for example: the cities in Figure 1 are in descending rank by population yet show no correlation. Sightline tested for correlation with race or ethnicity and again found nothing. 

A small overstatement: Not accounting for down-ballot drop-off 

The turnout penalties in Figure 1 overstate in a small way and understate in a large way the potential increase in turnout that would come from election consolidation. They overstate because they are based on total ballots cast, not votes cast for local offices. Some of the voters who cast ballots in on-cycle federal and state elections leave blank the local races at the bottom of the ballot. Typically, this “down-ballot drop-off” is modest: 10 percent or less, according to Zoltan Hajnal of University of California, San Diego, the leading scholar of election timing in the United States.  

Meanwhile, Sightline analyses based on specific, contested local races, rather than total ballots cast, have demonstrated that Oregon’s on-cycle city and county elections nearly double the turnout of neighboring Washington’s off-cycle city and county elections. Just so, in a forthcoming analysis, Sightline shows that Wyoming’s on-cycle city elections roughly double the turnout of neighboring Idaho’s off-cycle city elections. 

A large understatement: Not comparing with presidential year turnout 

At the same time, the turnout penalties in Figure 1 dramatically understate turnout potential from election consolidation, because they are based on midterm elections rather than presidential ones. This effect swamps the effect of down-ballot drop-off.  

Calculated with respect to the 2020 presidential election, rather than the 2022 midterm, 2021’s off-cycle turnout penalty in large and mid-sized cities would have been not 36 percent but likely more than 50 percent. That is, down-ballot drop-off diminishes voter participation in city elections during on-cycle years by 10 percent or less, but off-cycle elections cost Washington cities 36 percent to more than 50 percent of their potential 2021 electorate.2Because redistricting after the 2020 census makes comparing November 2021 with November 2020 extremely complicated, Sightline compared November 2021 with November 2022 in all cities and other jurisdictions.
Down-ballot drop-off, furthermore, seems to be fairly consistent among voters of different demographic characteristics, such as race, ethnicity, and ideology, so it is likely to be a neutral factor on election outcomes. 


More than half a million WA voices weren’t counted in 2022 vs. 2021 

Expressed not as percentages but as numbers of missing votes, the turnout penalties show their scale. City elections in Seattle alone, for example, missed out on reflecting the preferences of almost 66,500 voters—people who voted in November 2022 but not in November 2021. Because of Seattle’s large population, this number is larger than the missed votes of the next two cities, Spokane and Tacoma, combined. This is true even though Seattle’s turnout penalty expressed as a percentage was 20 percent and those cities had turnout penalties around 40 percent.  

Figure 2 shows the number of missing votes in November 2021, compared with November 2022, in all of Washington’s large and mid-sized municipalities. Again, every single city missed votes in 2021, compared with its 2022 turnout, ranging from Seattle’s almost 66,500 to the roughly 500 voters who didn’t participate in Sunnyside, in Yakima County. Altogether, Washington’s large and mid-sized cities suffered the absence of 578,344 voters in 2021’s municipal elections who participated in the 2022 midterm election. 


Map 1 below reinforces the points: every city suffered a turnout penalty from off-cycle voting, and the size of the penalty varied across the state without regard to size or location. (You can click on cities to see their turnout penalty and details.) 

Map 1

Source: Map by Sightline Institute; GIS analysis by Ben Anderstone, Progressive Strategies NW; data from US Census Bureau, WA Sec. of State, county election administrators. View a full, interactive version of map.

Every legislative district enjoyed an on-cycle turnout bonus 

On the flip side of all that loss is a whole lot of gain when jurisdictions can piggyback on the turnout of an on-cycle, or even-year, election—the “turnout bonus.” Sightline calculated this figure for each of the state’s 49 legislative districts, as shown in Figure 3.  

The turnout bonus is the increase in ballots cast in the 2022 on-cycle general election (which included Congressional, state, and most county races3In Washington, all county elections are on cycle except those in King, Snohomish, and Whatcom Counites, and King is now phasing in a switch to on-cycle elections.
) over those cast in the 2021 off-cycle general election in the same district (which included city and other local races, such as school boards, plus statewide advisory votes). For example, voters in the 31st legislative district, which includes Bonney Lake and environs, cast 37,156 ballots in 2021’s off-cycle election and 66,482 ballots in the 2022 on-cycle election. That’s a 79 percent increase, or an on-cycle turnout bonus of 79 percent. 

Legislative districts (LDs) cover all voters in the state, including those in rural, unincorporated areas, rather than just those who reside in areas incorporated into a municipality, and the results are just as striking as for cities. The average LD turnout boost from on-cycle elections was massive: 62 percent statewide. The turnout boost reflects 1.2 million additional ballots cast, with turnout rising from 1.9 million in November 2021 to 3.1 million in November 2022. 


A repeated understatement: Not comparing with presidential year turnout
 

As for cities, so for LDs: even this 62 percent statewide increase is an understatement of the true turnout bonus that comes from on-cycle elections, because it compares an off-cycle year with a midterm rather than a presidential year.  

Washington recorded 4.1 million ballots in the presidential election of November 2020; in 2022’s midterm, the figure fell to 3.1 million. Comparing 2021’s 1.9 million ballots cast with the average of 2020 and 2022 turnout shows a statewide turnout bonus of 92 percent from on-cycle elections—almost half again as high as the 2022 statewide figure of 62 percent. 

All LDs saw a turnout boost, no matter size, urban or rural location, competitive local races, or demographics 

LD turnout boosts were ubiquitous, just like city turnout penalties. Voter turnout increased from 2021 to 2022 in every single legislative district. That is, in none of the 49 legislative districts in the state did voter turnout decrease from 2021 to 2022. Turnout rose even in places, such as the city of Seattle, that had hotly contested mayoral elections in 2021 and few contested races in 2022. 

The largest turnout boost was 127 percent in the 29th legislative district, a compact area stretching from the south end of Tacoma to Spanaway. There, municipal, school board, and other elections in 2021 only drew ballots from 17,134 people who lived in the precincts of the 29th LD. In 2022, those same precincts cast 38,908 ballots. 

The smallest turnout boost was 8 percent, in the 43rd LD in central Seattle. In fact, five of the six smallest turnout boosts were in Seattle legislative districts. The explanation for this pattern might be that November 2021’s ballot included contested races for Seattle mayor and at-large city council seats, while 2022’s ballot in Seattle was a sleepy affair with few competitive races in state or national elections. 

As for cities, so too for LDs: the turnout bonuses were not correlated in any important way with anything else Sightline could identify. They did not correlate with the district’s partisanship, population density, or race and ethnicity. And they showed no particular geographic pattern, as illustrated in Map 2. 

Map 2

Source: Map by Sightline Institute; GIS analysis by Ben Anderstone, Progressive Strategies, NW; data from US Bureau of Census; WA Sec of State; county election administrators. View a full, interactive version of the map.


Just so, the number of additional ballots cast in 2022, compared with 2021, was large and positive in every legislative district. Map 3 shows the scale of these extra ballots in the size of the square for each legislative district. The extra ballots were unrelated to the political party of each district’s legislative delegation, shown by the squares’ colors.  

Map 3

Source: Map by Sightline Institute; GIS analysis by Ben Anderstone, Progressive Strategies, NW; data from US Bureau of Census; WA Sec of State; county election administrators. View a full, interactive version of map. 

Bigger turnout, bigger support for winners? 

The upshot of the data seems to be that on-cycle elections would dramatically boost participation in democracy, without obviously favoring any particular constituency, party, region, or type of community—at least, none that Sightline has been able to measure. This stronger participation might enhance city leaders’ legitimacy and give them stronger mandates to lead. 

Looking at cases suggests the same conclusion: legislative leaders have vastly more supporters than do the mayors and councilors in their districts, and that’s true without regard to party or place. 

Laurie Jinkins, the Speaker of the House and a Democrat, represents the 27th district in central Tacoma, where the turnout bonus was 78 percent. That means that she and her Democratic colleagues Senator Yasmin Trudeau and Representative Jake Fey all faced 2022 electorates 78 percent larger than did their counterparts running for Tacoma mayor or district city council seats in the same precincts in 2021—a more challenging prospect, no doubt, but also a more representative share of the public and, therefore, a much stronger mandate to govern. Nearby, in and around Bonney Lake in the 31st district, Republican House Minority Leader Drew Stokesbary had the benefit of an electorate 79 percent larger than the one that chose the mayor and council of Enumclaw. Thus, the leaders of the respective parties in the Washington State House of Representatives come from districts with nearly matching on-cycle turnout bonuses. 

On the senate side of the state capitol, the coincidence repeats. Senate majority leader and Democrat Andy Billig represents the 3rd district in Spokane, which saw a more than doubling of turnout from 2021 to 2022—an on-cycle bonus of 115 percent. Senate minority leader John Braun comes from the 20th district, the environs of Centralia and Chehalis, which returned 107 percent more ballots in 2022 than the previous year. 

All of these leaders, therefore, face electorates that are very roughly twice as large as the electorates that choose the city leaders from their districts, and that turnout boost only grows when you factor on-cycle presidential elections into the equation. 

Other examples abound. 

Democratic State Senator Patty Kuderer, for example, represents part of the area between Lake Washington and Lake Sammamish. In 2022, when she won reelection, turnout in her 48th LD was 48,500 voters. The previous year, in 2021, when half of the city council seats were on the ballot in Bellevue, Kirkland, and Redmond, the principal cities that overlap with her district, only 33,600 voters cast ballots. In other words, she faced an electorate 44 percent larger than did the city leaders in her district. 

Shelly Short is a Republican senator in the 7th district, which stretches from the Methow Valley across the northern tier of the state to Idaho. She is such a friend to Washington cities’ legislative agenda that their association gave her an award in 2021. One way to help them more would be to help give East Wenatchee and other cities in her district the freedom to increase their voter turnout by the on-cycle bonus, which was 66 percent in her district when she was reelected in 2022. 

Senator Claire Wilson and her Democratic colleagues in the 30th district faced 71 percent more voters than did their municipal counterparts running for office in her LD’s cities of Federal Way, Auburn, and Des Moines. 

Next door, in the 33rd district, Senator Karen Keiser and Representatives Mia Gregerson and Tina Orwall, all Democrats, won reelection in 2022 in a year with 69 percent more voters than turned out to vote the previous year in the overlapping city council districts of SeaTac, Burien, Des Moines, and Kent.  Representative Gregerson, at least, has been trying to do something about it: she’s sponsored a bill to consolidate local elections with federal ones in Washington in each of the past four years. 

Giving cities the option to consolidate elections—and voters greater likelihood of voting 

Decades of familiarity have inured many people to the size and universality of turnout penalties and bonuses. The scale of these penalties and bonuses dwarfs almost all other factors that influence turnout. And the source of the penalties and bonuses is state law. In Washington, state law sets the date for municipal elections as November of odd-numbered years.  

This 1963 policy yields an imbalanced pattern of voting. State legislators run in years with large electorates. These larger electorates, according to academic research, tend to be a better match for the overall public than are small electorates: especially by age but also by race, ethnicity, and ideology. High-turnout on-cycle elections, other research shows, dilute special interest influence and improve accountability by ensuring that elected officials align with the values and beliefs of the majority of their constituents. City officials, meanwhile, run in low-turnout elections, facing less representative electorates dominated by older, whiter voters, including many homeowners.4 These representation effects are not visible in this report’s findings. Statistically, they would not be expected to be visible, given the size of the dataset and that Sightline examined the demographic composition of whole cities and LDs rather than the composition of the electorate that actually voted. The largest representation effect in other studies has been age, which Sightline did not examine in this study.
 

Like Arizona, California, and Nevada, though, Washington can release cities to move elections at their own discretion. Giving them that option would let cities shed the penalties of off-cycle elections and seize the turnout bonuses from moving local races onto the federal election ballot. 


Thank you to Ben Anderstone for data and GIS analysis, Jay Lee for statistical analysis, Todd Newman for research support, Zoltan Hajnal for review comments, Kate Macfarlane and Webster Chang for mapping and layout, and Devin Porter of Good Measures for graphic design. 

Appendix: Methods and data 

Sightline commissioned Seattle-based election analyst Ben Anderstone of Progressive Strategies NW to assemble complete voter turnout data for every precinct in the state for the 2021 and 2022 November general elections. He used Census Bureau voting-age population estimates and demographic estimates by ethnicity and race. He used voting records from the Washington Secretary of State and county election administrators. Ben aggregated the precincts to match the state’s 49 new, post-2020 legislative districts (LDs). He then calculated total ballots cast per voting-age resident of the district. By doing this, he provided a way to look at how the same voters responded to opportunities to vote for local and state/national candidates in every part of the state of Washington during a two-year period.  

Sightline also recorded the party identification of the delegations in all 49 legislative districts. Washington has uniform party membership among the delegations of almost all of its districts in 2023, but in the few rare exceptions, we identified the district’s partisanship based on the majority of the three legislators in each district, one senator and two representatives. Two of either party labeled the district as with that party. 

Sightline considered whether every precinct had elections in November of 2021 and 2022, and concluded that all did. Washington conducts statewide general elections in November of each year and, in November 2021, conducted statewide advisory votes. Thus, every active registered voter in the state would have received a ballot in that election, as in the November 2022 general election. In addition, every precinct in the state is part of a school district, even if it is in neither a municipality nor any other off-cycle local voting district: port, irrigation, public utility, surface water management, etc. Further, in 2021, three Washington counties conducted November 2021 general elections: King, Snohomish, and Whatcom. All other counties have on-cycle elections, and King County adopted an election consolidation charter amendment in 2022 that will phase out off-cycle elections over the years ahead. 

For the same two November elections, Ben Anderstone also aggregated precincts for all of Washington’s incorporated municipalities (cities and towns), though data were not readily available for some of the smallest towns. Finally, he aggregated data for each city council district in Washington cities that have such districts. 

To calculate turnout, we used not ballots cast as a share of registered voters but ballots cast as a share of voting-age population. This method helps to correct for the wide range of voter registration rates and their variation from year to year. One weakness with the method is that voting-age residents of a jurisdiction may not all be eligible to vote, because of citizenship status or felony convictions, for example. It also fails to reflect changes in population from 2021 to 2022. Still, Sightline used voting-age population as a more-consistent denominator for turnout than voter registrations. 

Sightline’s methods for calculating turnout penalties and bonuses look only at the increase, rather than the levels, of turnout, because it seeks to understand how turnout might change overall were local elections consolidated with federal elections. As indicated in the data tables accompanying this article, turnout varies widely among jurisdictions. Among legislative districts, in 2022, it ranged from 23 percent of voting-age population in the 15th LD near Yakima and Pasco to 63 percent in the 24th LD on the Olympic Peninsula. Among cities in 2021, it ranged from 11 percent in Sunnyside, near Yakima, to 59 percent in Anacortes, in Skagit County. 

To examine relationships between turnout penalties and bonuses, populations, population density, and race/ethnicity, Sightline Senior Research Associate Jay Lee conducted statistical tests of correlation using the software tool R. He also checked correlations with partisanship of the district, using as an indicator of partisanship the 2022 percent vote share of US Senator Patty Murray, a Democrat. 

One way to improve this method would be to add more off-cycle and on-cycle elections. Turnout varies considerably over time, depending on voters’ perceptions of the stakes in each election. So comparing only one on-cycle with one off-cycle election yields results more indicative than predictive. Counteracting this flaw is the conservatism Sightline employed by comparing off-cycle turnout with a midterm year, when turnout is much lower than in a presidential year. 

Turnout bonuses by legislative district

Washington Legislative District (LD)Location of district, principal citiesSenator, Rep 1, Rep 2 (2023)2023 Party of majority of district delegationLD Voting-age population (2020)Nov. 2021 general election ballots castNov. 2022 general election ballots cast2021 turnout (ballots cast/voting-age population)2022 turnout (ballots cast/voting-age population)2022 on-cycle turnout bonus (2022 turnout, as percent increase over 2021 turnout)
1Bothell, Lake Forest Park, KenmoreStanford, Duerr, KlobaD122,25239,36969,62232%57%77%
2Yelm, Pierce countyMcCune, Barkis, WilcoxR117,68429,44657,83225%49%96%
3SpokaneBillig, Riccelli, OrmsbyD125,23028,79761,85823%49%115%
4Spokane ValleyPadden, Schmidt, ChristianR121,88940,95366,71434%55%63%
5Issaquah, Sammamish Mullet, Ramos, CallanD116,38846,17672,31540%62%57%
6SpokaneHoly, Volz, GrahamR122,03140,94661,08534%50%49%
7northeast corner of stateShort, Maycumber, KretzR122,70241,79669,54834%57%66%
8Tri-citiesBoehnke, Barnard, ConnorsR114,87839,09359,55634%52%52%
9Pullman, southeast stateSchoesler, Dye, SchmickR128,00331,90267,04925%52%110%
10Mount Vernon areaMuzzall, Shavers, PaulD126,07150,59175,85040%60%50%
11Renton, Tukwila, KentHasegawa, Hackney, BergquistD123,86728,07948,17223%39%72%
12Monroe to WenatcheeHawkins, Goehner, SteeleR123,02440,88369,57233%57%70%
13Ellensburg, Moses Lake, central stateWarnick, Dent, YbarraR117,96333,97055,49529%47%63%
14Yakima, south central stateKing, Corry, MosbrucknerR116,36332,33448,19428%41%49%
15Pasco to YakimaTorres, Chandler, SandlinR105,37819,06323,71218%23%24%
16Kennewick to Walla WallaDozier, Klicker, RudeR119,29628,45255,98324%47%97%
17Vancouver to CamasWilson, Waters, HarrisR120,31832,86671,04327%59%116%
18Unincorporated Clark CountyRivers, McClintock, CheneyR119,53947,28266,36140%56%40%
19Aberdeen and environsWilson, Waters, McEntireR125,14037,92165,46630%52%73%
20Centralia, ChehalisBraun, Abbarno, OrcuttR119,69635,30672,91229%61%107%
21Edmonds, Everett, LynnwoodLiias, Peterson, Ortiz-SelfD124,22334,23458,26228%47%70%
22OlympiaHunt, Doglio, BatemanD124,66743,84469,19835%56%58%
23Bainbridge, BremertonHansen, Simmons, NanceD125,08243,01272,34134%58%68%
24Aberdeen, Port Angeles, Port TownsendVan De Wege, Chapman, TharingerD131,60951,15182,59939%63%61%
25PuyallupGildon, Chambers, JacobsenR119,28528,50257,33424%48%101%
26Bremerton, Gig HarborRandall, Hutchins, CaldierR125,36444,47876,17235%61%71%
27TacomaTrudeau, Jinkins, FeyD127,32733,30759,34026%47%78%
28Lakewood, University Place, TacomaNobles, Leavitt, BronoskeD120,74729,87147,16425%39%58%
29Tacoma, LakewoodConway, Moran, MenaD118,57317,13438,90814%33%127%
30Federal Way, Des MoinesWilson, Taylor, ReevesD120,03125,16842,96321%36%71%
31Bonney Lake, EnumclawFortunato, Stokesbary, RobertsonR118,81837,15666,48231%56%79%
32Mountlake Terrace, ShorelineSalomon, Ryu, DavisD127,12838,16766,09030%52%73%
33Burien, Seatac Keiser, Orwall, GregersonD122,93326,82145,25522%37%69%
34West Seattle, VashonNguyen, Alvarado, FitzgibbonD127,97855,49071,00543%55%28%
35Lacey, SheltonMacEwen, Griffey, CoutureR126,75341,43675,87833%60%83%
36Seattle (Ballard, Queen Anne)Frame, Reed, BerryD133,53867,18480,74750%60%20%
37southeast SeattleSaldaña, Santos, StreetD129,01048,65561,07738%47%26%
38EverettRobinson, Cortes, FosseD122,63427,20652,52522%43%93%
39Granite Falls, Lake Stevens, Granite FallsWagoner, Low, EslickR119,25736,18566,13730%55%83%
40Anacortes, Bellingham, Mt. VernonLovelett, Lekanoff, RamelD128,37350,58377,86839%61%54%
41Bellevue, Mercer IslandWellman, Senn, ThaiD119,16843,76565,84037%55%50%
42Blaine, BellinghamShewmake, Rule, TimmonsD123,43352,43875,96142%62%45%
43Central SeattlePedersen, Macri, ChoppD145,45159,59064,12341%44%8%
44Mill Creek, EverettLovick, Donaghy, BergD117,38739,49264,14234%55%62%
45Kirkland, RedmondDhingra, Goodman, SpringerD118,35641,72667,38135%57%61%
46northeast Seattle Valdez, Pollet, FarivarD131,44259,27872,42145%55%22%
47KentKauffman, Entenman, StearnsD119,57728,59550,82524%43%78%
48Bellevue, RedmondKuderer, Slatter, WalenD125,22333,61048,51727%39%44%
49Vancouver Cleveland, Wylie, StonierD123,34028,97052,79223%43%82%
Total6,024,4191,892,2733,067,68631.4%51%62%

Turnout penalties by city

CityVoting-age Population (2020)Nov. 2021 general election ballots castNov. 2022 general election ballots cast 2021 turnout (ballots cast/voting age- population)2022 turnout (ballots cast/voting-age population)2021 off-cycle turnout penalty (2021 turnout, compared with 2022)2021 Missing Votes (2022 ballots cast less 2021 ballots cast
Seattle 630,174 267,414 333,912 42%53%-19.9% 66,498
Spokane 180,961 52,475 86,468 29%48%-39.3% 33,993
Tacoma 175,227 42,768 74,666 24%43%-42.7% 31,898
Vancouver 150,427 34,569 66,916 23%44%-48.3% 32,347
Bellevue 120,263 33,124 49,993 28%42%-33.7% 16,869
Kent 104,299 20,652 35,880 20%34%-42.4% 15,228
Everett 87,826 18,636 33,994 21%39%-45.2% 15,358
Renton 84,351 17,697 32,551 21%39%-45.6% 14,854
Spokane Valley 80,043 21,791 39,021 27%49%-44.2% 17,230
Bellingham 77,879 30,018 43,276 39%56%-30.6% 13,258
Federal Way 77,734 16,353 27,047 21%35%-39.5% 10,694
Kirkland 73,177 21,684 37,975 30%52%-42.9% 16,291
Yakima 70,824 15,160 23,307 21%33%-35.0% 8,147
Auburn 65,153 12,503 24,028 19%37%-48.0% 11,525
Kennewick 61,193 16,154 25,642 26%42%-37.0% 9,488
Redmond 55,799 12,748 21,430 23%38%-40.5% 8,682
Marysville 53,415 13,153 24,343 25%46%-46.0% 11,190
Pasco 52,034 8,713 16,867 17%32%-48.3% 8,154
Lakewood 50,020 9,689 17,853 19%36%-45.7% 8,164
Sammamish 47,390 16,067 27,342 34%58%-41.2% 11,275
Shoreline 47,336 15,605 26,807 33%57%-41.8% 11,202
Richland 45,933 16,727 25,559 36%56%-34.6% 8,832
Olympia 44,806 16,505 24,758 37%55%-33.3% 8,253
Lacey 41,438 11,152 20,261 27%49%-45.0% 9,109
Burien 41,413 12,502 17,702 30%43%-29.4% 5,200
Bothell 37,573 12,223 20,042 33%53%-39.0% 7,819
Edmonds 35,484 15,857 23,457 45%66%-32.4% 7,600
Bremerton 35,482 8,387 13,140 24%37%-36.2% 4,753
Puyallup 33,685 9,917 16,878 29%50%-41.2% 6,961
Lynnwood 31,071 7,405 13,231 24%43%-44.0% 5,826
Issaquah 30,672 9,010 16,215 29%53%-44.4% 7,205
Longview 29,595 8,193 13,409 28%45%-38.9% 5,216
Pullman 28,582 4,457 7,717 16%27%-42.2% 3,260
Walla Walla 27,272 8,270 11,930 30%44%-30.7% 3,660
Wenatchee 27,247 8,559 12,716 31%47%-32.7% 4,157
University Place 26,929 8,376 14,811 31%55%-43.4% 6,435
Mount Vernon 26,472 6,866 11,854 26%45%-42.1% 4,988
Des Moines 26,030 7,334 11,375 28%44%-35.5% 4,041
Lake Stevens 25,516 8,921 15,198 35%60%-41.3% 6,277
SeaTac 24,740 4,772 6,978 19%28%-31.6% 2,206
Bainbridge Island 19,826 11,247 16,139 57%81%-30.3% 4,892
Tumwater 19,775 6,251 11,159 32%56%-44.0% 4,908
Mercer Island 19,711 9,899 13,358 50%68%-25.9% 3,459
Maple Valley 19,297 8,263 11,771 43%61%-29.8% 3,508
Kenmore 18,694 6,406 10,942 34%59%-41.5% 4,536
Camas 18,548 8,273 12,910 45%70%-35.9% 4,637
Oak Harbor 18,278 4,193 6,605 23%36%-36.5% 2,412
Moses Lake 18,088 4,622 6,465 26%36%-28.5% 1,843
Mountlake Terrace 17,350 4,315 8,622 25%50%-50.0% 4,307
Tukwila 17,220 3,336 5,135 19%30%-35.0% 1,799
Mukilteo 17,091 7,871 10,158 46%59%-22.5% 2,287
Mill Creek 16,548 5,119 8,656 31%52%-40.9% 3,537
Bonney Lake 16,530 5,004 8,801 30%53%-43.1% 3,797
Port Angeles 16,169 6,518 8,992 40%56%-27.5% 2,474
Covington 15,610 3,786 7,990 24%51%-52.6% 4,204
Ellensburg 15,530 3,826 6,536 25%42%-41.5% 2,710
Monroe 15,129 3,575 6,345 24%42%-43.7% 2,770
Battle Ground 15,113 4,970 8,421 33%56%-41.0% 3,451
Arlington 14,782 3,631 7,457 25%50%-51.3% 3,826
Anacortes 14,517 8,515 10,360 59%71%-17.8% 1,845
Centralia 13,881 3,274 5,727 24%41%-42.8% 2,453
Aberdeen 13,054 2,895 4,765 22%37%-39.2% 1,870
Washougal 12,905 4,279 7,173 33%56%-40.3% 2,894
Port Orchard 11,980 3,355 5,900 28%49%-43.1% 2,545
West Richland 11,634 5,100 7,523 44%65%-32.2% 2,423
Lynden 11,547 5,671 7,966 49%69%-28.8% 2,295
Cheney 11,226 1,692 3,112 15%28%-45.6% 1,420
Ferndale 11,185 4,152 6,677 37%60%-37.8% 2,525
Lake Forest Park 10,877 5,966 7,835 55%72%-23.9% 1,869
Sunnyside 10,626 1,119 1,670 11%16%-33.0% 551
East Wenatchee 10,557 2,857 4,793 27%45%-40.4% 1,936
Woodinville 10,248 3,415 5,910 33%58%-42.2% 2,495
Newcastle 10,202 3,489 5,212 34%51%-33.1% 1,723
Washington State 6,062,910 1,873,617 3,067,686 31%51%-38.9% 1,194,069
Total for cities in this list 3,459,193 1,049,290 1,627,634 30%47%-35.5% 578,344

Micro-housing: It’s Not about the Size but How You Use It

Find audio versions of Sightline articles on any of your favorite podcast platforms, including Spotify, Google, and Apple.

Editor’s note: Guest author David Neiman is a principal at Neiman Taber Architects, where he is deeply involved in micro-housing as an architect, developer, and proponent in the public policy sphere. His firm works to create plentiful, high-quality, small unit housing, designed to support livability and promote community among residents. 

I’ve spent much of the last decade designing and developing micro-housing projects in Seattle. I’ve also become deeply involved in local and state policy debates around regulating this type of housing. During this time, I’ve witnessed a shift in how micro-housing is viewed and managed: beginning as a novelty and quickly evolving from a developer’s workaround to the neighborhood advocates’ nightmare, to the politicians’ headache and the bureaucrats’ bogeyman, all the while being slowly driven towards extinction by over-regulation. 

Despite this, and over the din of the loudest voices at the political extremes, I’ve seen a consensus emerge in policy circles recognizing that micro-housing is one of the simplest and most straightforward ways to put more homes into a housing market that is simply starving for them. It’s also one of the most effective ways to give people of modest means the opportunity to live in desirable neighborhoods with access to jobs, services, education, amenities, arts, culture, and an overall high quality of life. 

At all levels of government, politicians and policymakers are looking for ways to promote more of this type of housing. But they stumble on the question of “how small is too small,” where to look for guidance, and how to develop appropriate regulations that govern the size of micro-housing. Below I share key resources to inform this conversation, as well as a number of designs to help leaders envision how these homes could look and feel for the many neighbors who need them. Spoiler alert: A well designed studio apartment can be a lot smaller than most people think. 

Building codes over zoning codes; Or, health and safety over opinions 

First things first: it’s important to differentiate between building codes and zoning codes. Building codes regulate unit size by directly specifying minimum square footage of the floor area. Zoning codes take a more circumspect approach, using density limits, parking requirements, and per unit amenities that indirectly govern housing size.  

For the purposes of this article, we will ignore zoning codes, which are inherently political documents that vary from city to city. Instead, we’ll focus on the International Building Code (IBC), which is used in all 50 US states. It has a narrower mandate, which is simply (but importantly) to protect public health and safety and to safeguard against hazards in the built environment. While in practice, the ultimate rationale for a zoning code provision can be merely “because I said so,” the building code is supposed to have an empirical justification and so can be evaluated on that basis. 

The IBC regulates housing size by dictating the minimum size of “habitable” rooms. For instance, a studio apartment requires a 190-square-foot living room. Additionally, the IBC mandates that a kitchen, a bathroom, and a storage closet be provided. Combining those elements with the code-required circulation and accessibility clearances, a studio apartment’s minimum size usually ends up at about 300 square feet.1This measurement refers to the interior “paint-to-paint” dimensions of the apartment. The measurement method commonly used for listing apartment sizes, known as BOMA, includes wall thickness and typically results in a measurement about 10 percent higher.
 

A 300-square-foot studio apartment is by no means luxurious, but smaller apartments are quite common, and I would guess that most of us have lived in smaller spaces at one time or another. In Seattle, a 300-square-foot studio rents for approximately $1,600 per month, making it affordable for people earning around $64,000 annually. That’s fine if you can afford it, but nearly half of Seattle’s renters can’t afford to pay that much for rent 

To serve these neighbors, either we need to build housing that is smaller and more affordable than what conventional development can deliver, or we need to provide subsidized housing to a large percentage of our population. Realistically, our present social safety net can’t even provide for our most vulnerable populations, let alone people who are fully employed but simply earn a modest salary. This is where micro-housing can play a crucial role. 

Imagining a new micro-housing norm 

Of Cascadia’s major cities, I’m most familiar with Seattle, which has been a national leader in micro-housing. In recent years the city has built thousands of micro-homes in various forms. One type is a smaller studio apartment that Seattle calls a Small Efficiency Dwelling Unit (SEDU). This type of housing has been legal for over 20 years, offering residents smaller and more affordable alternatives to traditional studios. 

Housing advocates in Washington are working on legislation this year to legalize this kind of small studio apartment throughout the state. But to get there, legislators and policymakers first need to understand that this type of housing is humane, safe, and dignified. To show that, let’s compare what the code allows today to some smaller, more affordable alternatives. 

Status quo: Today’s typical micro-housing studio 

Here is what a typical 300-square-foot studio apartment plan looks like (see Figure 1). It features a 190-square-foot living room, which accommodates a bed, a couch, and a small dining area. Additionally, there’s a compact kitchen, a storage closet, and a bathroom.  

If you’re a developer aiming to provide the most homes at the lowest cost, your goal is to reduce the unit size to get the most units possible into a floorplate. Under current rules, you can’t reduce the living room below 190 square feet, and accessibility codes mandate a minimum bathroom size, typically 5 feet by 8 feet. To squeeze in more units per floor, the only option is to shrink the kitchen and storage space to the bare minimum. Here is a plan of what that looks like. 

Figure 1: A mandated 190-square-foot living room in a 300-square-foot home reduces kitchen and storage spaces to their absolute minimums. Image by Neiman Taber Architects.

Status evolved: More livability, less living room 

Now let’s try a different approach. From a livability perspective, empty floor space is probably the least important feature that a person needs in their home.  

In this redesigned plan of the same unit, we’ve increased the kitchen size, providing more countertop workspace, additional storage and cabinets, a washer-dryer unit, a desk, and bookshelves. There’s still enough room for furniture, but by trading some living room area for more practical built-in features, we’ve created a significantly more comfortable home. And the total unit size is still 300 square feet. 

Figure 2: A revised design with a 140-square-foot living room in a 300-square-foot home increases kitchen counter space and adds more storage space, built-in furniture, and even a washer-dryer. Image by Neiman Taber Architects.

Use the slider below to compare the two designs: the first with its 190-square-foot living room and the second with its 140-square-foot living room—and added kitchen counter space, storage space, built-in furniture, and even a washer-dryer. Which would you prefer to live in? 

These two plans demonstrate a simple point: If you’re trying to design a building code to make a small unit more livable, forcing the living room to be larger is the wrong approach. Unfortunately, this is exactly what the IBC does. 

The origins of the IBC’s 190-square-foot living room mandate 

It’s worth a moment to discuss where the requirement for a 190-square-foot living room comes from. It’s not a universally accepted number. Until the 2018 IBC code update, the minimum standard for a living room was 220 square feet. Seattle’s SEDU standards allow for a 120- to 150-square-foot living room, depending on how you measure it. The IBC also allows congregate housing units—i.e., where residents have a private bedroom but share things like a kitchen, dining room, and other common spaces—with living spaces as small as 70 square feet. These are all forms of permanent housing meant for use by the general public, yet the size requirements vary widely.  

A skeptical observer might wonder if these square footage requirements have any empirical basis or are merely arbitrary. A review of historical codes would prove the skeptic right. The Uniform Building Code, the predecessor to the IBC we use today, was first published in 1927. About two decades later in 1946, it introduced minimum room sizes, including an 80-square-foot living room. In 1964 the requirement grew to 90 square feet. In 1973, the requirement suddenly more than doubled to 220 square feet 

The square footage minimums do not stem from a long tradition nor any particular health or safety principle. The fact that today’s standard arrived suddenly in the early 1970s likely has more to do with urban politics of the day. At that time, most American cities were in decline, losing their population and tax base to the suburbs and struggling with high crimes rates. In reaction, many cities enacted policies aimed at getting rid of small, low-cost housing types like SROs where poor people lived.  

Another way: Public health-informed priorities and sizing 

Public health experts have long acknowledged that the built environment heavily impacts human health. The National Healthy Housing Standard (NHHS), developed by public health professionals, serves as a tool for planners, elected officials, and policymakers to design regulations for housing that are based on the public health literature.2Document pages 30–33 specify kitchen, bathroom, and minimum space recommendations.
  

So what does the NHHS standard recommend for minimum living room sizes? A mere 70 square feet. However, this is not the end of the story. While the IBC focuses primarily on living room size, the NHHS gives more attention to subjects such as cleanliness, adequate storage, and functional food preparation. 

For example, the NHHS stipulates the need for a kitchen with both a range top and oven, a refrigerator and a freezer, and a designated space for utensils and cooking tools. It also requires a kitchen to have a washable backsplash and cleanable floors. In contrast, the IBC remains mostly silent on these matters, requiring only a microwave oven, a sink, and a mini-fridge. 

Another example: The NHHS mandates the use of low-pile carpets, non-absorbent flooring, low-VOC finishes, and other requirements aimed at providing cleanable surfaces and healthy indoor air quality. The IBC is silent on these matters. 

In general, if we look to the IBC as a guide for designing micro-homes, we end up with larger and more expensive housing units than necessary, often lacking important livability features. In contrast, the NHHS permits smaller and more efficient homes but demands other essential amenities for livability, well-being, and sanitation. 

What would a better micro-home look like? 

At this point we’ve established a few things.  

  1. The current standards are somewhat arbitrary. 
  2. Living room size is not a reliable measure of livability. 
  3. A better standard would focus much less on unit size and more on design elements that support healthy lifestyles.  

Clearly, we can build humane, quality housing smaller than what the IBC code allows today, but the question remains: how small is too small? Below are floor plans for micro-homes with living rooms of 120, 95, and 70 square feet in 250-, 220-, and 200-square foot units respectively—and plenty of space for living well in each.  

The 120 in a 250: A Seattle SEDU-compliant option 

Figure 3: A 250-square-foot studio that is Seattle SEDU-compliant. With a 120-square-foot living room, it can’t accommodate both a bed and couch in the living space. Image by the Neiman Taber Architects.

We’ll begin with a small studio along the lines of what Seattle allows for a Small Efficiency Dwelling Unit (SEDU). It complies with all of Seattle’s regulations, including some of the city’s idiosyncratic rules about countertop areas, storage configuration, and how to measure the living room.  

In total, this SEDU measures 250 square feet. At this scale there is room for a basic kitchen, bathroom, and storage area, plus the minimum required 120-square-foot living room. The living room area can comfortably fit a dining room table plus one more large piece of furniture. Unlike the larger 300-square-foot studio in Figures 1 and 2, we don’t have enough space for both a couch and a bed, so we opted for a convertible sofa that can serve both purposes. 

The 90 in a 220: More kitchen and storage, plus a washer-dryer 

Figure 4: A 220-square-foot SEDU variation, with a smaller living room and more kitchen space, storage, and even a washer-dryer. It complies with Seattle’s SEDU rules for total square footage but not living room square footage. Image by Neiman Taber Architects.

This design is a variation on the SEDU. It meets the city’s minimum total square footage for a Seattle SEDU, but it dispenses with the city’s living room size minimum. (The design also meets the minimum requirement for a small studio under a similar program in San Francisco.) 

This is the scale of unit that was typical for SEDUs in Seattle before 2016, when building officials enacted a series of code interpretations that changed the way that habitable space is measured, requiring a larger living room area. Compared to the slightly larger unit and living room above, here we can still fit the same suite of furniture, but also a larger kitchen, a more useful storage area, and a washer-dryer. For comparison, this living room is about 95 square feet, so losing just less than a quarter of the living room space of the prior design. 

The 70 in a 200: NHHS-approved, with handy built-ins, more kitchen and storage, plus washer-dryer 

Figure 5: A 200-square-foot micro-home with a 70-square-foot living room boasts more kitchen and storage space, plus a handy built-in bookshelf, all compliant with the National Healthy Housing Standard. Image by Neiman Taber Architects.

The NHHS says that the minimum habitable space for a dwelling unit’s living room is 70 square feet. So let’s look at what that accomplishes in terms of the overall unit size and layout 

We’ve kept a similar suite of amenities in the kitchen and bathroom as the prior design, meaning more kitchen countertop and storage, plus a washer-dryer. And with only 70 square feet of living room area, there’s still enough room for a sleeper sofa and dining table, plus we’ve increased the functional use of the room with a built-in bookshelf. It’s cozier than the versions with larger living rooms but still a functional home that serves a person’s basic needs well and comfortably. The overall size of this unit comes out to just over 200 square feet. 

Policymakers should prioritize livability and an abundance of housing options 

The IBC standards that we use today to regulate small unit housing are clearly counterproductive. They prohibit the creation of smaller, more affordable units that could help put a dent in our housing crisis, and they prioritize space over livability, functionality, and cleanliness.  

If lawmakers have concerns about the livability of small units, they should look to the standards of the NHHS for guidance. Current living room requirements have no empirical basis; they make our housing less plentiful and more expensive; and contrary to their intent, they result in less functional housing units with fewer amenities. It’s possible to make desirable homes for people far smaller than the size required by the IBC. The options we illustrated work well down to about 200 square feet.  

It’s possible to go even smaller. In our congregate housing projects, units can be as small as 120-150 square feet when the building also provides common kitchen, dining, and other amenities that supplement the private units. This illustrates a larger point, which is that beyond the basics, the specific features of the private unit are often less important than the quality of the environment in which they are situated. 

Likewise, micro-homes work best in neighborhoods that provide residents with easy access to amenities such as parks, grocery stores, libraries, schools, restaurants, retail, and services.  

Policymakers can unlock housing opportunities for thousands more people in Washington and across Cascadia by amending our state building code to reduce the minimum living room size, allowing builders throughout Washington to create plentiful, affordable homes for their communities.