
Think about coal miners and you probably envision old Americana images: soot-blackened union guys with picks slung over their shoulders. But the truth is, modern-day coal mining is highly mechanized and it employs relatively few workers, many of them non-union.
Consider the coal companies in the Powder River Basin that extract nearly 500 million tons of coal each year with just 7,000 workers. That’s nearly half of all the coal mined in the US each year and it works out to roughly 66,000 tons of coal for each worker, on average. It’s an astonishing display of the industrial efficiency deployed in strip mining-like techniques. Yet it also means that coal mining is a poor strategy to create jobs.
In fact, as economists at the University of Massachusetts’ Political Economy and Research Institute have shown, it’s hard to make a worse jobs investment than coal.
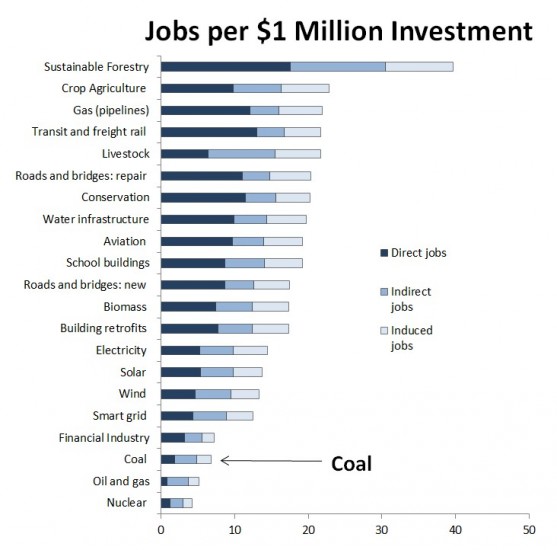
Nearly any other infrastructure investment produces more jobs than coal, even when you factor in the indirect jobs and other secondary jobs. It just doesn’t stack up.
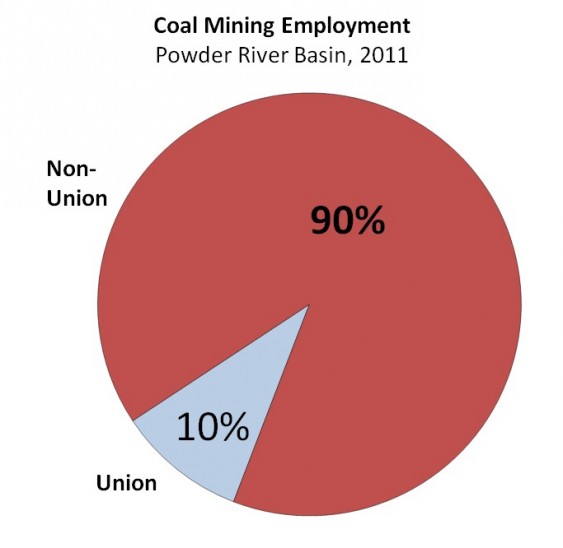
In the Powder River Basin—home to the coal planned for export to Asia via the Northwest—coal miners are overwhelmingly non-unionized.

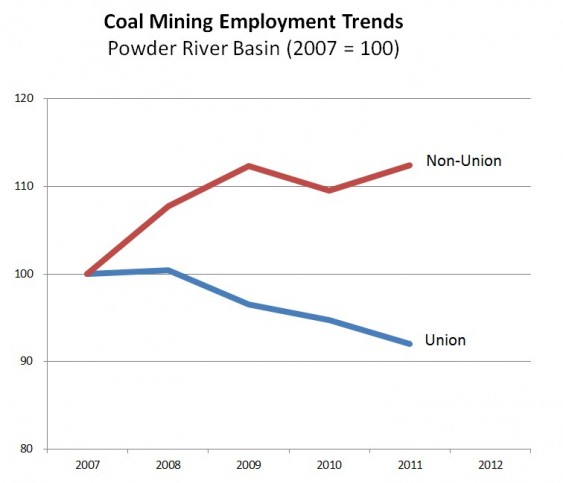
In fact, recent employment trends are moving away from union workers.

As the Northwest debates coal export proposals—and residents sort through competing claims about jobs and economics—it’s worth bearing in mind that western coal mining is simply not, by any measure, a job-intensive industry.
Notes and sources.
Chart 1, “Jobs Per $1 Million Investment” is by Sightline Institute using data from Heidi Garrett-Peltier and Robert Pollin, University of Massachusetts Political Economy and Research Institute. (Multipliers derived using IMPLAN 2.0 with 2007 data. Infrastructure multipliers and assumptions are presented in “How Infrastructure Investments Support the U.S. Economy: Employment, Productivity and Growth,” Political Economy Research Institute, January 2009.) For the sake of brevity, I shortened several of the investment category names; the full titles can be found here.
Charts 2 and 3, “Coal Mining Employment” and “Coal Mining Employment Trends” are by Sightline Institute using data from Table 20 of the US Energy Information Administration’s “Annual Coal Report 2011” published on November 8, 2012.
Thanks to Pam MacRae for research assistance.


Uncle Vinny
Wow! I tried to skim through that Infrastructure paper for clues on why sustainable forestry has such a huge job multiplier effect, but it’s not really skimmable. Do any of you have an idea why it’s so much more effective at creating jobs?
Eric de Place
I’m not sure, Vinny. I think you’d have to understanding the IMPLAN model to really know what they calculate those figures.
To be clear, I used the term “sustainable forestry” in the interest of concision, but their numbers actually refer to: “Reforestation, Land and Watershed Restoration, and Sustainable Forest Management.”
Lynne Wheeler
I have often thought about doing a video to show how many people are involved in getting a 2X4 to the customer. There are tree nursery workers, tree planters, timber cruisers, waste and residue surveyors, truck drivers, foresters, biologists, excavator operators, drillers, blasters, bridge builders, fallers, hoe-chuck operators, loader operators, buckers, second loaders, log sorter operators, scalers, foremen, administrative staff, helicopter and fixed wing pilots, boomboat operators, tug operators, and all the people working in the sawmill industry. I am sure I have left out many other important jobs. This doesn’t even count all the people in government like tenures foresters, stewardship foresters, appraisal staff, check scalers, compliance and enforcement staff, billing, sample administrators, and so many more. Sustainable forestry provides well paying jobs to thousands of British Columbians. It would provide even more if we didn’t export raw logs out of the province.
Alan Durning
One main driver, I believe, is the share of investment dollars that go to payroll expenses v. capital equipment. Oversimplified: Miners use multi-million dollar machines; foresters use hand tools and the occasional winch.
Maggie Paquet
To Alan Durning re “sustainable forestry”
Hand tools? You obviously do not live in the pacific northwest, where feller-bunchers and other heavy equipment chew through the forests at an alarming rate… or giant crane helicopters picking out the best old-growth and carting it away. Sure, loggers use chainsaws, but they no longer use swede saws, double-bladed axes, and oxen to haul logs out of the woods. Logging, too, has morphed into an industry dependent on big machines, big trucks, and way fewer people working in the woods.
Eric de Place
Maggie, I think Alan is basically right. He’s referring to the category of “sustainable forestry” which I used in order to be concise. The numbers for that category actually refer to activities classified as: “Reforestation, Land and Watershed Restoration, and Sustainable Forest Management.” That’s not industrial-scale logging.
John
I have been looking for a quote from John L. Lewis on how his intent was to drive technology in mining so that his union members would not have to work in such a dangerous environment. My imagination? Or just poor memory?
Lynne Wheeler
They are already working to develop mining machines which can be run remotely. Scary thought.
Scott Mclemore
Lynne they have had remote operated automated miners for years. But they are not what you think.
Dan
The data here compares job creation from coal mining alone to other job sectors. To compare the Gateway Pacific Terminal job creation, I think you’d need to factor in the temporary jobs created by the rail improvements and likely road improvements which would be required mitigation and necessary to allow 18 1.5 mile long trains a day to pass the corridor. Then you would need to add the permanent jobs created by the increased train traffic and then the terminal jobs to get the coal onto the freighters. Then the freighter jobs. There are some numbers out there for how many jobs would be created and they are likely exaggerated based on what side of the fence the author is on. Has this information been reviewed by people in the know? Will the job creation be worth it compared to the environmental effects including coal dust, unregulated coal burning in China with pollution blowing back our way, derailments, the risk of spontaneous combustion while the coal is in transit and the lack of access to “the other side of the tracks”?
Heidi
Another point that is a little hard to quantify is that if we are sending coal abroad, doesn’t that support manufacturing jobs abroad? Then what happens to “Made in America?” How many manufacturing jobs will be lost or never be created in the U.S. if we send coal abroad to fuel jobs there?
Scott Mclemore
Heidi, That is an excellent point. Kudos to you. I hope you called you congressman and let them know how you feel about “Made in America” being a real concern. I am a huge supporter of putting the american worker first unlike our current government administration and I think we should be focusing more on our domestic problems such as unemployment and the staggering homeless numbers instead of bickering back and forth about gay marriage or North Korean idle threats. I know I got way off of the subject but I realy liked you statement and wanted to tell you so.
David Hopkinson
Before we factor in jobs that are indirectly created by a coal terminal, let’s ask how many permanent, operational jobs in this highly automated operation will go to *local* workers in Whatcom County. BNSF did some rail improvement on the line to Cherry Point, but the work was done by workers whom they imported from Texas, presumably because they were non-union and less costly. SSA Marine had the gall to hire place-holders to line up on behalf of local politicians and supporters of GPT for the public hearing in Ferndale, but instead of hiring union workers, they hired non-union temps.
Dave
Don’t forget to factor in all the jobs LOST near railroad tracks along the entire route. If your customers have to wait for trains to get to you, your business is going to go way down. Currently there are about 87 coal cars per day that go from the Powder River basin to the power plant in Olympia. If all these proposals go through, there will be 3300 coal cars per day, which is 38 TIMES the current coal train traffic.
I heard that someone did a study of the net job impact from the proposed coal export project at Longview. They took into account the terminal jobs, the train jobs, and the job losses for businesses near the tracks in Longview only. They found that there was a net increase of 20 jobs – about the same as a new restaurant.
Scott Mclemore
Dave I just stumbled upon this website. You may be correct that those 20 jobs would be about the same as the opening of a new restaurant however look at the wages earned by those said restaurant employees and compare them to the wages that will be earned for the coal export employees. I would be wiling to bet the coal export employees would earned 2-3 times the money per year. giving those people a better stake in life. I know a lot of people are just hung up on numbers these days but if you had the choice of earning a waiters salary or working at the coal export project which would be better for your family?
brad
Can somebody take a stab at the REAL ESTATE DEPRECIATION along the entire route? Who wants to live, work, eat dinner, play golf, or be near 18 coal trains a day. This my pencil pushing friends is Billions. But of course we have no recourse except to stop coal exports.
Alice de Wolff
Very useful piece, but I would love to see the specific calculations around coal in more detail. It could be useful to us in our struggle to stop Compliance Energy from developing an underground coal mine on Vancouver Island (Raven Underground Coal Mine).
And we also could really use any methods developed to estimate real estate devaluation. Thanks for any more detail you can provide.
sharon small
Would advise those of us vocally and actively opposing the Raven Underground Coal mine to cite inflated job numbers at nearby Quinsam coal mine: In its bid for social licence, Quinsam owners promised 300 plus jobs and substantial economic development for Campbell River. They also widely advertised FACTS, fish and coal together safely to get community support.
According to Chief Inspector of Mines Reports on Quinsam, average job number has stabilized at 122 and 7 contract jobs. How many of those go to locals needs to be determined, as does the proportion of salary budget that go to the executives. 122 jobs w/ fewer predicted given industry trend to using bigger machinery and robotics. Campbell River’s high unemployment rate and characterization of being economically depressed provide further incontrovertible evidence that coal profits do not flow into local communities. In fact coal mine supporters in Campbell River are hoping that Raven will provide needed jobs. Evidently evidence of almost a decade of contamination from the Quinsam coal production has not altered this faith in government/industry claims re economic benefits and jobs, jobs, jobs. Has anyone asked Christy Clark to explain this discrepency between promises and reality?
prateek Chatterjee
Iam mining engineering in b.tech