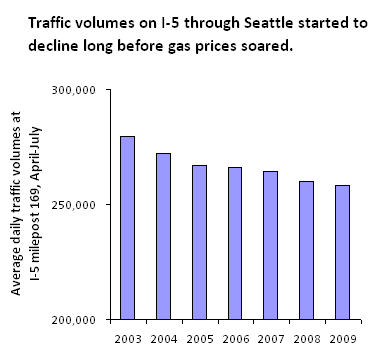
 Remarkably enough, state figures show that traffic on I-5 through Seattle declined pretty steadily from 2003 through 2009. Take a look at the chart to the right. In total, traffic volumes on I-5 across the ship canal bridge fell by well over 7 percent. Remember, this is total traffic, not per capita. The per capita trends have been even more dramatic.
The state didn’t report express lane data for 2010, but it looks like traffic volumes on the regular lanes inched back up a bit in 2010, to roughly their 2007 levels. So the downward trend from the chart may not have continued. (As the investment industry is so careful to point out, past performance is no guarantee of future results.)
But here’s the thing: I have it on good authority that the models used to predict future traffic volumes in the Puget Sound would never have predicted the actual traffic trends seen on I-5 through Seattle. Most traffic models simply assume that car trips increase more or less in step with population and the economy: more people earning more money means more trips. But that’s the opposite of what’s happened: traffic counts fell, even as population and economic activity increased. (Yes, I know, I know, the economy faltered in 2008—but the downward trend started much earlier.)
Why does this matter? Because the supporters of big highway megaprojects in the Pacific Northwest (and beyond) typically claim that there’s a “need” to accommodate all the traffic that’s being predicted by traffic models. But those predictions aren’t facts: more than anything, they’re simply assumptions built into the models themselves!
In effect, then, the models simply assume what they’re trying to prove. And in this case, as in many, many others, the assumption that traffic volumes are on the rise, always and everywhere, is proving to be a serious—and potentially costly—mistake.

Thank you for dredging up the data to show that “growth” is not always inevitable or a good thing. Not only highway planners, but energy, metals, and raw materials of all kinds can fluctuate according to social values, and those can change as new values rise in prominence. Of course the overwhelming momentum and thrust of advertising dollars, legistlative corruption via lobbists and editorial slants is always toward economic growth, so efforts like Sightline’s are essential to changing societal values.
The regional travel demand model would have us believe that traffic will increase roughly 1% per year. I’m not sure how they calibrate the models, but with ten years of trends deviating from the model – I find it hard to believe that PSRC continues to stand by its accuracy.Caroline Rodier, Ph.D., at the Mineta Transportation Institute has written extensively of the failure of travel demand modeling. She looked at decades old traffic forecasts for proposed system expansion projects. Generally the models predicted “carmegedon” if capacity wasn’t added or a new freeway wasn’t constructed. She compared the modeled volumes to present day volumes/delays for locations that both were are were not built. The result was that the impacts predicted under a no-build traffic analysis did not accrue, while induced travel clogged the new roadways that were built.