
As the housing shortage stretches into every corner of the United States, it’s clear that some cities and states have more abundant housing than others. But it’s harder to tease out which fast-growing metropolitan areas are good at adding homes in places people already live, and which are just good at paving over farms.
In this report, Sightline finds that in the twenty-first century, no large metro area in the United States has been better at adding people to already-populated places than Seattle.
And if demand for living in the region holds up, Seattle could maintain its lead through this decade as well. The city of Seattle’s recent update to its long-term growth plan doubles down and expands on the strategies that have driven urban population growth, vastly reducing the zoning limitations on new housing construction. Dan Keshet, an Austin housing advocate and co-founder of Texans for Housing, says that Seattle may now be “the large city outside Houston with the most legal runway for growth in the US.”i
Seattle can slip under the radar when analysts look at overall population growth, where Sun Belt hubs like Austin instead come out on top. Texas’s capital region leads a pack of Southern and Western metros that have experienced astonishing growth since the turn of the millennium—the Austin metropolitan area doubled in population from 2000 to 2024. These booming metros are often celebrated for their immense housing construction. But a close analysis of census data reveals that growth has primarily occurred in only one direction: outward.
Meanwhile, Seattle’s overall population growth doesn’t come close to the eye-popping expansion of some Sun Belt metros. But the Seattle metro area is better than anywhere else in the United States at solving a political problem that’s currently stumping every growing city: putting new people into old neighborhoods.
Getting those new people into existing neighborhoods is key to the cultural, financial, and environmental health of cities around the United States. New residents bring new ideas, businesses, taxes, and more. If a region hasn’t planned to accommodate them, newcomers will have to bid up prices to find a home, driving some existing residents out and locking out other would-be residents from the area. It’s generally cheaper for towns to upgrade existing infrastructure to accommodate population growth than to build entirely new roads, wires, pipes, and transit to serve residents in new subdivisions. And when residents get to live in existing close-in neighborhoods, they emit fewer greenhouse gases and pave over less natural space than if they’re forced out to exurban sprawl at the edge of the metro.
None of its relative success means Seattle is perfect, of course. The city is still pushing population growth out to its suburbs; housing prices in the region are keeping out potential new residents or forcing out old ones; and the homelessness crisis continues to drive local politics.
Still, Seattle offers some hope that US cities haven’t completely forgotten how to grow upward and inward. The construction techniques to build duplexes and the political will to legalize apartment buildings are still there, even if they’ve been dormant in recent decades as an abundance of automobiles made it easy to grow outward. Cities that want to grow in a more sustainable way, both environmentally and financially, can watch what’s been going on in Cascadia’s biggest metropolis.
Sidebar: Neighborhood focus
South Lake Union has been the poster child for Seattle’s population growth since 2000, and local boosters have been promoting the neighborhood since even earlier. As late as the 1990s, the area was a comparatively sleepy district of warehouses, laundries, auto dealerships, and the residential Cascade neighborhood. Successive mayors, upzones, and tech investment spurred South Lake Union’s transformation into the urban core it is today: Amazon’s main campus, biotech hubs, a streetcar line, and block after block of midrise apartments (plus one or two high-rises).
And the neighborhood’s population counts reflect this transformation. In 2000 the census tracts making up South Lake Union and the adjacent Denny Triangle had just over 5,000 residents—an urban neighborhood exceeding the magic number of 4,000 people per square mile, but nothing like it looks today. By 2020 that population had nearly quintupled, rising past 25,000.ii
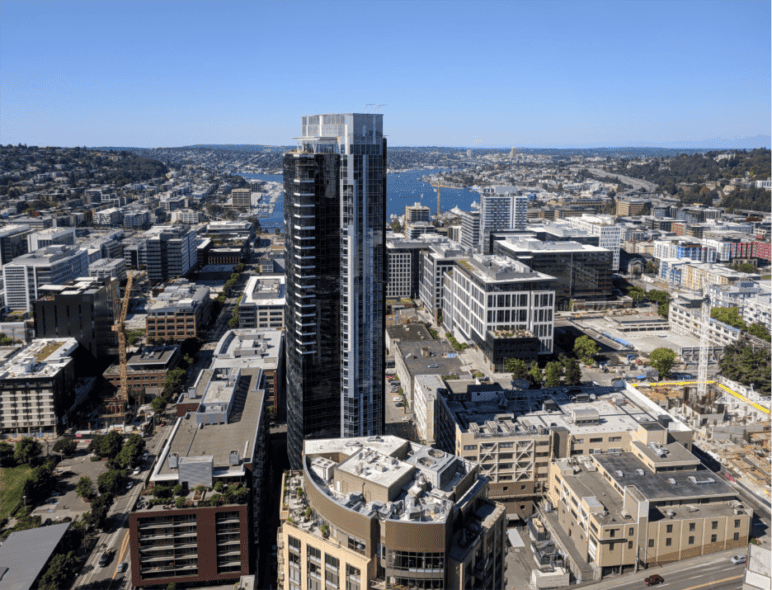
But as eye-popping as these numbers are, South Lake Union is only a small part of Seattle’s urban population growth this century. Although 20,000 new residents in one neighborhood is definitely a big deal, it’s small compared to the nearly 160,000 new residents in the city of Seattle’s built-up neighborhoods, or the more than 300,000 new residents in built-up neighborhoods across the region. The overall story of urban population growth in Seattle is not that one or two neighborhoods grew a lot, but that a lot of neighborhoods grew a medium amount.
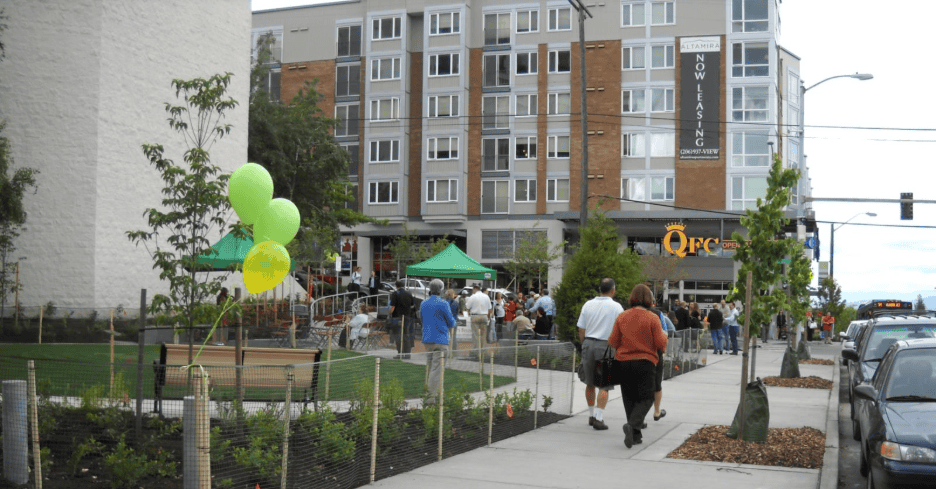
One of those neighborhoods is West Seattle, specifically the area around Alaska Junction. The census tract containing the Junction grew from 5,300 people in 2000 (already above 4,000 people per square mile) to just over 10,000 in 2020.iii That’s only around 250 new residents each year, about the scale of one midrise apartment building going up near the commercial core or a more scattered mix of duplex conversions, backyard cottages, and neighbors having kids.
While South Lake Union might be the more famous case of urban population growth in Seattle, neighborhoods like Alaska Junction are what that growth actually looks like in most of the city.
Measuring population density
Common aggregate measures of population density don’t effectively measure whether places that already have people are growing.
Metropolitan-area boundaries, counties, and often even the borders of a metro’s core city contain urban, suburban, and rural development patterns. The boundaries of these regions often have little to do with the actual border between cityscape and countryside. Population-weighted density, which is the population density of individual subregions (like census tracts) averaged across every resident in the metro, better accounts for the difference between urban and rural areas, but it suffers in this case for similar reasons. Adding enough residents to a rural area can increase the population-weighted density of the metro, even though the increase would be larger if the same amount of growth instead went to an urban area.
So weighted or unweighted, shifts in overall population density can’t answer the question. Distinguishing population growth in more urban neighborhoods from growth in more rural ones requires identifying those neighborhoods in the first place.
But then, comparing growth inside and outside the boundary of each metro’s principal city has its own shortcomings. Growth inside the principal city can include sprawl, like when a city builds a new subdivision on previously open land that technically falls within city limits. On the other hand, growth outside the principal city can include infill growth, like when a close-in suburb adds more residents to its Main Street. City limits also change over time through methods like annexation.
Another possibility is measuring population growth within a certain distance of the city center, but this method suffers from the same boundary issue as partitioning around city limits. Low-population areas, like industrial districts, highways, and railyards, as well as bodies of water, can be close to city centers; meanwhile, more populous neighborhoods, like suburban downtowns, might fall outside of any geographic radius around the core city.
To assess whether new residents are being added to places that already have a lot of people, Sightline decided to partition US metro areas at the level of the census tract, a defined geographic region that generally contains a few thousand people, typically on the scale of an urban neighborhood or a small town.iv This scale is granular enough to separate out areas of higher population density without grouping too many different levels of development together.
The next question: how to tell one tract from another.
Distinguishing infill-based from sprawl-based population growth
Sightline split census tracts around a population density of 4,000 people per square mile. That level is characteristic of inner suburbs, about as roomy as the close-in Seattle suburb of Mercer Island.v It delineates the most urban third of the United States, since about one-third of Americans live in neighborhoods with more than 4,000 people per square mile. In 2000, this level delineated the urban half of the Seattle metro, since 47 percent of Seattle metro residents then lived in neighborhoods with more than 4,000 people per square mile.
Leading land use researcher Yonah Freemark uses this threshold in a 2016 blog post discussing city growth. Freemark calls places with more than 4,000 people per square mile “already developed” or “built up,” and he finds that many American cities lost population in their built-up areas during the late twentieth century despite adding population overall. When an area with more than 4,000 people per square mile grows, that growth tends to look like housing infill: adding more people to a built-up neighborhood via backyard cottages, triplexes, walk-up apartments, high-rises, and the like. When an area with fewer than 4,000 people per square mile grows, that growth tends to look like sprawl: building a new neighborhood on previously rural land, often a subdivision of tract houses.vi
This threshold helps compare metro areas and municipalities based on what this report will call urban population growth: as a percentage of the total population in 2000, how many more residents in 2020 live in neighborhoods that were already built up in 2000? More specifically, the formula’s sequence is as follows:
- Identify which census tracts had more than 4,000 people per square mile in 2000.
- Subtract these tracts’ 2000 population from their 2020 population to measure absolute population growth in built-up census tracts.
- Divide this absolute population growth by the entire metro’s 2000 population to calculate a rate of urban population growth.
This method is also useful for assessing sprawl (one could swap in census tracts with fewer than 4,000 people per square mile in 2020). Basically every growing metro in North America is sprawling, as are even some shrinking metros. This report, though, focuses on which metros are adding more residents to built-up neighborhoods—whether or not sprawl also happens in those metros.
So, 4,000 people per square mile will serve as this report’s standard for answering a complex question: are cities adding residents to neighborhoods where lots of people already live?
A study in sprawl: Austin grew out, not up or in
Austin is the quintessential twenty-first-century US boomtown, growing more relative to its prior population than any other large metro, from 1.2 million residents in 2000 to 2.3 million in 2020.
But almost all of that growth happened in low-population neighborhoods, census tracts that in 2000 were home to fewer than 4,000 people per square mile. While growth may have also occurred in some built-up neighborhoods, like West Campus adding new apartments for University of Texas students, most of that was offset by population drops across the metro, like when the parents of those students continued to live in the family’s local three-bedroom home.vii Out in the suburbs, meanwhile, and in some sections of the city of Austin, new subdivisions filled up with people and replaced previously undeveloped farmland or open space.
The Austin metro’s 83 percent population growth in the first two decades of the twenty-first century outpaced every other large American metro, with only five other regions surpassing 50 percent population growth.viii But only a fraction of those net new residents ended up in Austin’s built-up neighborhoods, census tracts with more than 4,000 people per square mile. Of that 83 percent growth, the Austin metro saw only 3 percentage points of urban population growth, about 38,000 more residents.
The other 80 percentage points of population growth, almost a million people, happened in low-population neighborhoods: a combination of people moving from built-up Austin-area neighborhoods, children of existing residents of those neighborhoods, and people wholly new to the metro. The Austin metro may have grown a lot from 2000 to 2020, but that growth came almost entirely from adding people to new neighborhoods in outlying areas without much prior residential land use.
Sidebar: Lessons from other cities
San Jose: Urban population growth is for suburbs, too
San Jose, California, offers a clear counterexample to Seattle’s local leadership on urban population growth. While the city of San Jose saw 6 points of urban population growth, the rest of its metro area saw 12 points. This growth in the southern Bay Area is being led by other towns in the region, like Mountain View (17 points), Sunnyvale (15 points), and Gilroy (14 points). San Jose itself sits on its heels by comparison. At the same time, the metro is experiencing basically no new sprawl (only 7 points). Metros don’t have to depend on city-center infill and exurban sprawl for new residents; urban population growth can happen in the suburbs, too.
Las Vegas: New subdivisions can house lots of people
Las Vegas, Nevada, is above average at building out its built-up neighborhoods (7 points of urban population growth), but it’s top-notch at building new neighborhoods with large populations. Even suburban neighborhoods in Las Vegas are quite populous, and the area has few tracts at the low population densities common at the edges of other metros. When the region does build a new subdivision, it often builds a populous suburban neighborhood rather than slowly moving from sparsely populated farmland through intermediate levels of population density. Dozens of census tracts in the Las Vegas metro went from nearly 0 people per square mile in 2000 up to more than 4,000 (or even 10,000) people per square mile in 2020.
New York City: There is no finish line
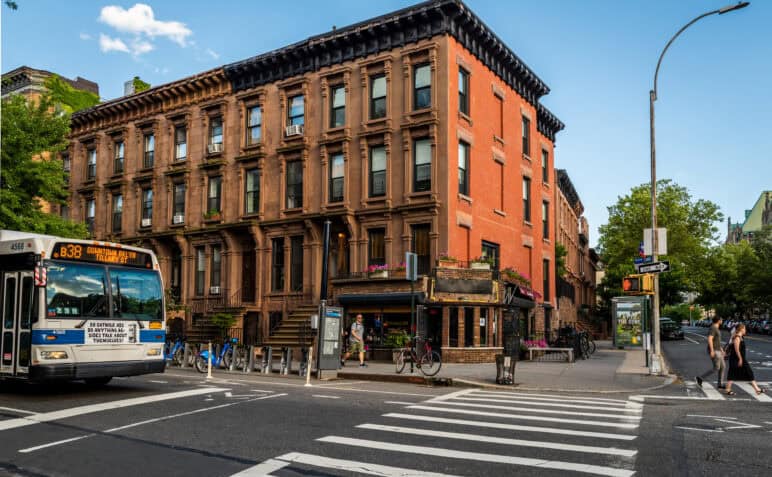
The Big Apple shows the rest of the country that there is no stopping point where a neighborhood has “enough people,” and certainly no stopping point that anybody else is in danger of hitting. Seattle isn’t even close to “Manhattanization”; no census tract in Seattle has even the median population density experienced in Manhattan (without even counting the commuters that double the island’s population during workdays). For the city of Seattle to reach the same median population density as Manhattan, it would need to grow to about 7 million people (compared to its current 800,000). Everywhere is urbanism; New York shows that Seattle can have residential neighborhoods full of townhomes and midrise apartments, bustling shopping streets, and corner bodegas, instead of banning those amenities outside of urban villages and corridors as Seattle did until recently.
Seattle grew up and in (and also out)
So far this century, the Seattle metro has not seen such skyrocketing growth. It grew 32 percent from 2000 to 2020, from 3 million to 4 million people. The metro added a sizable number of new residents, but only enough to make Seattle the 18th-fastest-growing large metro in the United States—about as fast as Tampa or Washington, DC.
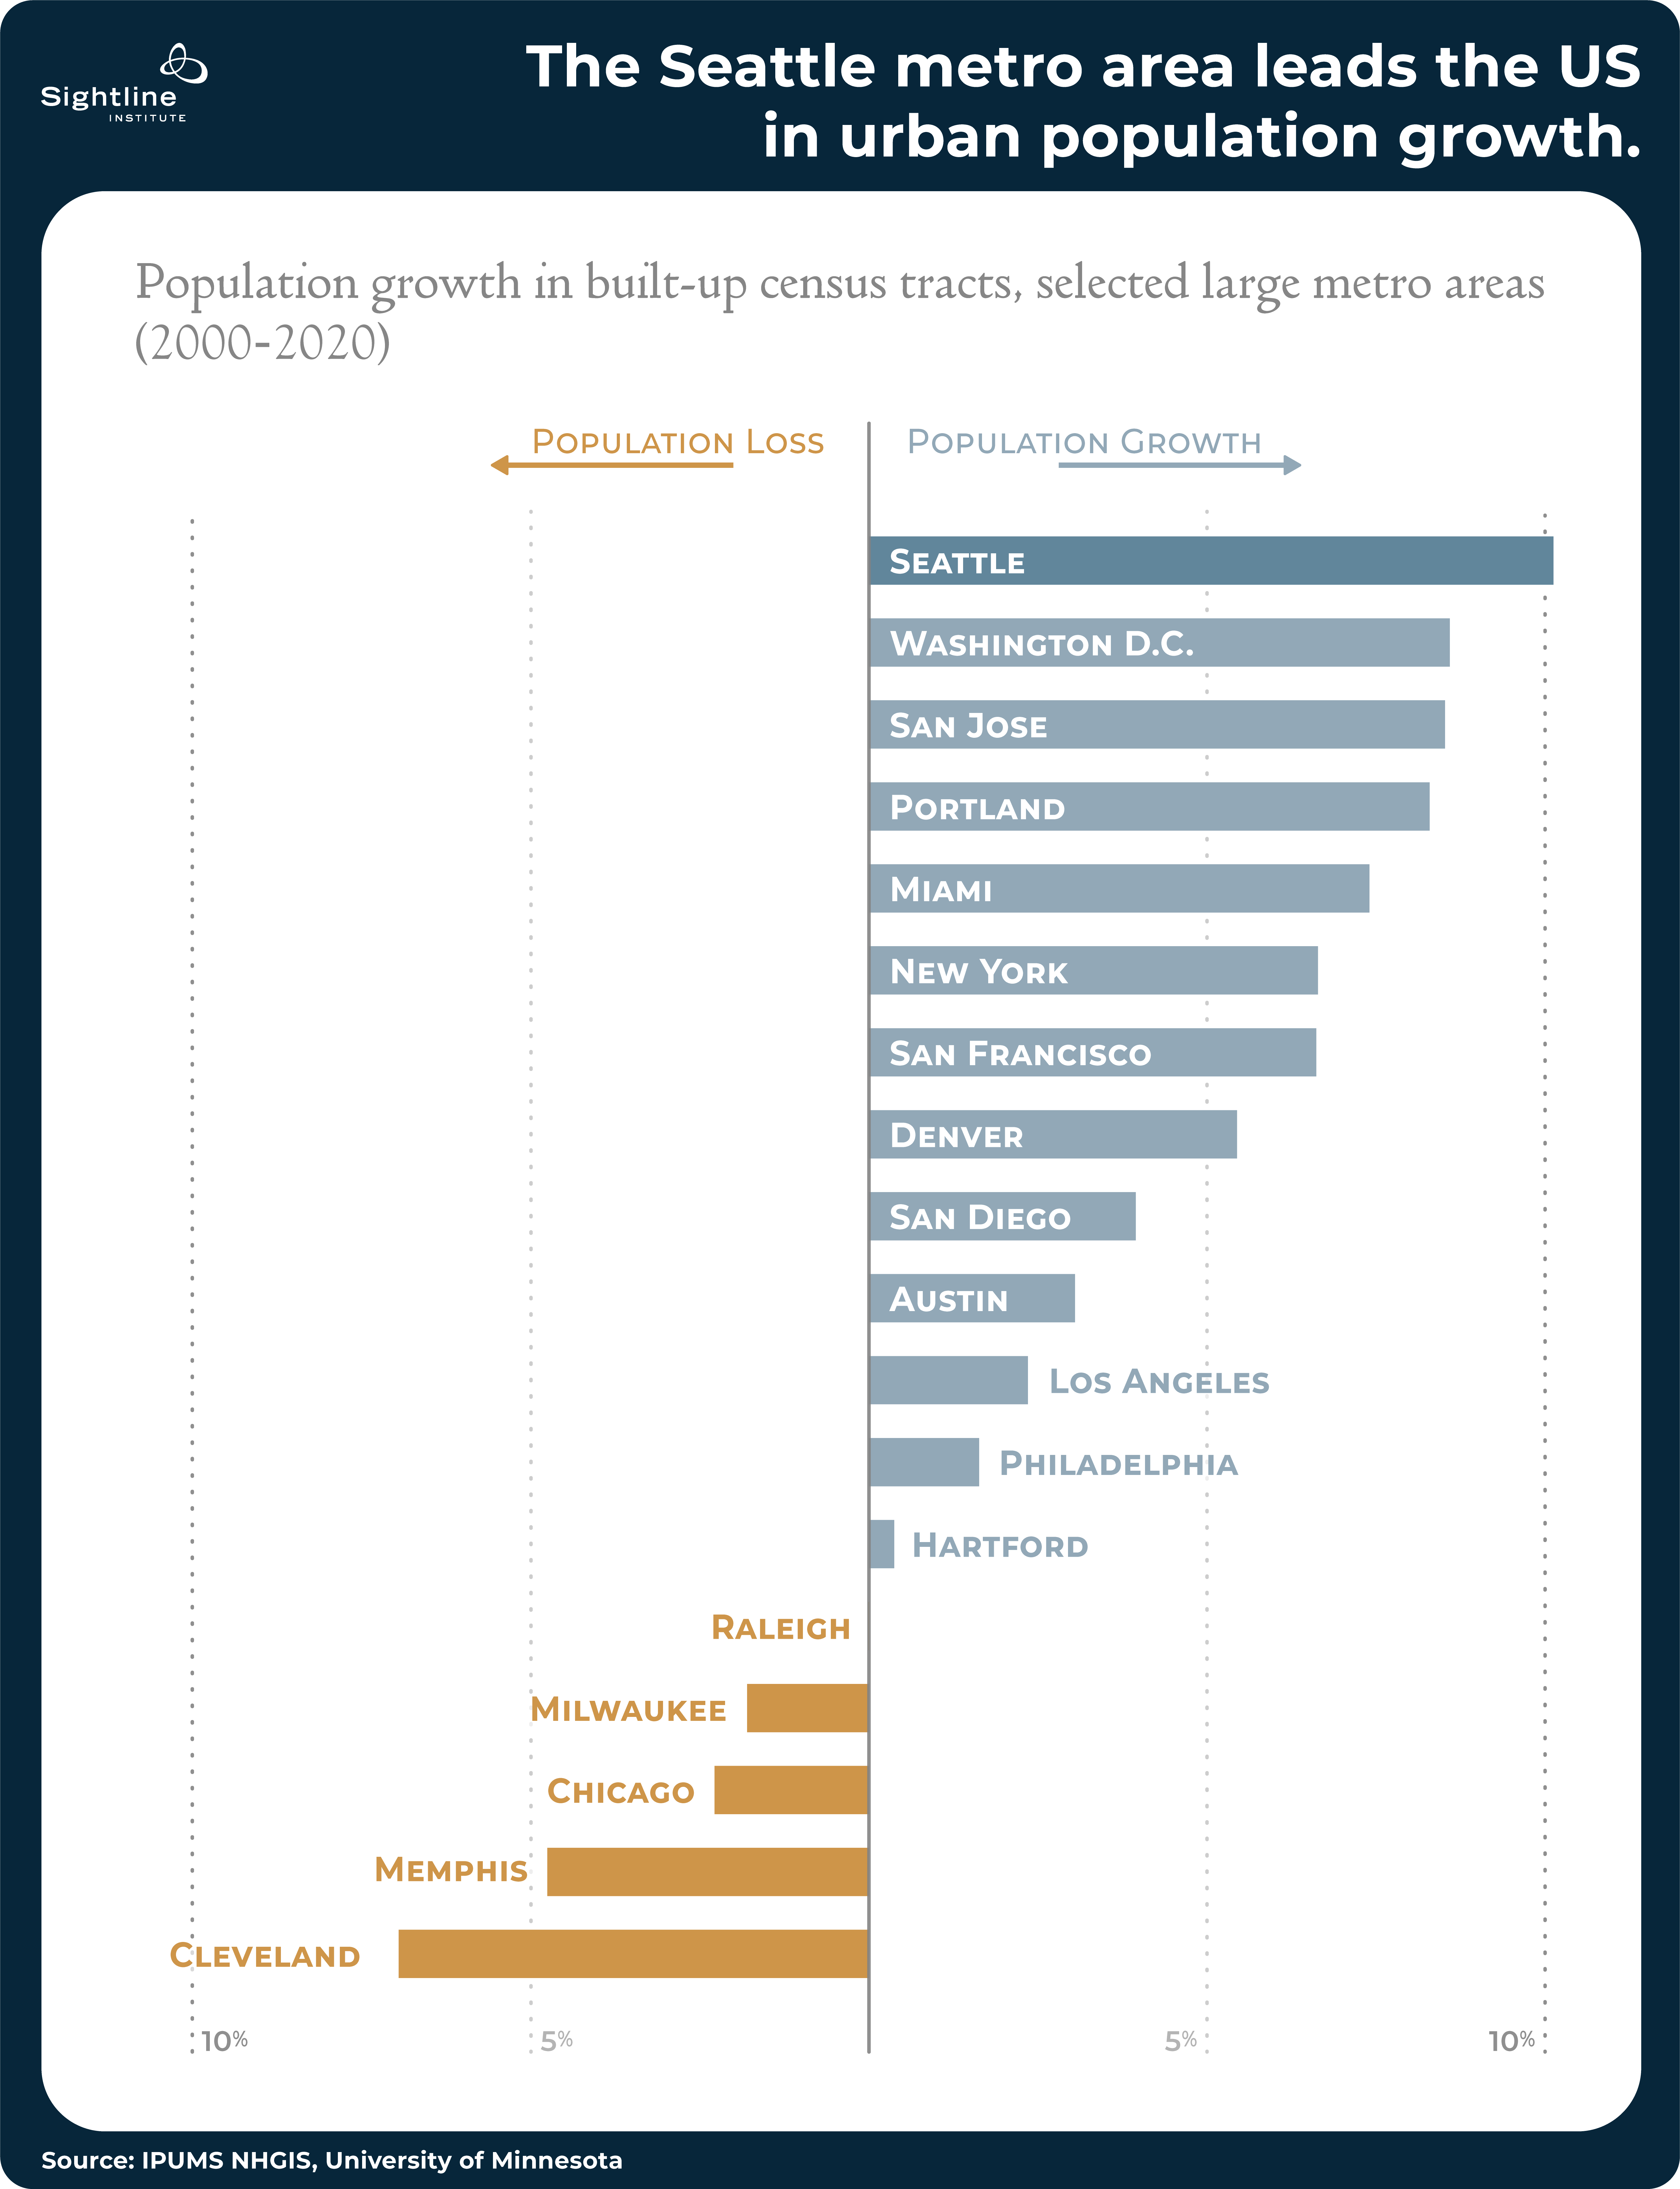
Seattle’s growth doesn’t differ from Austin’s only in scale, though. It also differs in type. While the Austin metro saw immense population growth almost totally accommodated via sprawl, the Seattle metro absorbed its population growth much more via infill and notably less via sprawl. Its urban population growth from 2000 to 2020 was 10 percentage points (about 300,000 people), with growth outside built-up areas making up the other 22 points.
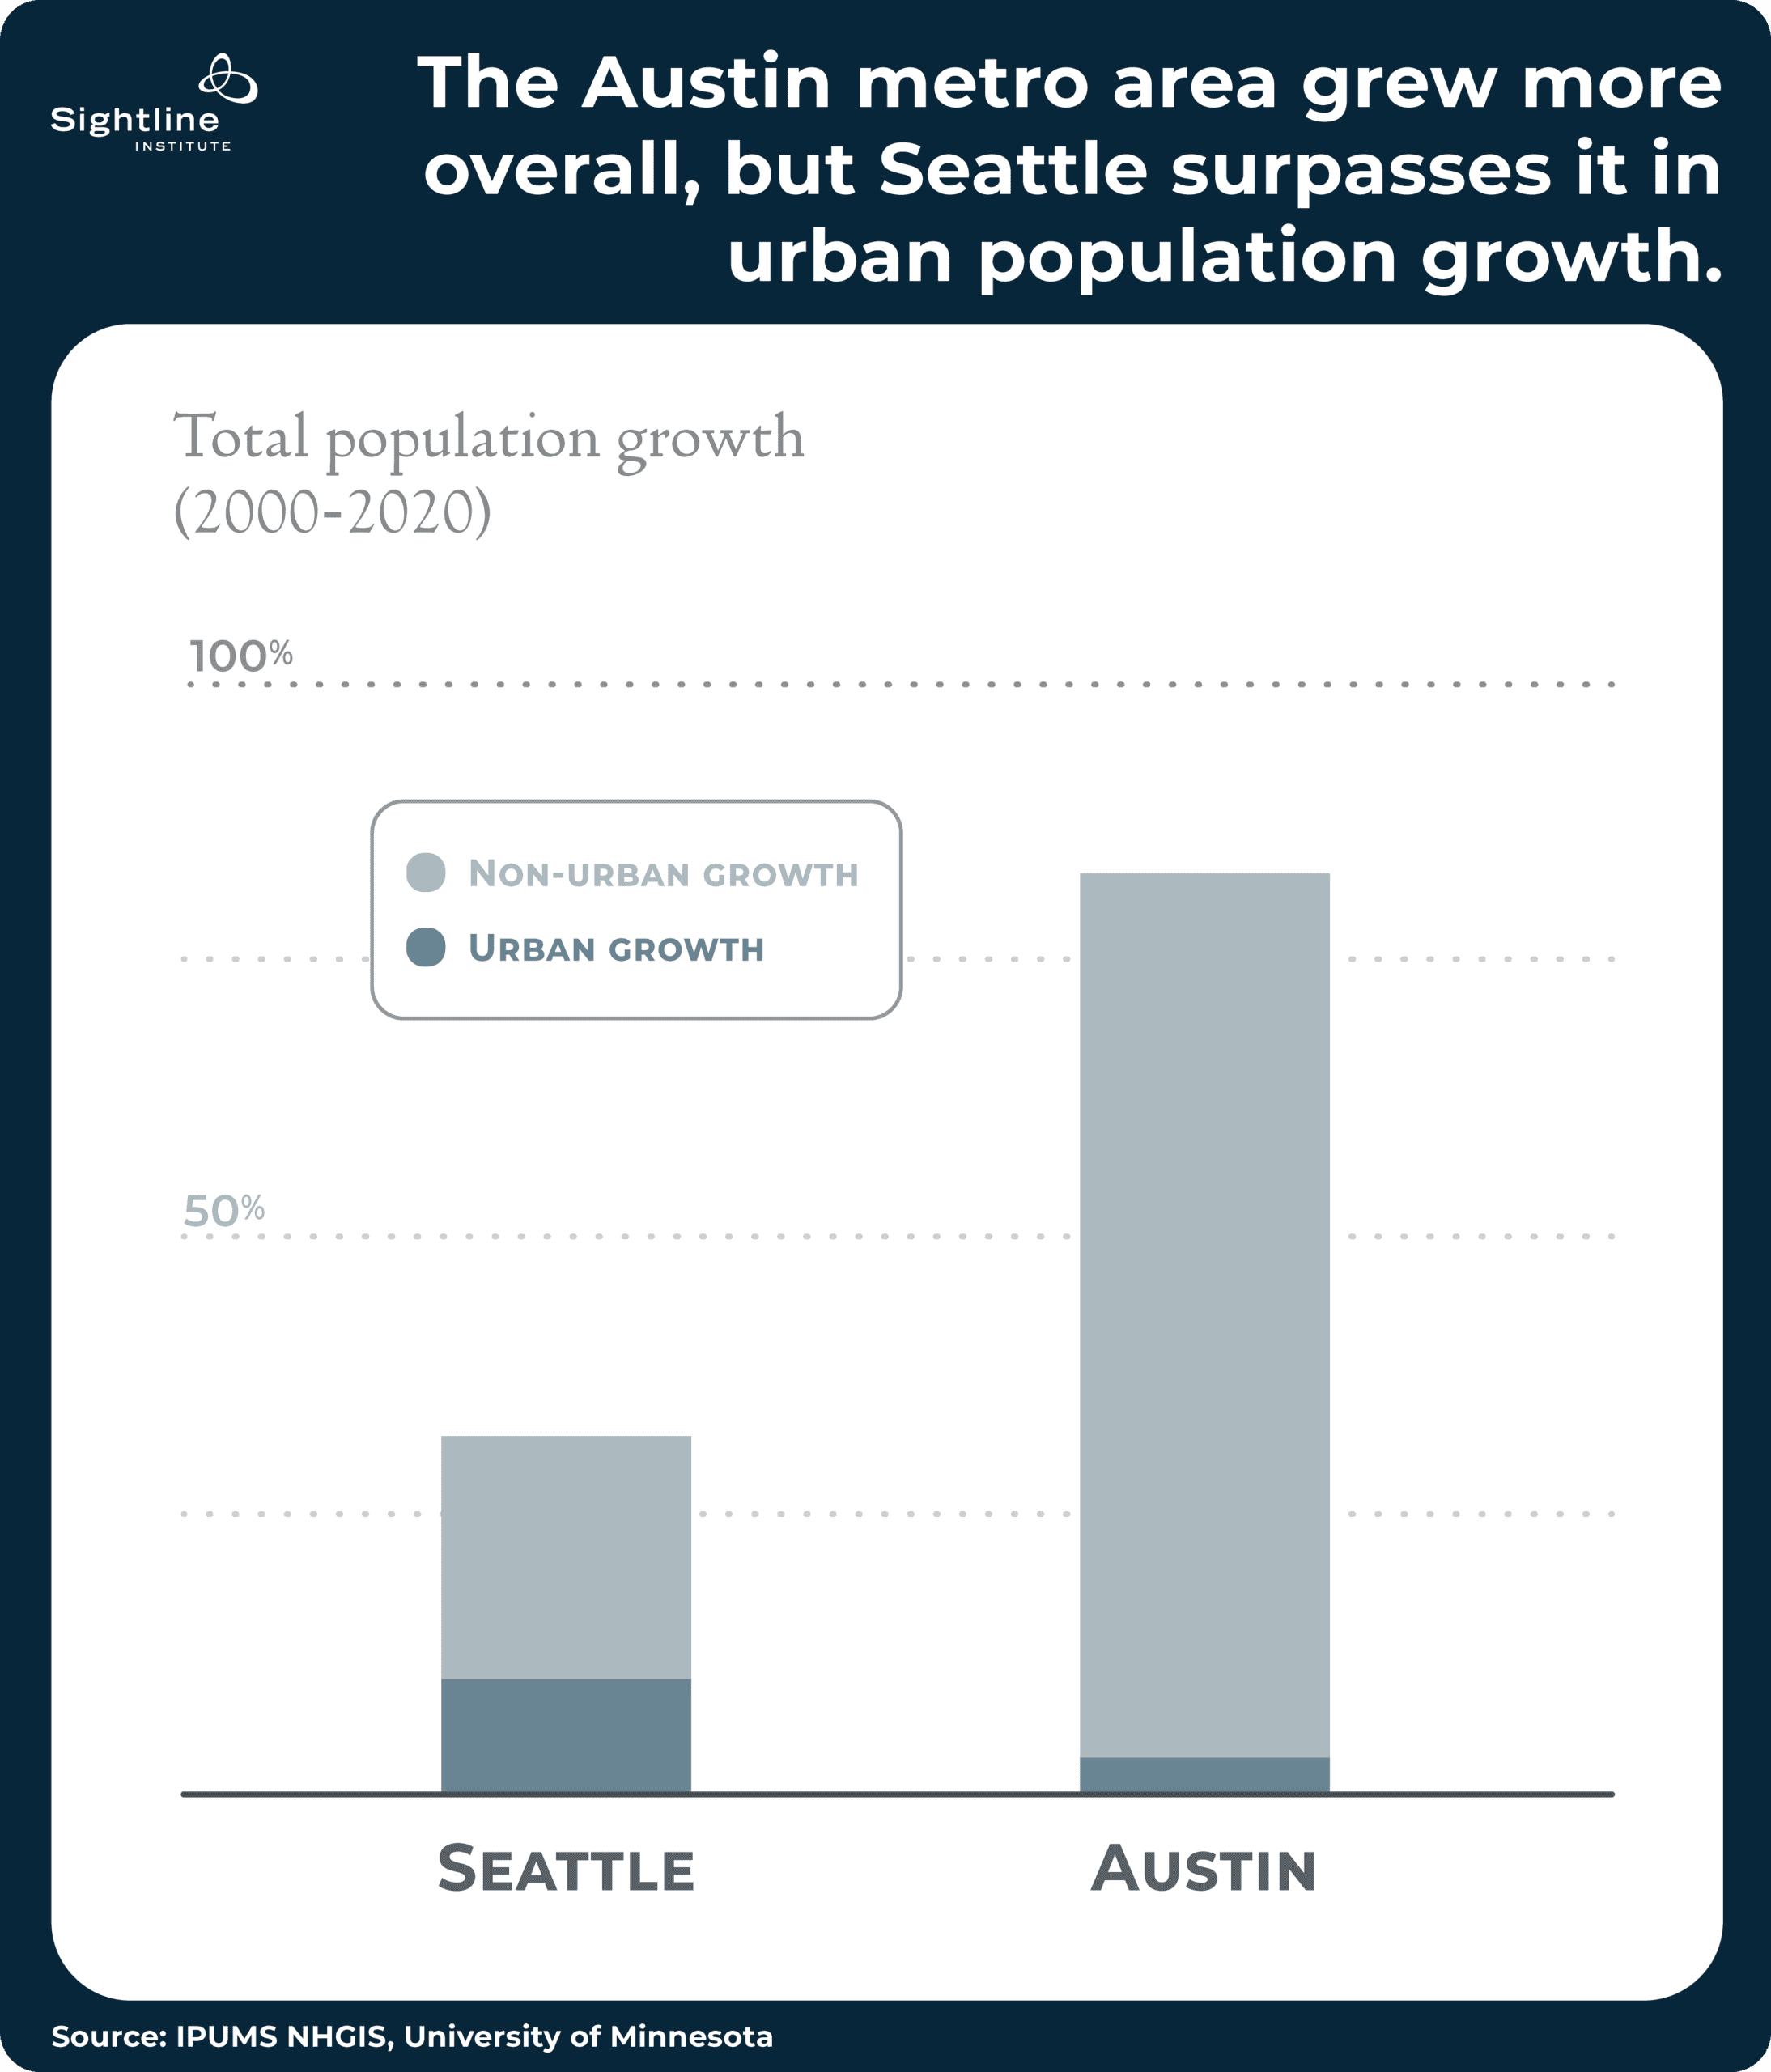
So Seattle’s 10 points of urban population growth over this period is far larger than Austin’s 3 points, despite the latter metro’s higher overall population growth. And it’s not just Austin; Seattle grew more from its built-up neighborhoods than every other large American metro.
Seattle had more urban population growth than any other large US metro
The Seattle Metro area leads the US in urban population growth
Population growth in built-up census tracts, selected large metro areas (2000-2020)
Source: IPUMS NHGIS, University of Minnesota
As discussed, and as shown in the above graph, Austin’s metro grew only 3 percent from its built-up neighborhoods between 2000 and 2020. Elsewhere in the United States, urban population growth varied. The Raleigh-area Research Triangle shrank slightly in its built-up neighborhoods. Greater New York City and the Las Vegas Valley grew by only 7 percent.
But Seattle grew by 10 percent within its built-up neighborhoods. That is, greater Seattle grew by 10 percent without even counting all the new residents living in sprawling neighborhoods with fewer than 4,000 people per square mile in 2000 (making up the other 22 points of growth). Among the 50 largest US metro areas, the Seattle metro comes out on top for urban population growth.
What’s more, the city of Seattle is doing even better. Seattle proper saw 28 points of urban population growth, while the rest of the three-county metro saw only 6 points. No other sizable municipality in the region grew more from its built-up areas than Seattle. Tacoma had 9 points of urban population growth; Everett 12 points; Bellevue 13; and Kent 9.)ix
Within the Seattle metro area, the city of Seattle leads its neighbors in urban population growth.
Population growth in built-up census tracts, selected Seattle-area cities (2000-2020)
Source: IPUMS NHGIS, University of Minnesota
As the chart below shows, the city of Seattle and its 28 percentage points of urban population growth stand out even more compared to other core cities of large metro areas. Second-place Miami doesn’t even reach 20 points of urban population growth. The municipalities of Portland, Oregon, and Washington, DC, whose metro areas sit a hair behind Seattle for urban population growth at the regional level, land only in the high teens as core cities.
The city of Seattle has an even larger lead in urban population growth over other large US cities.
Population growth in built-up census tracts, selected large cities (2000-2020)
Source: IPUMS NHGIS, University of Minnesota
Looking forward
It’s anybody’s guess whether Seattle continues to lead the pack in the coming years. Growth patterns and demand for urban living are hard to predict from decade to decade, especially since cities and states change their housing policy in response to previous growth (or the lack thereof). Previously sprawling Austin, for example, has seen new pro-housing policy, an apartment boom, and flattening rents in recent years, the effects of which could show up as urban population growth by the 2030 census.
But the Emerald City isn’t sitting on its heels, either. In December, Seattle went above and beyond recent state zoning laws to
- expand the “urban villages” that much of its previous growth came from;
- increase bonuses for affordable homes;
- enable more accessible small apartment buildings in addition to multi-story townhomes; and
- re-legalize small neighborhood businesses across the city.
On urban housing abundance, look to Seattle over Austin
Assessing urban population growth is relevant to one of the most urgent questions in American housing policy. Abundance coauthor Derek Thompson asks, “Why does Austin build so many houses and Los Angeles doesn’t?”
Ever since its dramatic downzonings from 1960 to 1990, Los Angeles has built far too few homes to keep up with the number of people who want to live there. The bidding wars that followed have sent home prices spiraling upward much faster than local incomes. Something similar has been happening in many other American cities, from Boston to Bellingham.
While history like this sheds light on Thompson’s question of why that happened, this analysis can help describe how it happened: The Austin metro built a lot of sprawl over the past two decades and grew into areas where few people had lived before, while the Los Angeles metro didn’t—and didn’t build much infill housing, either.x The two metro areas had similar small rates of urban population growth from 2000 to 2020 (3 points in Austin; 2 points in Los Angeles), but Austin grew another 80 points from sprawl, while Los Angeles sprawled only an additional 4 points.xi
It might be true that sprawl has made housing relatively abundant in Austin and other Sun Belt metros like Raleigh. Indeed, some commentators have recently argued that sprawl is underrated. But sprawl has its own limitations. It only works at the margins of a metro area, via greenfield development in new far-flung exurbs.
In most core cities, though, all the land that’s fit to build on already has a lot of people. Los Angeles, New York City, and San Francisco physically can’t sprawl any more within their city limits, so the Austin metro’s primary path to population growth and housing abundance won’t work for them.
For cities like those to take on their own housing shortages, a different path is needed—namely, not an Austin-style plan that parks newcomers on the edges of the metro, but a Seattle-style urban population growth plan that welcomes new homes and people into the neighborhoods where people already live. Seattle, not Austin, has been modeling true urban growth for the rest of the United States.
About the Author

Jay Lee is a Researcher with Sightline Institute, where he works to advance electoral upgrades across Cascadia, analyze demographic trends and climate migration patterns, and support his fellow researchers with quantitative analysis.
Prior to joining Sightline, Jay worked in election policy research, survey administration, election results reporting, and data analysis and visualization. He holds a BA in mathematics from Reed College.
In his personal life, Jay enjoys riding his bike around town, playing squash, and crushing it at trivia night. After several years in Portland, Oregon, he now lives in New York City. Email him at jay@sightline.org, and follow him on Bluesky or LinkedIn.