
Last time, I detailed the challenges of abundant housing in post-carbon cities and illustrated what such cities might look like. This time, I document the ubiquity of housing shortages, as a precursor to articles that will discuss grand political strategies for housing.
A generation of pro-housing advocacy, most of it centered on the principles of “smart growth,” has yet to succeed.

Across North America (unlike in Japan) control over homebuilding has historically been in the hands of local governments. Consequently, most pro-housing advocacy focuses on city hall. But a generation of such advocacy, most of it centered on the principles of “smart growth,” has yet to succeed. Well, it has succeeded in allowing scattered pockets of apartment construction in cities—especially in areas that have few people or little political power. It has done little, though, to soften the absolute bans on duplexes, three-story walk-ups, apartment buildings, and other forms of “middle housing” in single-family zones—prohibitions that cover most residential land in North America. (“Single-family zones” is a misnomer: many houses hold roommates and plenty of families share roofs. What they are is zones reserved exclusively for detached individual houses. A more accurate term, which Sightline uses in most cases, is therefore “single-detached.”)
The scale of this prohibition is hard to overstate. Like water to fish, it’s so ubiquitous in our lives that we fail to recognize it. Emily Badger and Quactrung Bui of the New York Times mapped the zoning of residential-only land in ten US cities and found that all but New York and Washington, DC, which both set aside vast areas for rowhouses, cede more than half of their residential land to single-detached housing. Some 75 percent of residences-only land in Los Angeles exclusively allows single-detached houses except under tight constraints. In Portland, the figure is 77 percent, in Seattle 81 percent, and in San Jose 95 percent.
Along the same lines, California-based researcher Issi Romem has documented that metropolitan areas across the United States have been shockingly consistent. Whatever state or party governs them and whatever climate or geography shapes them, they have stopped most development of new housing in the vast majority of their land areas. Metro areas that encompass scores of separate cities nonetheless look the same on Romem’s animated historical maps of every large metro in the country: after decades of in-fill development, most of the land in most US residential areas has now stopped sprouting new homes. Almost all new homes now go into confined high-density nodes or to the exurban fringe as detached houses.
Sunbelt places sprawl away at the edges, keeping homes abundant and cheap but at a cost to countryside, climate, and commute distances. In contrast, sprawl-busting metro areas, mostly on the coasts of North America and including those in Cascadia, have succeeded in slowing their own outward expansion but have, at the same time, failed to grow upward enough to keep pace with population. Indeed, the area on which they are adding in-fill housing has actually shrunk during the decades of smart-growth advocacy, as vacant lots filled and zoning codes tightened. Inevitably, prices and rents have soared.
In the past, virtually every patch of land in the metropolitan U.S. continually sprouted new housing, but this is no longer the case. In recent decades, residential construction has become increasingly confined to the periphery of American metro areas, while a growing swath of the interior has fallen dormant and produces new homes at a negligible pace. At the same time, a tiny fraction of the land area, scattered in small pockets throughout the metropolitan landscape, is responsible for a growing share of new home production, primarily in large multifamily structures.
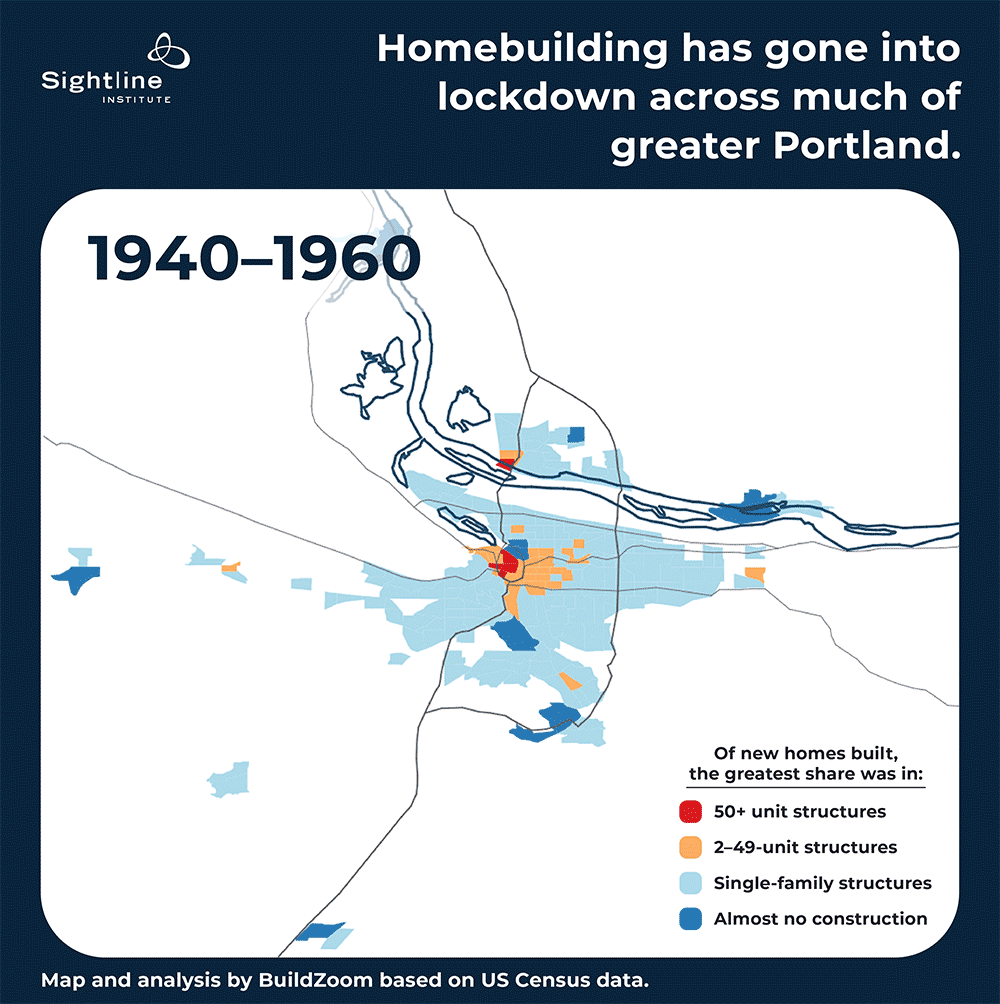
You can see much of the greater Portland metropolitan land area getting locked down in Romem’s animated map (see below). On maps of this scale, the smart growth vision—an abundance of homebuilding close to the metro core around transit and other urban infrastructure—calls for reds and oranges close in (the colors that stand for large and mid-sized multifamily buildings), grading down to light blue (signifying single-detached homes) as you move toward the periphery.
Below, the greater Portland area shows clearly that new homes have concentrated in small areas of apartment blocks and that larger areas have turned dark blue—places where virtually no in-fill homebuilding is happening.
Greater Seattle (below) shows a similar pattern. Sprawling growth has slowed but homebuilding is now extremely concentrated in large new buildings in small areas (in red). A sea of dark blue reflects the no-new-homes policies that cover most of the metro area.
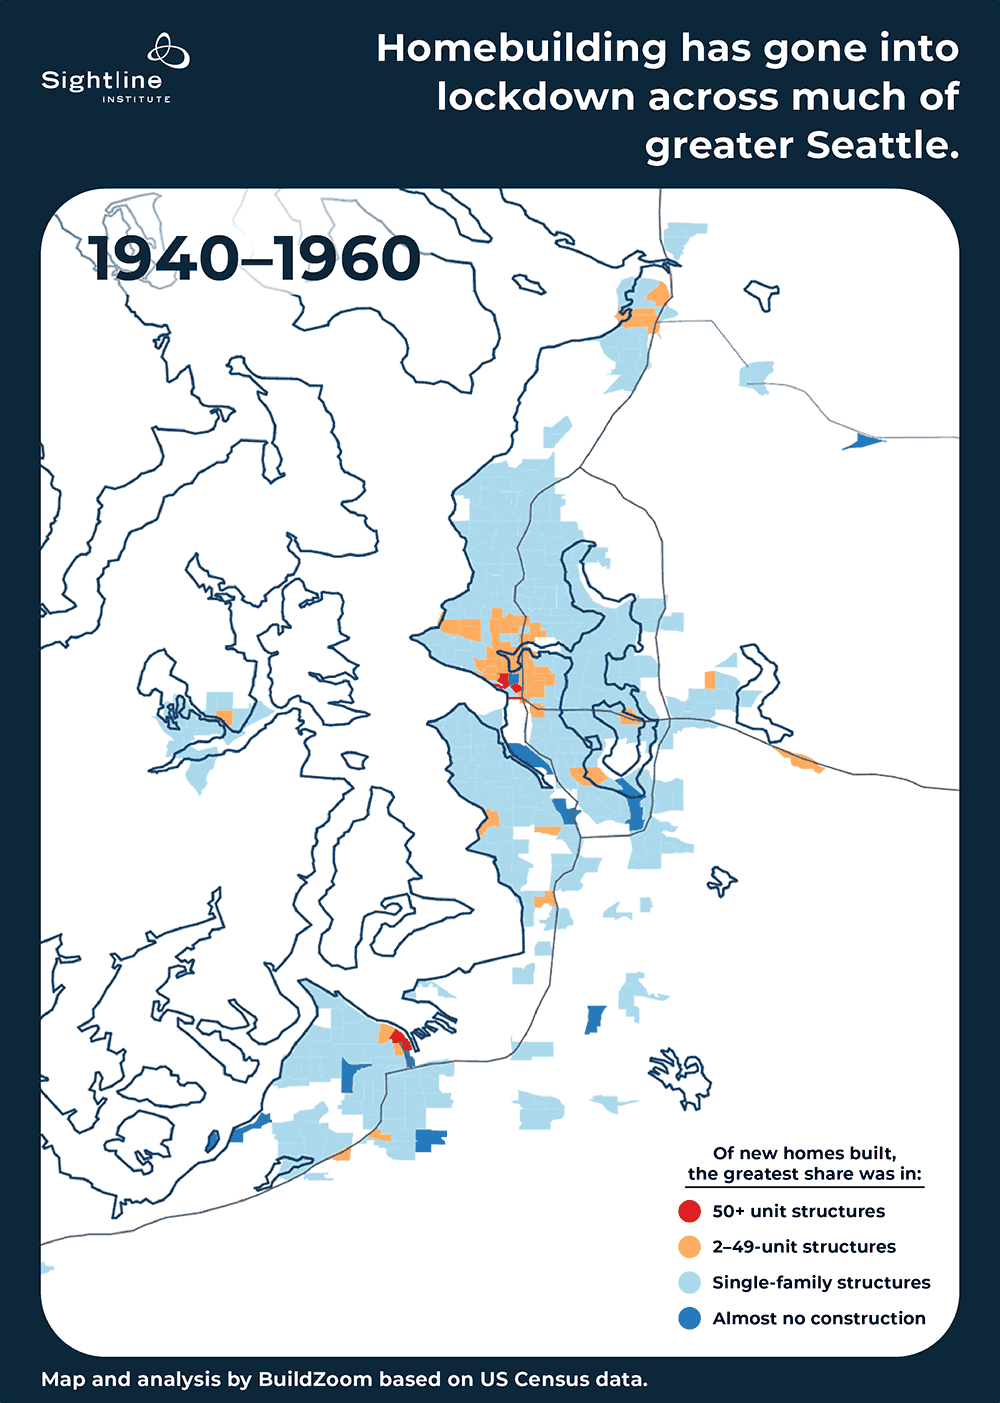
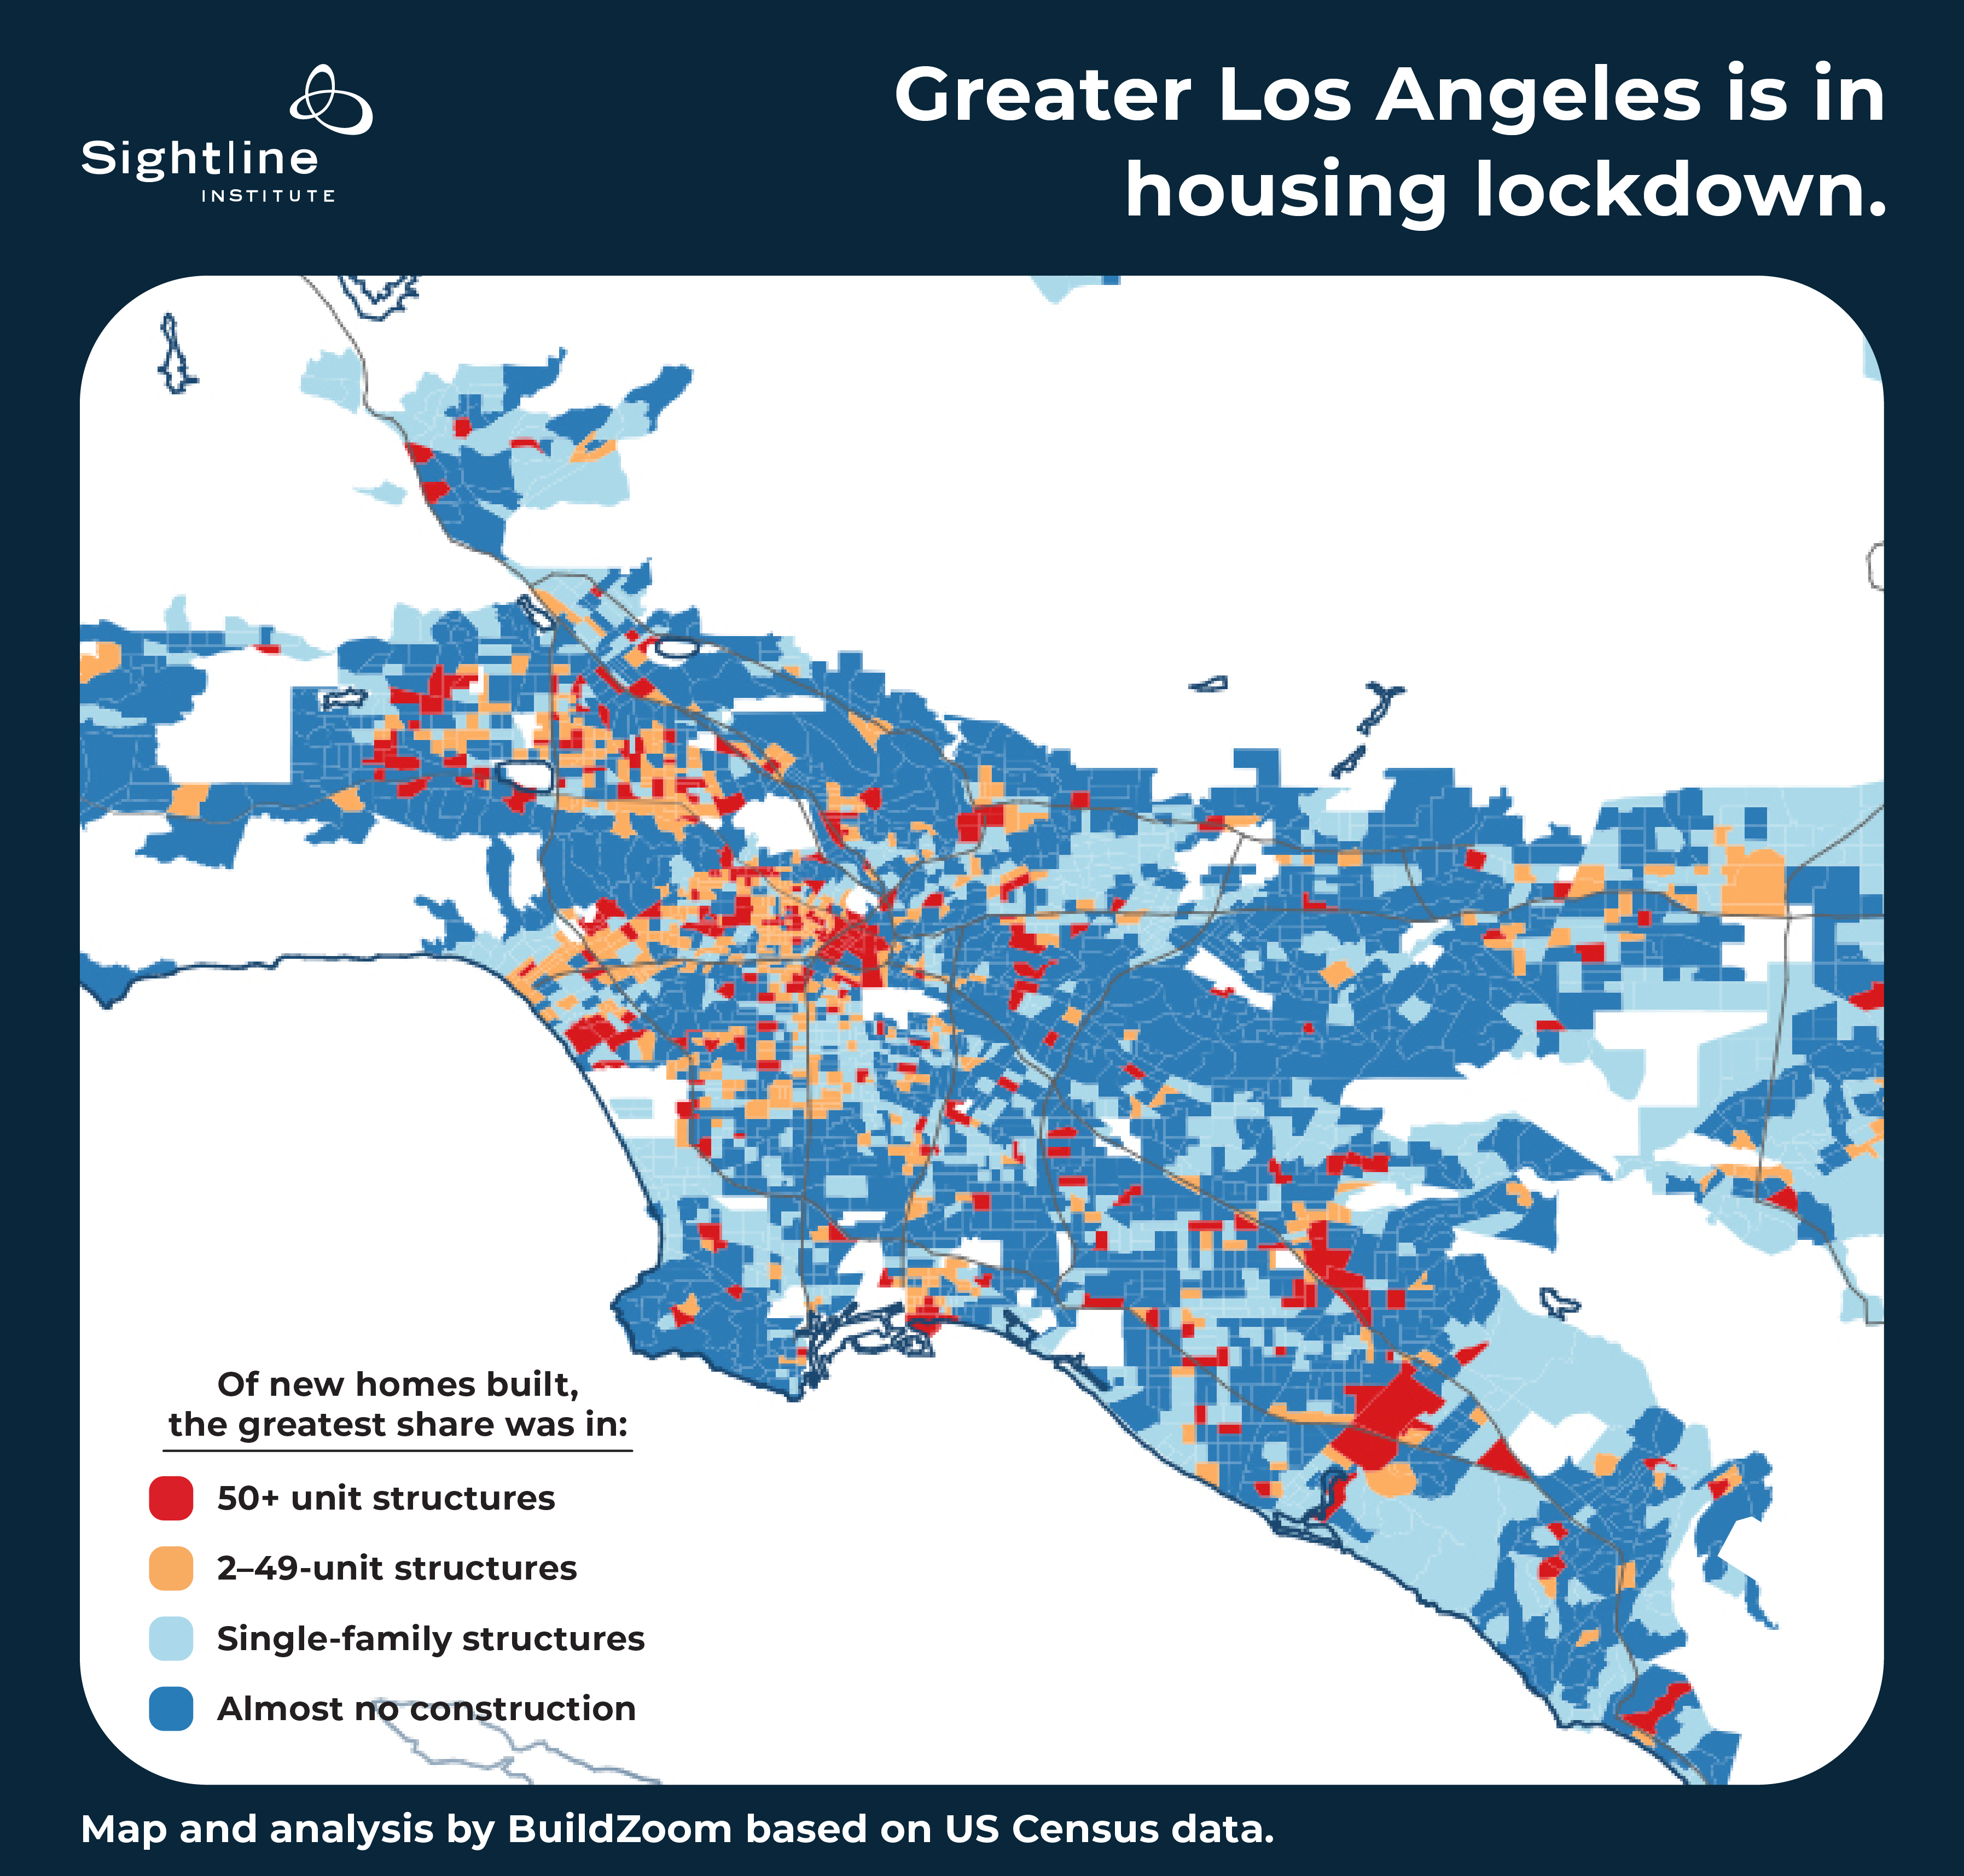
The nodes of red are much needed, but far more of them would have been needed to accommodate growing populations. To do that, prosperous cities need an abundance of middle housing too. Yet, in the years from 2000 to 2016, Romem found virtually no new homes on 31 percent of greater Portland’s developed land area and on 40 percent of greater Seattle’s. Greater Portland and greater Seattle are not alone among US cities in quashing in-fill housing; in fact, they are nowhere near the worst. In greater Los Angeles (shown below), the equivalent figure was 52 percent, and in greater San Francisco it was 58 percent. Romem’s maps show endless variation on the theme of metro areas in housing lockdown.
What causes lockdown?
The pattern of home construction Romem documented is no coincidence. It is a choice. It is the physical manifestation of land-use laws written by thousands of local planners, town councilors, and planning commissioners. And these plans, written by different people but all written in response to the same incentives, are strikingly similar. The incentives align to lock new homes out of single-detached neighborhoods. To end lockdown, therefore, it is essential to understand those incentives—and that is the topic of the next article in this series.
Next time: The motives behind restrictive local zoning rules.
