
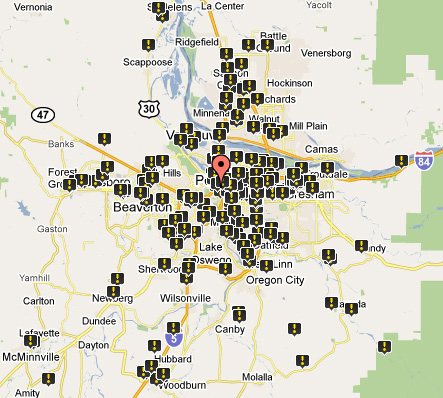
From the realm of ghoulishly fascinating comes this tool, launched last month by Transportation for America: Dangerous by Design, a map of all pedestrian fatalities from 2001 to 2009. Not only does it show you where they happened, it tells you the age, gender, and race of the victim along with a photo of the street where it happened. (H/t to Price Tags)
Here’s Portland:
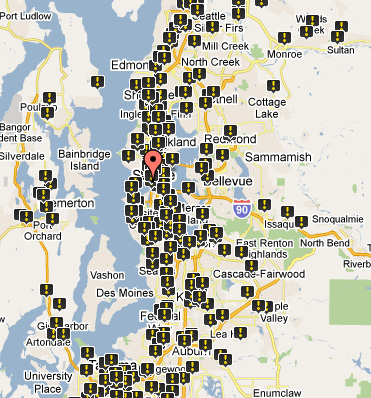
And Seattle:
It’s certainly strikes a chord. After all, just about everyone is a pedestrian some of the time. And it’s a good reminder that we can work to make our streets safer for everyone.
The maps make me glad I don’t live in Florida. What do you find most interesting?

Looks like pedestrians are killed only in areas where there are both roads and people.
There needs to be a denominator to make sense of this – are more people killed in some locations than others? Overlay this on walkscore, or density, or road-kms or vkt per inhabitant, see what pops out.
It’s tough to tell what this all means if there is no way to understand how the number of fatalities varies against, well, anything. That said, this is an important piece of data, but it needs some interpretation.
I notice something arguably anecdotal that jumps out at me. Queen Anne Hill has no pedestrian deaths. We have quite a few people and cars on our hill, but notoriously slow traffic speeds. Many/most of our roads are 1-lane (not in each direction – 1 lane total) and the hill has a great many traffic circles. The few that technically occur on QA Hill were on or next to Aurora – the (damn) highway built right through our city.
I agree with D – this map could be very useful with data like population density or traffic speed added.
In fact, paging through Seattle I see almost zero fatalities anywhere except at freeways, highways, or major arterials.
Actually, paging through much of the whole Seattle region I see almost all fatalities not at arterials to be the very old and the very young. And I can’t find any at an intersection that looks anything like a Queen Anne street – they’re usually at Renton style intersections (oh, and Renton seems to have quite a few non-arterial deaths).