Honest Elections Seattle, the citizens’ initiative to hold elected officials accountable and give ordinary voters a stronger voice in local elections, is financed by a special property tax levy of $3 million per year.
To you or me, that may sound like a lot of money.
For a city like Seattle, though, it’s “budget dust,” in the words of Bill Finkbeiner, former Republican leader of the Washington State Senate.
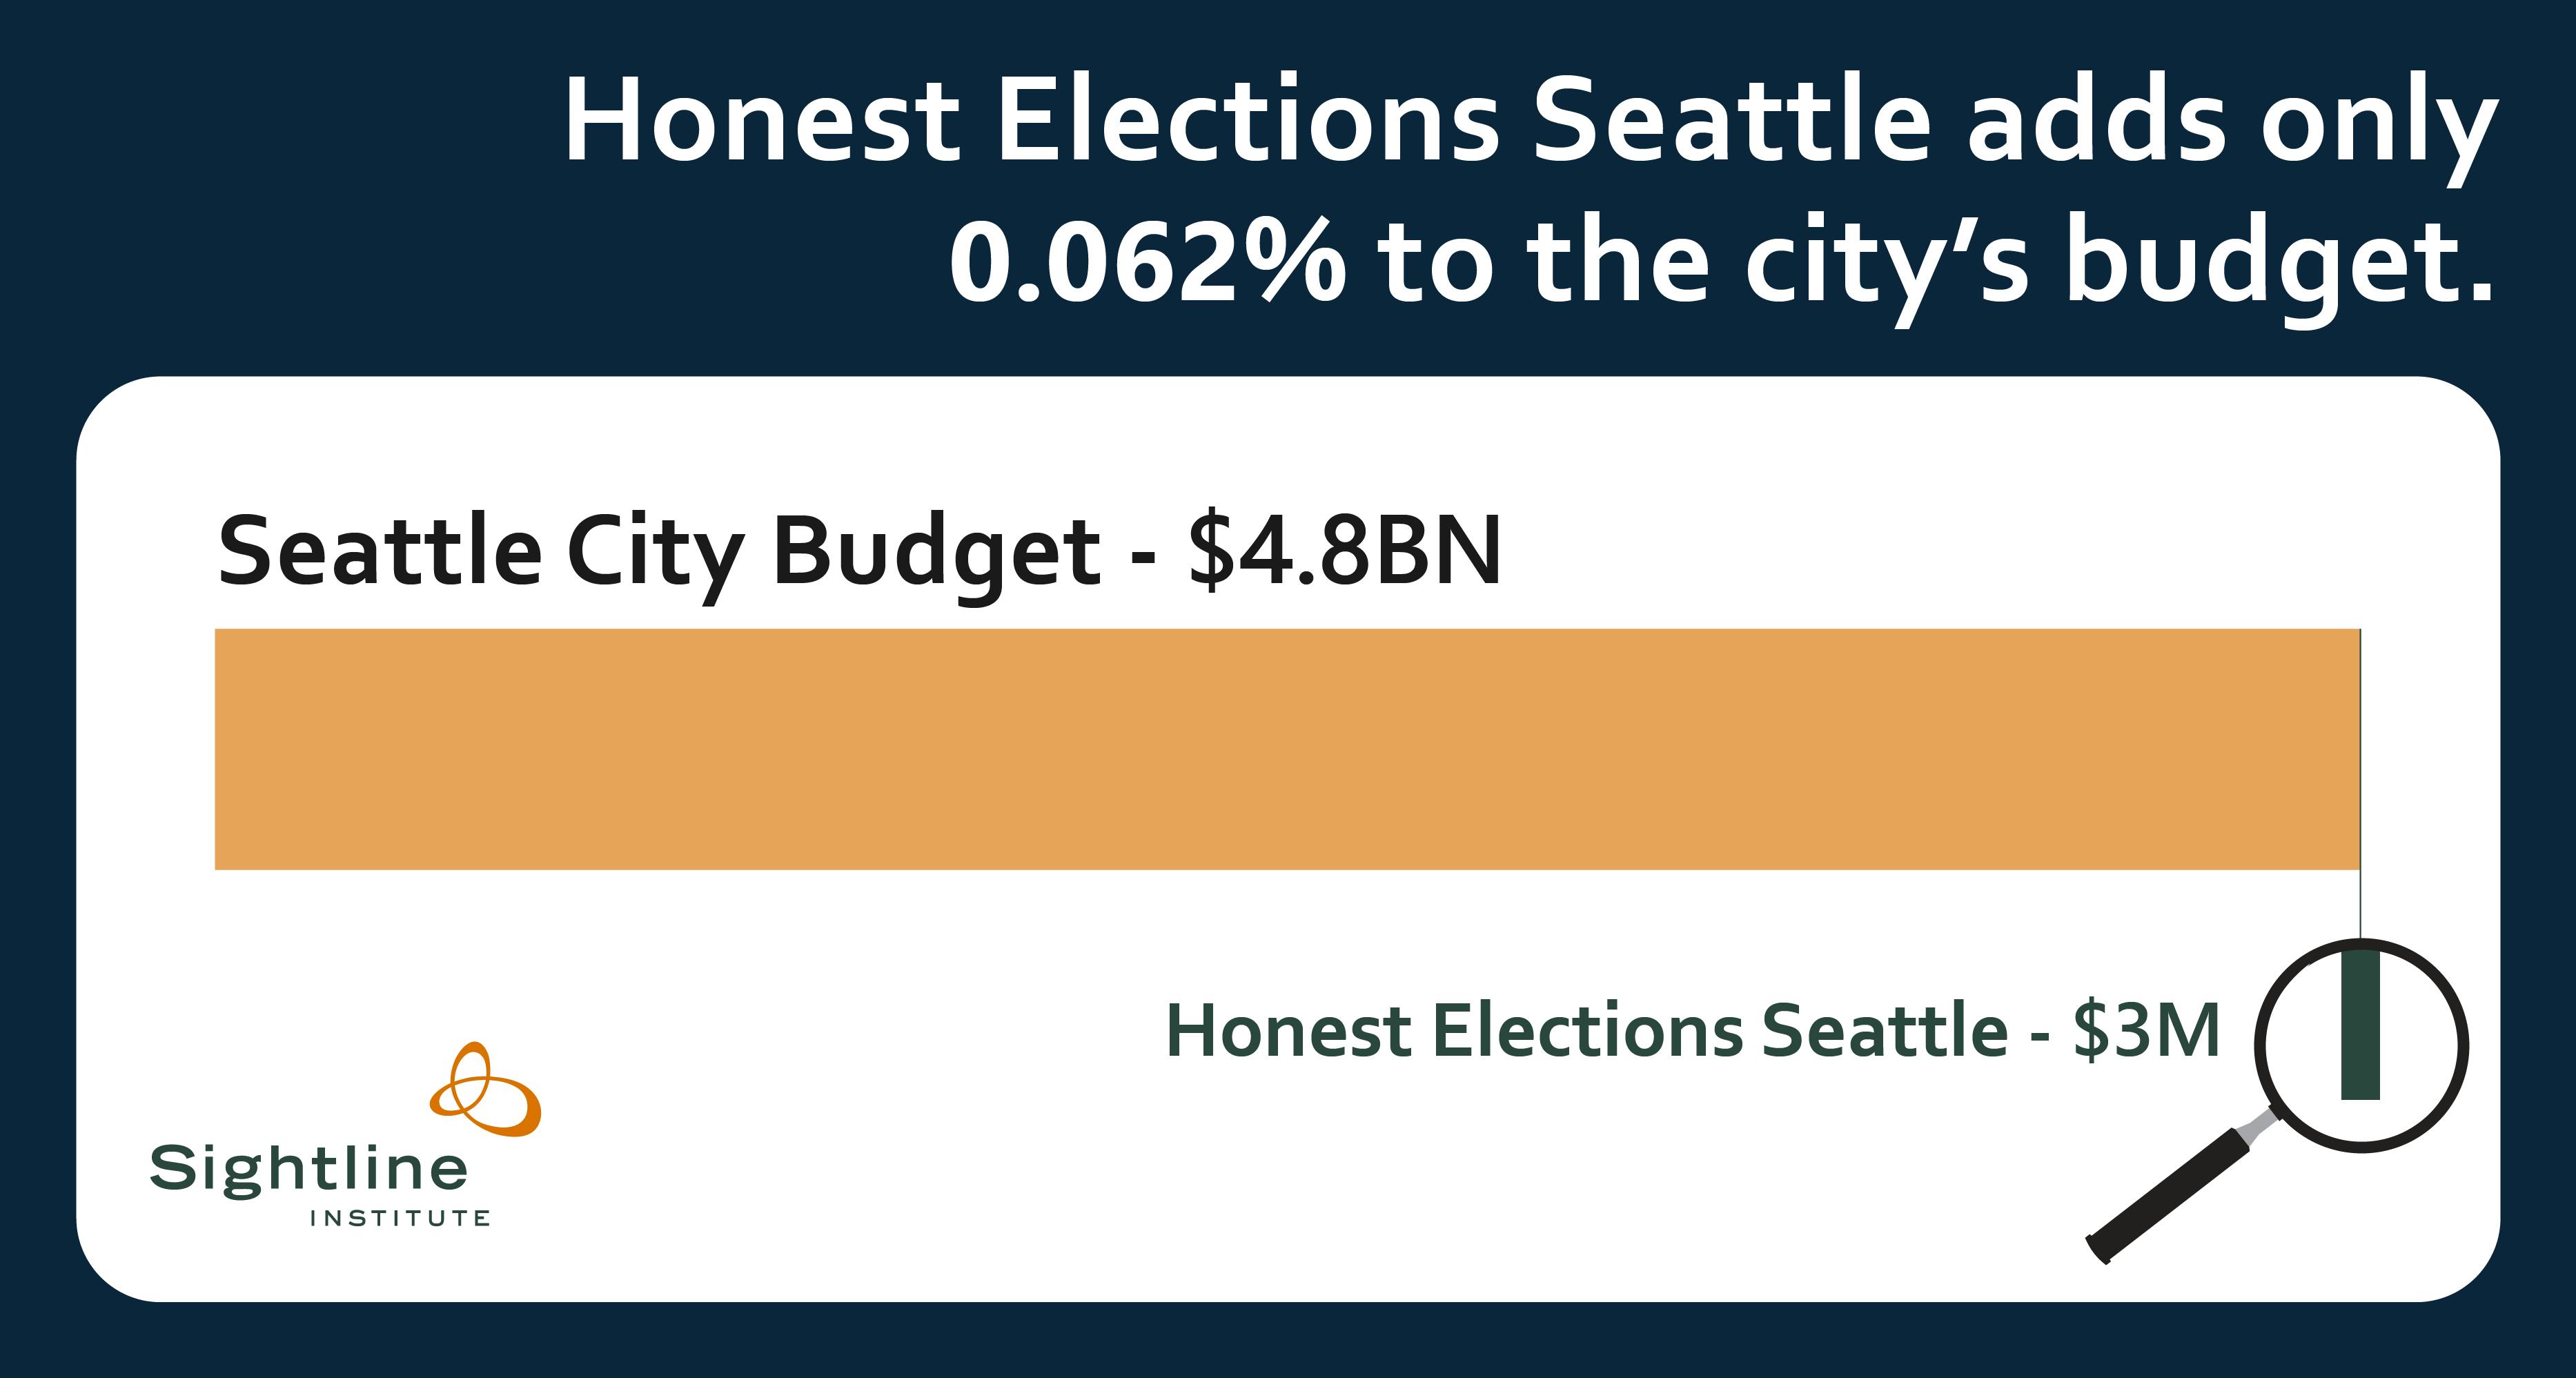
Seattle’s 2015 budget is $4.8 billion. Honest Elections Seattle will increase that by 0.062 percent. On this bar chart, you need a magnifying glass to see the increment of dust.
What else costs $3 million in the Seattle budget?
- Two months of operations at the Police Department’s South Precinct
- A year’s worth of landscaping and tree maintenance (see Urban Forestry)
- One week of work on the city’s share of viaduct and seawall replacement (see Major Projects)
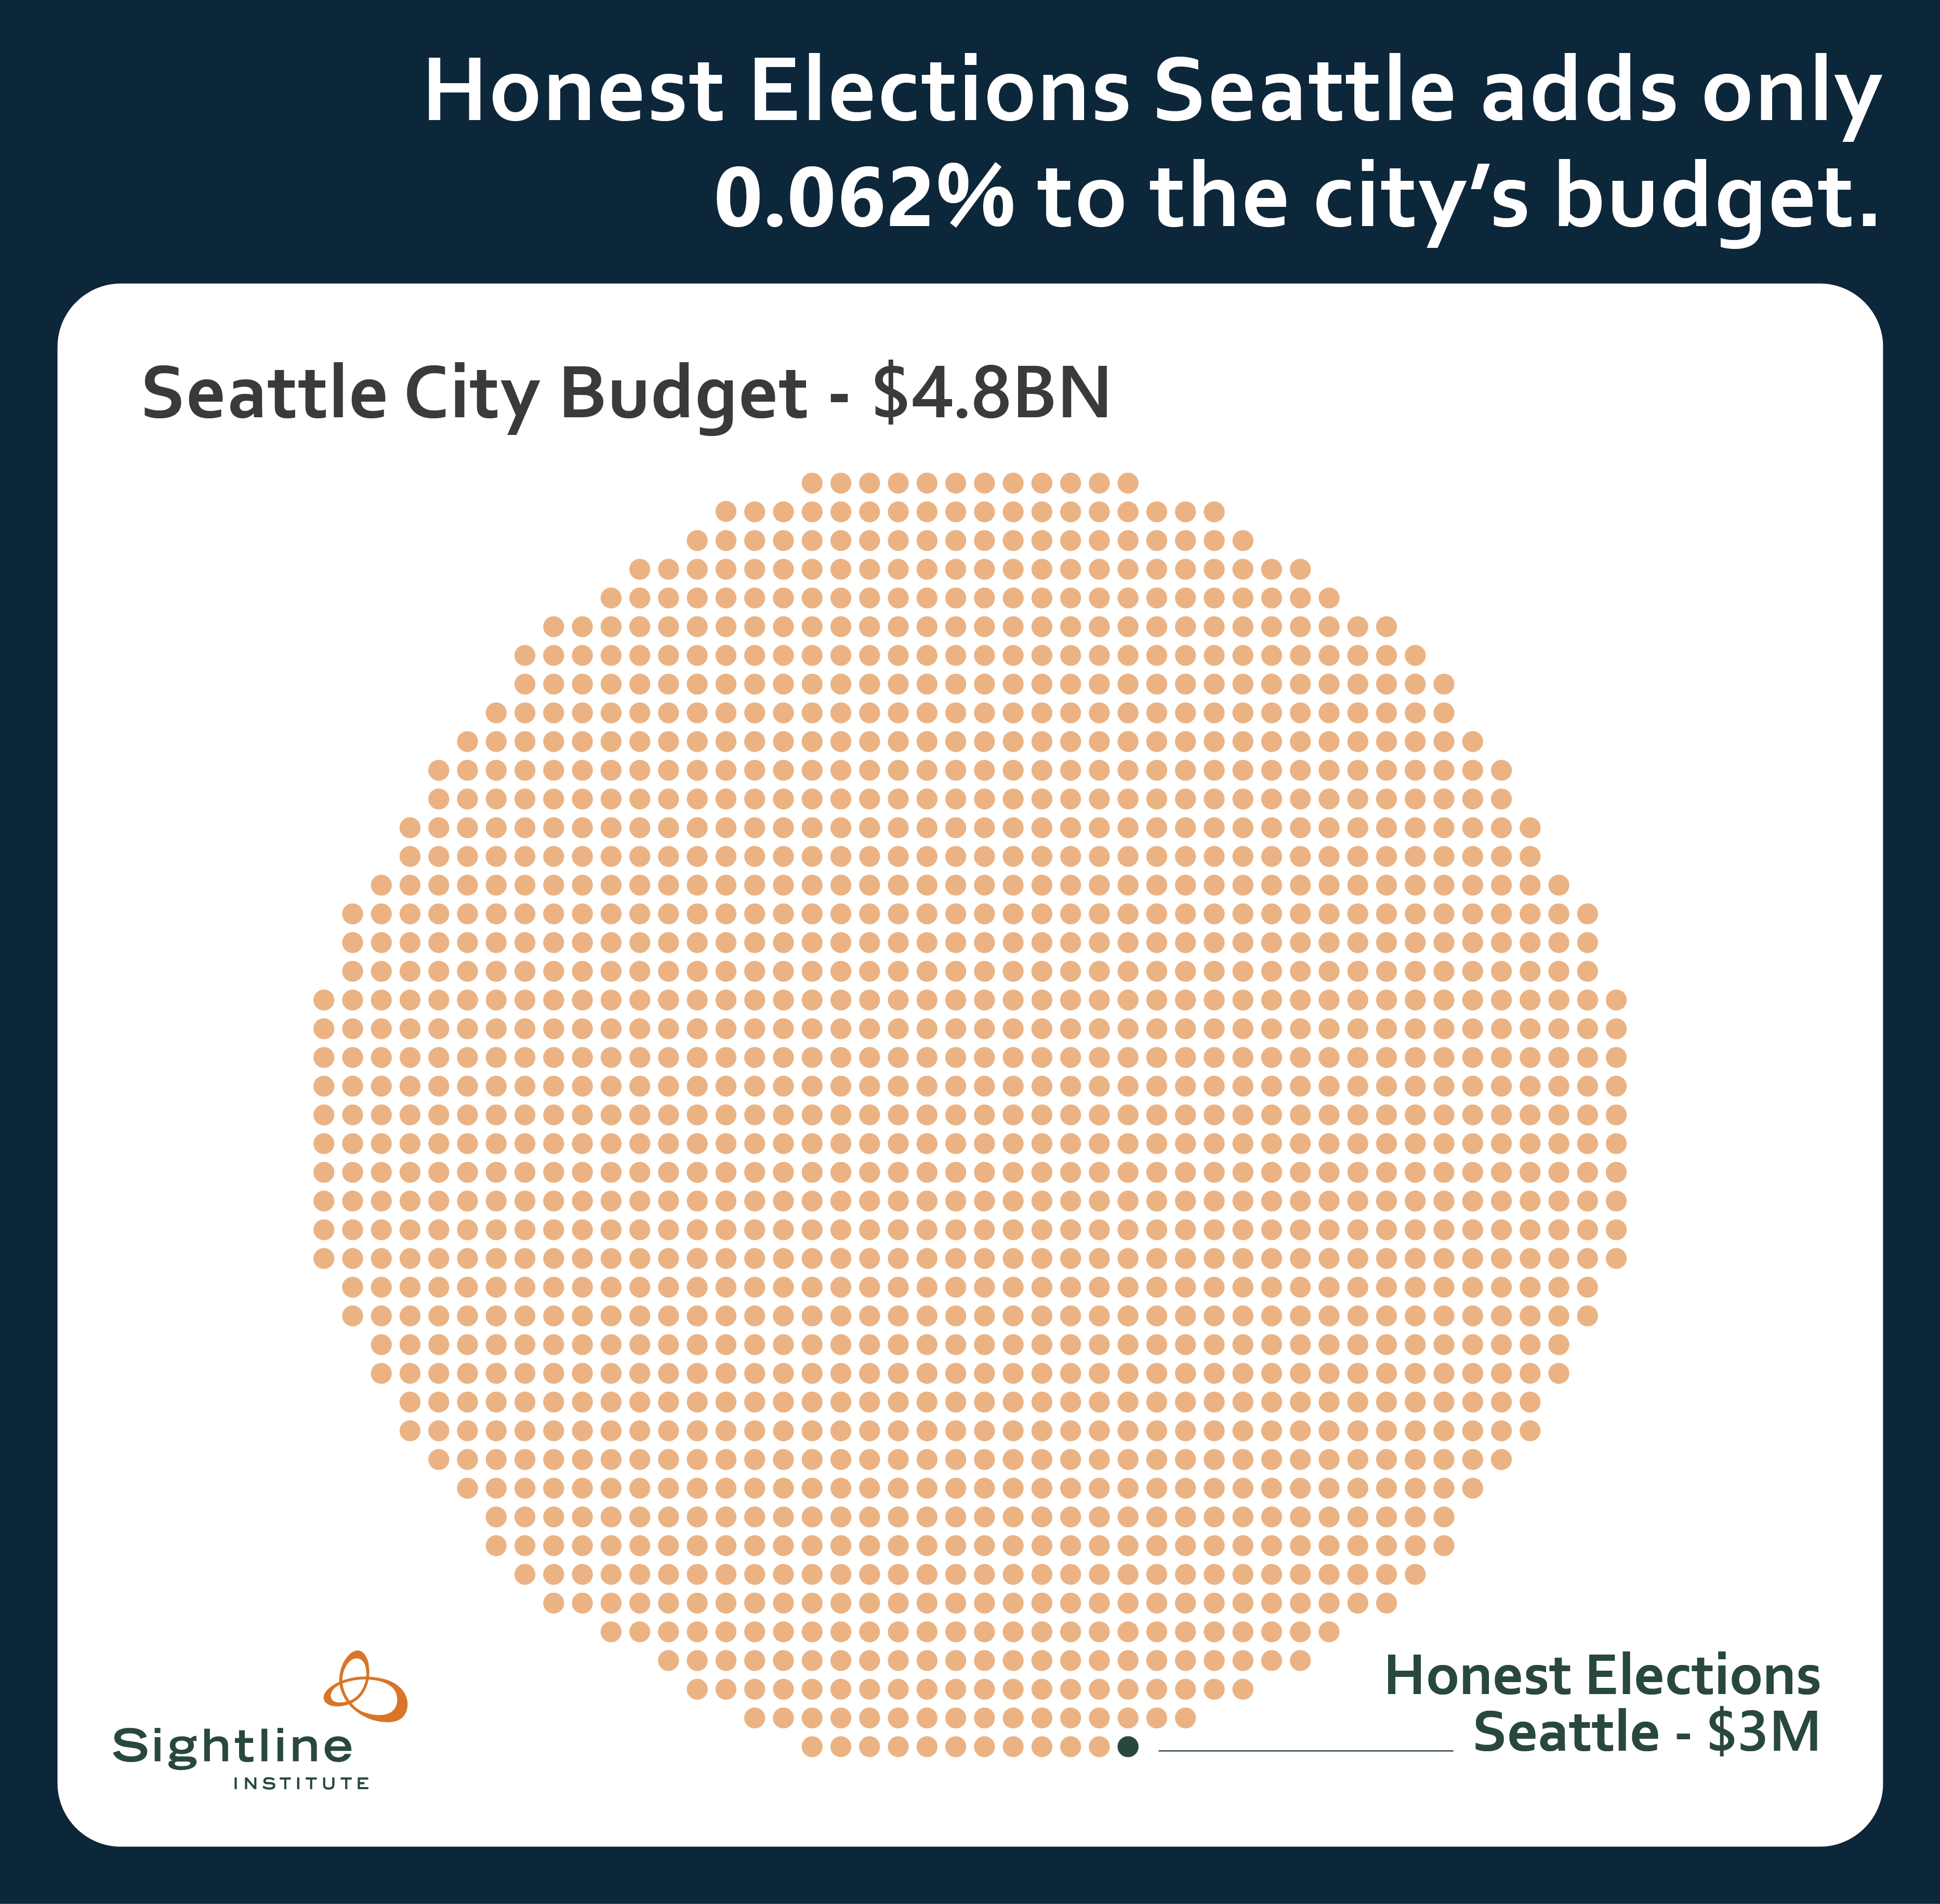
Those may all be worthy expenditures, but staving off Big Money is surely worth as much. In the illustration below, Honest Elections Seattle is visible, barely, because each dot represents $3 million in the city budget.
In Seattle’s budget, $3 million is also the same as the annual interest on the bond issue, sold in 2010, for improvements to City Hall (see Table 5, page 8). A mortgage payment on city hall and a program to keep city hall accountable to the city’s voters—for the same low price!
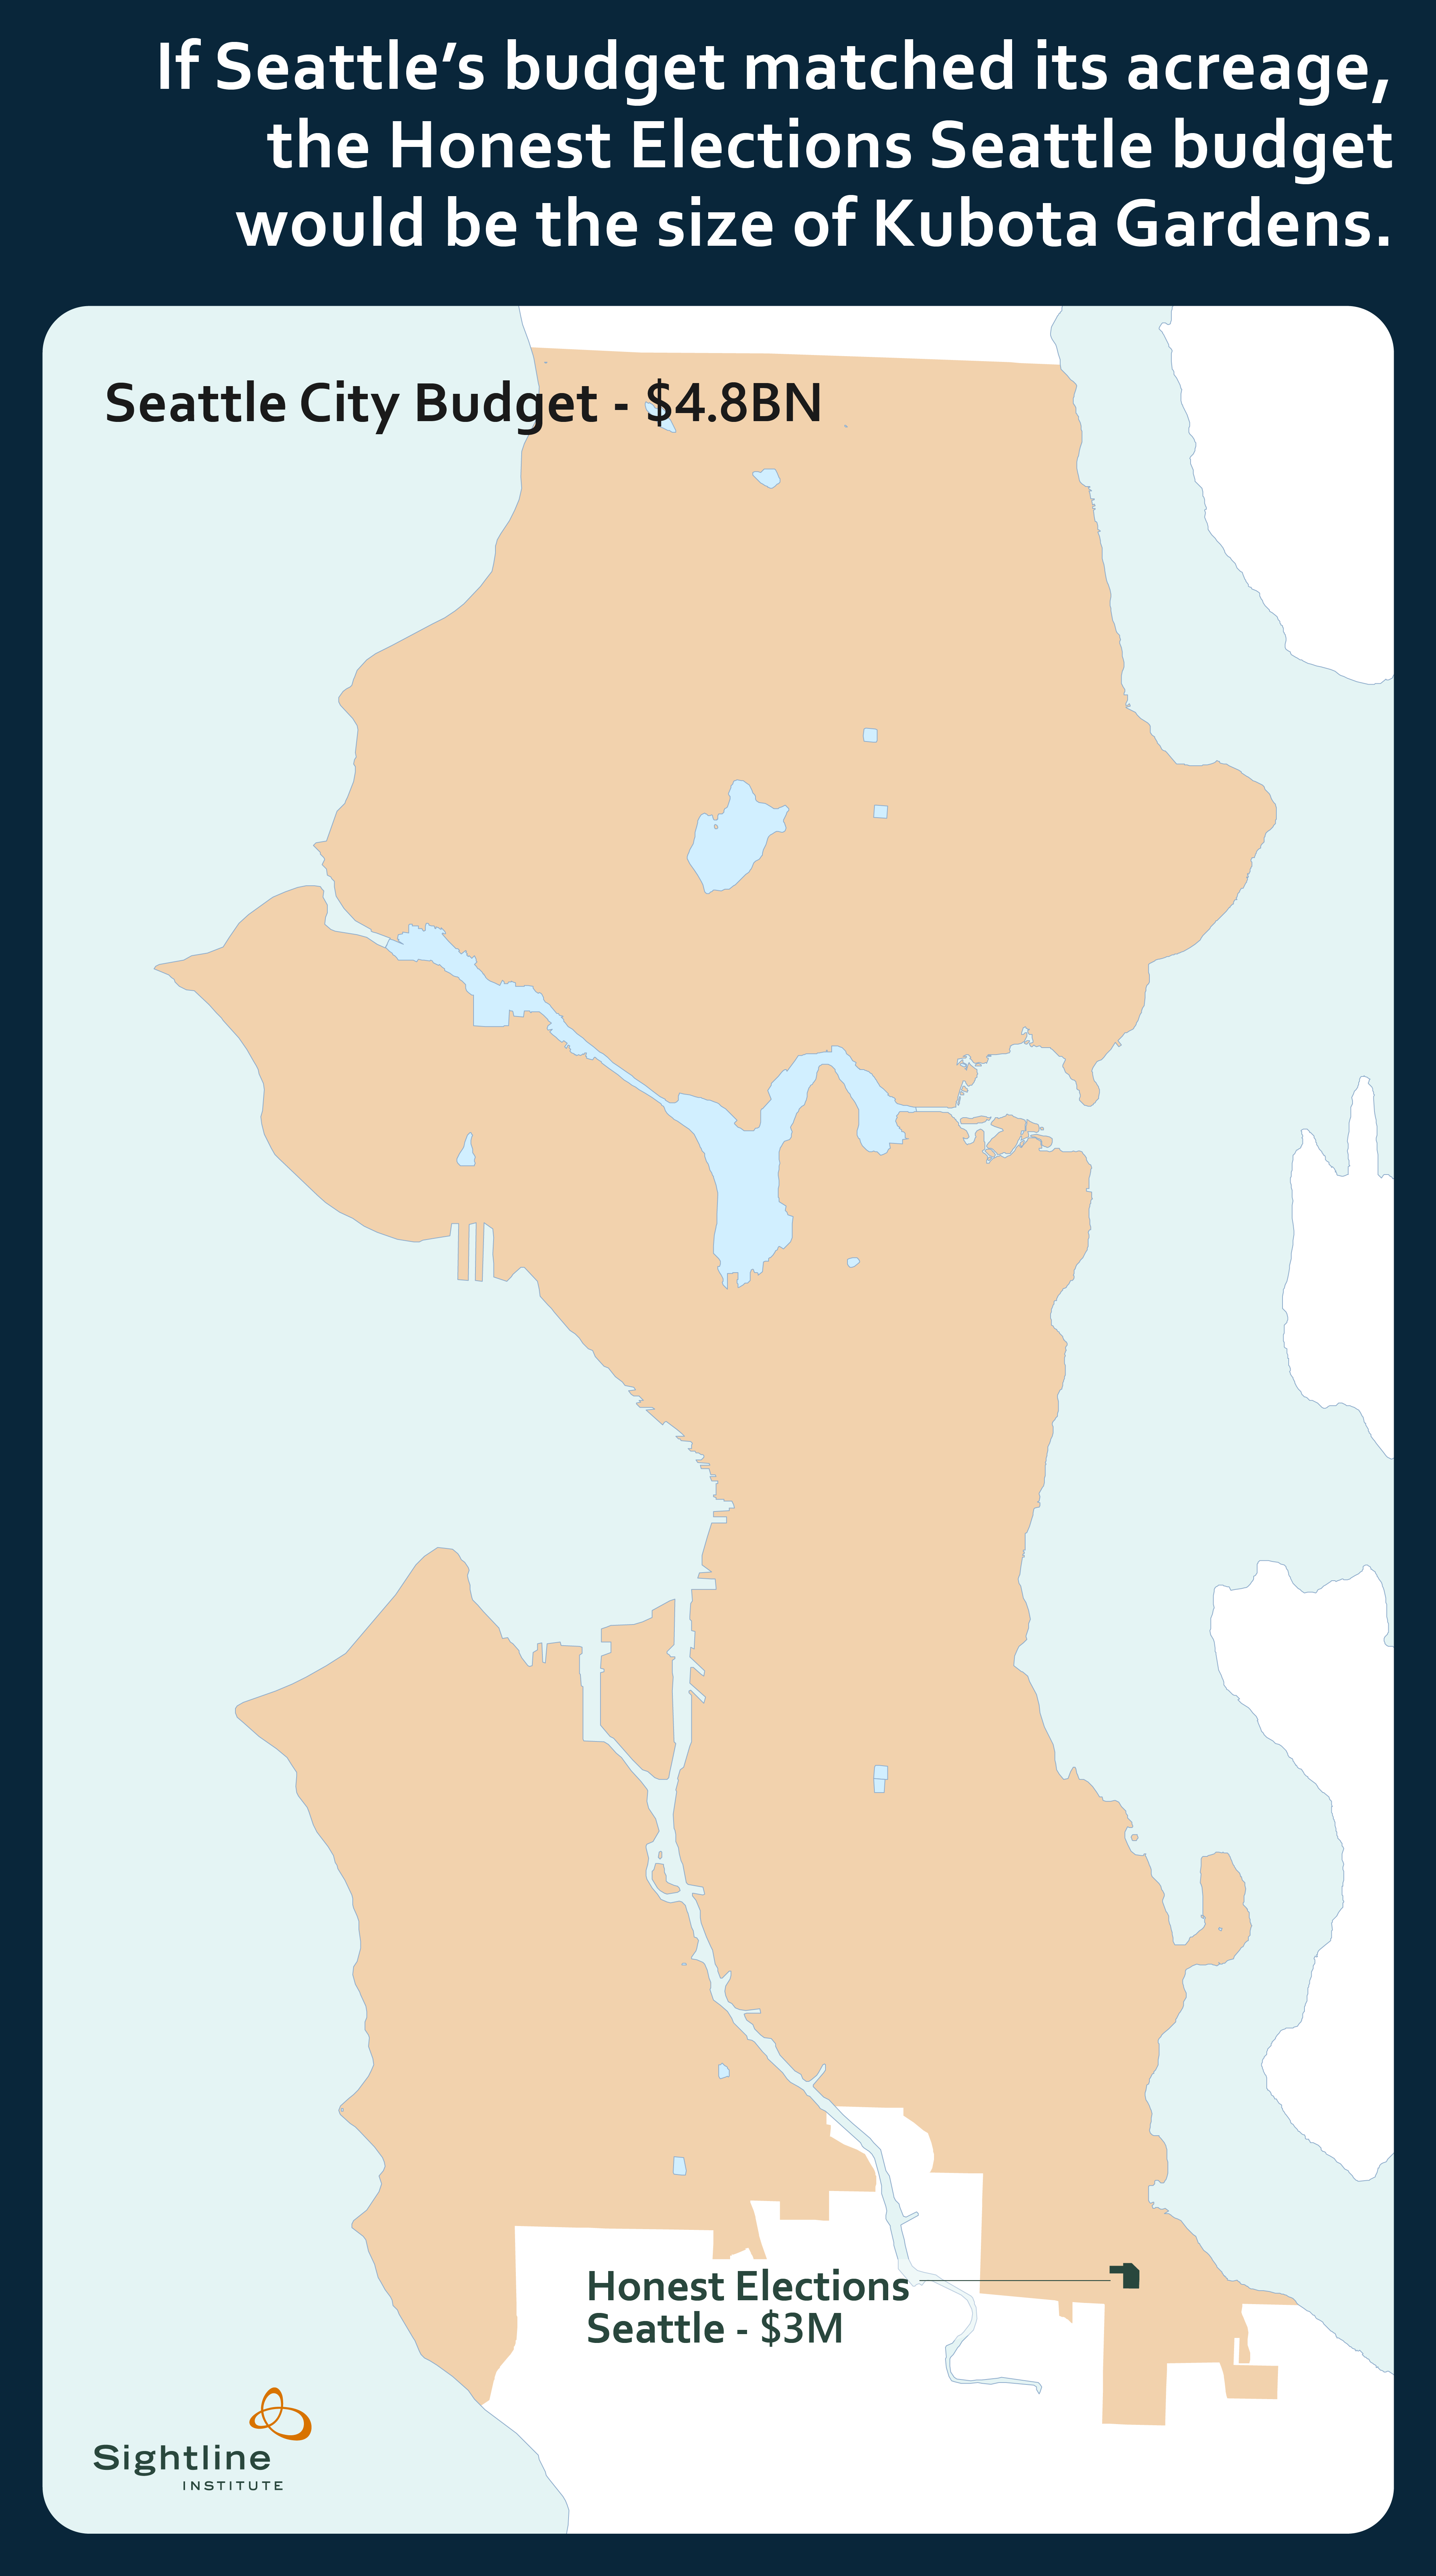
The map below shows Seattle, with an area equal to 0.062 percent colored in: a plot of land the size of the city’s Kubota Gardens.
Honest Elections Seattle is a picayune tax by historical standards, too: adjusted for inflation, it’s the smallest voter-approved levy in city history.1 It’s so small that those of us who designed it gave the city council the option to not bother collecting it. If there’s money elsewhere in the budget, I-122 authorizes city leaders to cancel the levy and fund Honest Elections from those sources.
Likewise, it’s a trifle for typical property tax payers in the city. At 1.94 cents per $1,000 of assessed value, the owner of a $400,000 house will pay 65 cents a month—$7.76 a year—to safeguard city hall from the corrupting influence of Big Money.2 The overall tax rate on Seattle properties is well over $10/$1,000, so even the increase is a rounding error.
$100 of vouchers for only $7.76?
Right about now, you may be wondering how Honest Elections Seattle can operate for only $3 million a year while it grants Democracy Vouchers worth $100 to each of the city’s 415,000 registered voters, which they may donate to candidates who agree to play by the Honest Elections rules. Shouldn’t it cost $41.5 million? True, it would cost that much if all voters in Seattle actually could and did use their vouchers, but sadly, they won’t. Far fewer than half of voters bother to cast ballots in primary elections in Seattle. A tiny fraction ever attend even a single precinct caucus.
[prettyquote align = “right”]For a city like #Seattle, @HonestSEA is mere “budget dust”.[/prettyquote]
What’s more, strictly speaking, not all vouchers can ever be redeemed. Voucher candidates agree to limit their spending in exchange for receiving public funds: $800,000 in a mayor’s race, for example, or $150,000 for district council races. The limits are high enough to run competitive campaigns, but still, the sum of all the candidates’ spending limits is as much as the city will ever have to pay. That sum is a small share of the face value of all the vouchers.
For example, in the 2021 election for mayor, two at-large city councilors, and city attorney, the sum of all candidates’ spending limits—assuming huge numbers of candidates (six for mayor and four for every other seat), that all of them fundraise exclusively through vouchers, and that they all hit their spending limits—is about $6 million. More likely, city outlays will not exceed $4 million even in a heavily contested election year. Those amounts are still more than one year’s tax collection of $3 million, but elections take place only in alternate years. Annual tax collections will yield $6 million per election cycle, and low-cost cycles will yield surpluses that accumulate to cover the higher price of mayoral races.
The $3-million levy allows full funding not only of all voucher candidates but also of the Seattle Ethics and Elections Commission’s (SEEC) administration of the program, which will cost an estimated $650,000 a year, on average. (The single largest expense will be printing and mailing vouchers to 415,000 voters every other January.) Four million dollars is about 10 percent of vouchers in circulation—a more-than-fivefold increase in public participation in funding campaigns compared to 2013.
[prettyquote align = “left”]”At 1.94 cents per $1,000 of assessed value, the owner of a $400,000 house will pay 65 cents a month—$7.76 a year—to safeguard city hall from the corrupting influence of Big Money.”[/prettyquote]
Will people object that their vouchers went wanting? Doubtful! What’s likely to happen is that about 1 percent of voters—the same people who are so involved in public affairs that they already routinely make donations to local candidates—will receive their vouchers and send them off, unprompted, to candidates they support. The rest of us will set our vouchers aside and not think about them unless a friend invites us to a voucher party or a candidate comes to the door or we hear a speech that inspires us to act. When candidates reach their limits, they will stop asking for our vouchers, and we’ll stop giving. Few people will notice the unused vouchers gathering dust in their bill piles, just as they pay no heed to the ballots they never complete.
In any event, if Seattleites prove much more, or less, responsive with their vouchers than expected, SEEC can adjust the program’s parameters between election cycles, as I explained last time, by distributing fewer or more vouchers or raising or lowering the face value.
No blank check
As an added safeguard for the city treasury, the sum of the spending limits is written into the Honest Elections Seattle Initiative as the city’s budget cap in each election year. The cap is set at no less than the amount needed for six primary and two general election candidates for each position to spend their respective spending limits using Democracy Vouchers only. It’s almost inconceivable the city will need to pay out this much in voucher funds: on average, fewer candidates will run; they will collect more private money; and many of them will fall far short of their spending limits. In fact, the program may cost even less than $3 million a year.
[prettyquote align = “right”]That’s why Honest Elections Seattle is such a shockingly good deal: it gives a real voice to ordinary voters, and it costs chump change.”[/prettyquote]
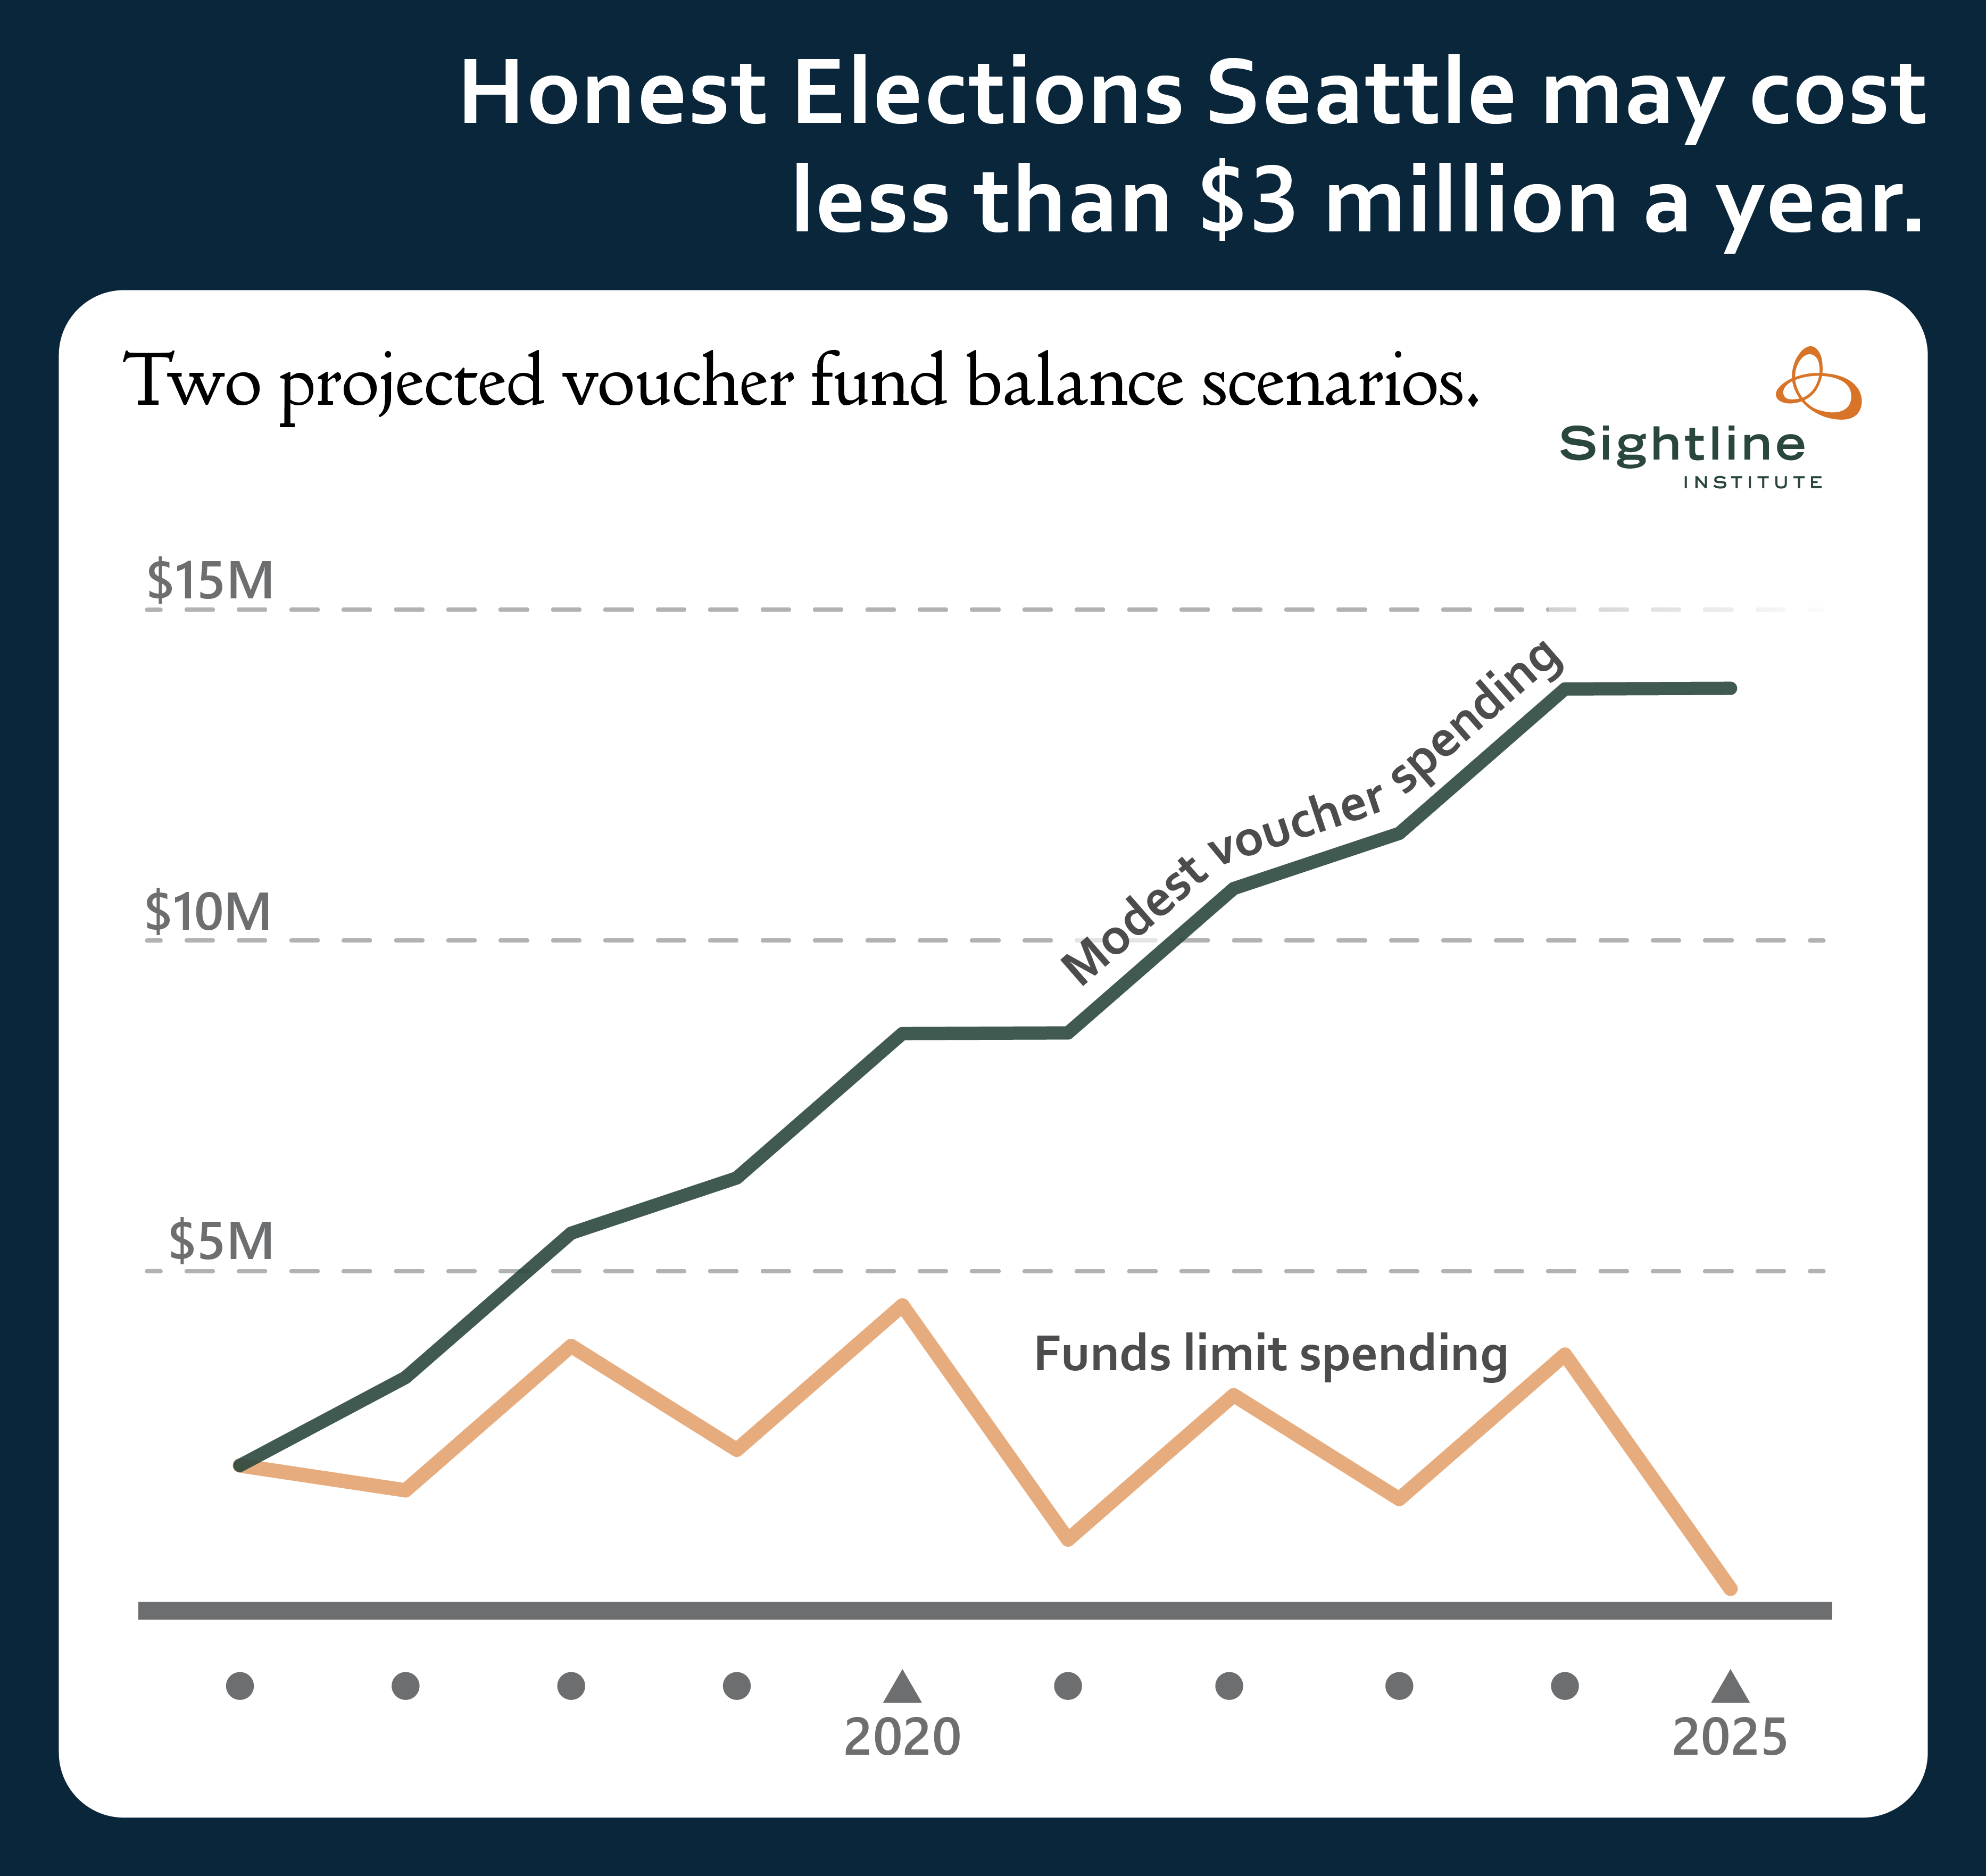
The figure below shows the balance in the program kitty under two scenarios. In the case of the upper line, the number of candidates in city races stays similar to what it’s been in the recent past, and those candidates collect Democracy Vouchers plus small donations to assemble money on par with past average campaign budgets. Even after paying the administrative costs of the voucher program, the balance in the fund accumulates steadily. If the program unfolds this way, the city will likely choose to collect less than the $3 million authorized per year. The lower line is the almost-inconceivable scenario described above, in which the city spends its program budget cap every single election. Even in this scenario, the program kitty remains solvent all the way through 2025. In either case, SEEC will adjust the program between elections to keep it adequately but not excessively funded.
Little Big Money
Modern politicking is so expensive that running a competitive campaign for office is impossible for people who lack a rolodex of well-off donors, even at the local level in the Northwest. But spending on political campaigns is a rounding error when compared with public budgets. That’s why Honest Elections Seattle is such a shockingly good deal: it gives a real voice to ordinary voters, and it costs chump change.
NOTES
- Technically, the 1995 low-income housing property tax levy came in two parts—a levy lid lift and a special levy. At the time, everyone thought of them as a single measure, and they passed by the same margin. Still, the former was smaller than Honest Elections Seattle, so to be technically correct, Honest Elections Seattle is the smallest free-standing property tax levy, measured in per-year collection, since at least 1968. It’s conceivable a property tax levy vote before 1968 was smaller than Honest Elections Seattle, even after adjusting for inflation. I have yet to find archival data before that year. The city archivist and budget office do not have lists extending earlier than 1968. One reason to doubt pre-1968 levies were smaller is that before 1985, levies were uncommon. The city mostly proposed bond measures in those days.
- My calculations suggest that the Honest Elections Seattle’s levy (authorization of) $3 million per year amounts to 2.5¢ per $1,000 of assessed value of Seattle real estate, or 85¢ per month for a $400,000 house. The City of Seattle, when it drafted the ballot title for the Honest Elections Seattle Initiative, stated the levy as 1.94¢ per $1,000 of assessed value, which works out to 65¢ per month for a $400,000 house. The city probably has more recent data on which to base its estimate than I have access to (I have this), so I am relying on its estimate. UPDATE, May 4, 2015: The City Attorney’s Office has confirmed that its 1.94 cent estimate is based on an updated projection of 2016 assessed value for Seattle. The 2014 and 2015 assessed values are available here (click the first item under “2014-2015 comparison”).

This Measure Discrimates
If you want to be Honest Your campaign is violating its own law
You have hired a firm to collect signatures and they don’t have
badges or signs when they r out collecting.
Thanks for sending paid petitioners out collecting your signatures
and tell the truth about Seattle Campaigns. I dont see big
money in Seattle Campaigns. I only see big money coming from
special interest groups like the SEIU AnD fuse. lIEING TIO THE
VOTERFS OF THIS CITY DOES NOT HELP YOUR CAUSE…..
Wait Steve, please explain this to me… you want to benefit from the result of the Honest Elections Seattle initiative, once passed, before you even sign the petition to get it on the ballot?
Its ok Please explain.
I didnt say I wanted to benifit from Honest Elections.
I am a Seattle Voter I dont believe in putting
$30 Million into poltical campaigns. I also dont believe
the City should spend another $ 1 million defending this
in court when we dont have the money to spend on Public
Housing. It discriminates against people also.
The people that benefit from the Results of this
r the candidates that can raise the money to win
a City Office. What good is that to democracy ?