
The 2014 Canadian Transit Scores are out…and Vancouver, BC clocks in as the third most transit-friendly city in the Great White North, narrowly bested by Toronto and Montreal. Pretty good, eh?
 (Used with permission)")
But what’s even better: when you combine Canada and the US, Vancouver comes in at number 6! The only US cities with a better Transit Score than Vancouver are New York, San Francisco, and Boston.
Looking more narrowly within the Cascadia bioregion, Vancouver’s Transit Score beats the pants off its nearest two rivals. Portland and Seattle both do pretty well within the US, with Transit Scores of 50 and 57, respectively. But Vancouver shellacks both cities, with a score of 74.
So why does Vancouver’s Transit Score outstrip Seattle’s and Portland’s so handily?
The Transit Score methodology rates a location’s transit-friendliness by its proximity to transit stops and the frequency of transit service. Rail, cable cars, and ferries count more than buses towards a location’s Transit Score. To score a whole city, the Transit Scores of individual locations throughout the city are weighted by nearby population, then averaged.
One of the consequences of this methodology is that a city can boost its Transit Score either by boosting transit service, or by boosting the number of people near high-quality transit.
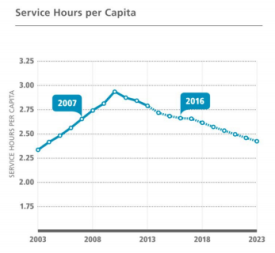
Compared with both Seattle and Portland, Vancouver’s done both. Translink has substantially increased per-capita transit service hours over the past decade (though there’s been a downward trend in recent years, and further cuts loom). Greater Seattle has boosted service too, but not to the same extent as Translink; and Portland’s service hours have actually declined slightly over the past few years.
And perhaps more importantly, the city of Vancouver has far more people living in compact, transit-friendly neighborhoods than either Seattle or Portland.
In short, Vancouver’s done a lot of things right to earn its high Transit Score…suggesting that Seattle and Portland still have a lot to learn from their northern neighbor.

No doubt about it, Vancouver has a terrfic transit system. But to me, Transit Score is not nearly as reliable as Walkscore. The simplistic assumption that rail service is always better than bus service is by no means always valid. There are far too many American light rail lines with service every 30 minutes, and commuter rail lines with service every 60 minutes–or no midday service at all. These lines are not superior to bus lines that run every 15 or 30 minutes. Nor does Transit Score have any way to assess the breadth or importance of destinations served from a given point. Transit Score perpetuates the unthinking anti-bus bias that has led to so many bad investment decisions.
In general I agree with you, Wanderer. I wish that Transit Score measured what you can get to in transit, rather than just service frequency nearby. But I think you may be mistaken about how it treats light rail: it’s not *always* better than bus. It does, however, give a numerical boost to rail systems, based on the observation (or perhaps belief) that many people are willing to walk a longer distance to rail than to bus.
But there’s another way that bus-based systems can actually give a city an advantage in Transit Scores. Rail stops in many cities tend to be fairly spread out, meaning that people have to walk farther to them…which can lower a lot of people’s transit scores. If there’s a bus stop every 4 blocks but neighborhood rail stops are 20 blocks apart, you might actually see higher aggregate transit scores along a bus corridor than across a rail corridor.
A lot of my concerns about Transit Score are quibbles. I think it’s still a fairly good, if broad-brush, method for comparing transit-friendliness of cities. I don’t think it’s the final word, but it’s a great start…
Vancouver is the second least affordable city in the world in terms of housing, according to this study:
https://www.vancouversun.com/business/real-estate/Vancouver%20city%20world%20unaffordable%20homes/9413472/story.html
Seattle also is fairly unaffordable. That’s a good thing for governments that tax property and the sales of property, and not so good for young families of modest means. It all depends on your perspective . . ..
To date, we have spent over $9 billion on two SkyTrain ALRT/ART mini-metro systems and one heavy-rail metro, built as a light-metro (Canada Line) which is incompatible in operation with the ALRT/ART systems.
TransLink must operate a large bus services to feed the mini-metro lines as over 80% of SkyTrain’s customers (double the industry standard)first take a bus. The mini-metro combined with the bus system feeding the mini-metro has crippled Translink financially.
No one builds with SkyTrain anymore (only seven such systems have been built in 35 years) and for good reason as it lacks capacity and costs more to build, maintain and operate when compared to light rail.
The regional travel mode share for the auto has remained the same, at 57% since 1994, again despite a $9 billion investment in light-metro.
The cost per revenue passenger in Vancouver is over $1 more than Edmonton, Calgary and Toronto.
Capacity on the Skytrain Lines are now maxed out at about 15,000 pphpd in the peak hours and to increase capacity over $3 billion must be invested to enlarge stations, rebuild the guideways, install new software, replace the power systems and more in the next 20 years.
The Canada Line was at capacity when built and has not taken any cars off the road, as most of its ridership are former bus riders, now forced to transfer to continue their journey into Vancouver. A new $2 million park and ride lot in South Surrey that is empty and the reduction of bus services in south Delta to post Expo 86 days are a growing proof that projected ridership for the Canada Line just did not materialize.
The $2.5 billion Canada Line, which the judge presiding over the Susan Heyes (failed lawsuit against Translink) court case, called the bidding process for the Canada Line a “charade”. In fact the Canada line is notable for one thing, it is the only heavy-rail metro, built as a light metro in the world and has less capacity than a streetcar.
The city of Ottawa, under pressure from Ottawa to build with SkyTrain, sent a fact finding mission o Vancouver and discovered that the SkyTrain guidesways were deteriorating faster than first thought; costs more to build; more to operate and more to maintain than LRT. But what really tipped the scale for Ottawa is that they found that SkyTrain lacked the capacity that LRT was known to achieve.
Also not factored in in Vancouver is the 110,000 deep discounted U-Pass fares giving unlimited travel for post secondary students, who are compelled to buy them if they use transit or not. Paying just 10% or less than regular customers the U-Pass make a mockery out of ant statistic in Vancouver.
There is good reason that no one copies Vancouver’s transit, it is just not as good as many would have us believe.