With a greater diversity of home types comes a greater diversity of residents, who can enjoy and augment the benefits of walkable, amenity-rich neighborhoods.
When I first moved to Seattle, my family settled in my aunt’s accessory dwelling unit in West Seattle. We lived below her home in a small basement apartment, perfect for our family of three. It gave us our own space to make noise and cook meals yet also allowed my aunt to pop downstairs and get to know her great-niece (plus it gave us an on-call babysitter!).
A friend of mine—let’s call her Charlene—lives in a duplex in Wallingford. After she became a single mom, she found a duplex in her same neighborhood that offered a more affordable rent option than the single-family home she had been living in. It also allowed her daughter to maintain her friendships and social ties, rather than forcing them to uproot entirely.
Examples like these are all around because accessory dwelling units (ADUs) and duplexes pepper the map of Cascadia’s single-family zones. Having homes in a variety of shapes and sizes makes it possible for the smaller families or singles common in today’s cities to find homes there that suit their needs and budgets.
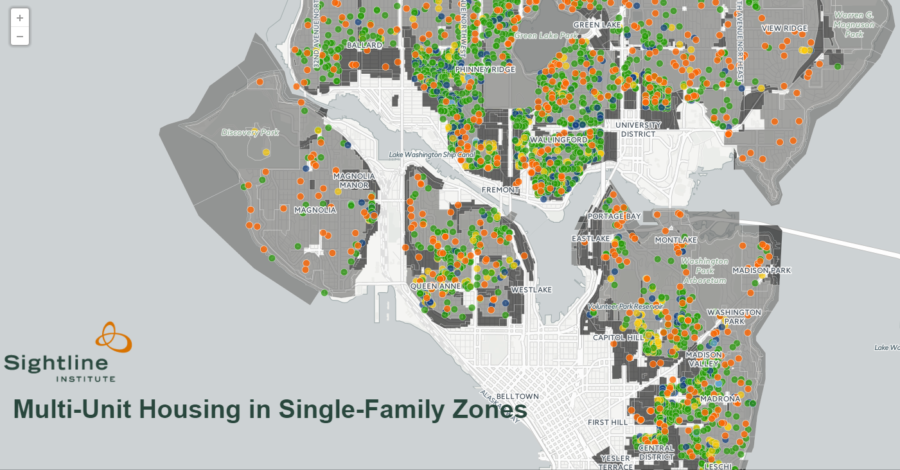
Sightline is today unveiling a detailed map (above) that shows all the multi-family housing units located in parts of Seattle that are zoned exclusively for detached single-family houses. Together, the parcels that hold these multi-family units number almost 4,600—3 percent of all single-family lots in the city. These 4,600 lots contain almost 10,200 homes, or over 7 percent of the homes in single-family zones.
Many of these multi-family homes are among the oldest in Seattle, deeply ingrained in the fabric of the Emerald City. Seattleites pass them on their morning commutes and may not even realize what they are: duplexes and triplexes nestled between single-family homes; houses with ADUs downstairs or out back.
The presence of these dwellings in every corner of the city demonstrates that Seattle’s existing single-family neighborhoods already accommodate diversity in their housing stock. And with a greater diversity of home types comes a greater diversity of residents, who can enjoy and augment the benefits of walkable, amenity-rich neighborhoods. Like in my own family’s case, and in that of Charlene and her daughter, these multi-family dwellings make it possible for Seattleites in many stages of life to find homes that fit their needs.
Diverse housing choices in Seattle’s single-family zones are largely relics of the city’s zoning history, legacies of a time when flexible residential zoning covered much larger swaths of the city. As single-family zoning spread across Seattle, it quashed housing choices in most neighborhoods. Today, single-family zoning covers more than half of Seattle, excluding parks and rights-of-way, while only about 10 percent of Seattle’s parcel land area (the private land where private owners can build things) remains open to multi-family housing types. Most of the dwellings on this map are products of grandfathering. As new zoning codes converted the city’s residential land from multi-family to single-family, city leaders allowed the existing duplexes, triplexes, and 4-plexes to stay (granting them “nonconforming use permits”) but prohibited further construction of these housing types. The one exception to this rule are ADUs, the only type of additional dwelling unit Seattle’s zoning codes currently permit in single-family zones.
In this article I explain how to navigate and use the map. In future articles I’ll delve into the zoning history that created these units and explore how they make city amenities—such as public parks and top public elementary schools—accessible to more Seattle households.
[sightline-embed]
Understanding the map
The map is shaded light gray for Seattle’s single-family zones and dark gray for its low-rise residential zones. By hovering your mouse over the map, you can see the specific zoning for all gray-shaded areas, such as “Residential single-family 5000” (where lots are typically 5,000 square feet) and three grades of low-rise zones.
Low-rise zones permit townhouses, rowhouses, and similar forms of residences that fall between detached, single-family homes and the four-to-eight-story apartment buildings found in mid-rise and neighborhood-commercial zones. Mid-rise, high-rise, and mixed-use zones, which hold most of Seattle’s multi-family housing, are excluded.
Each dot or polygon on the map represents a location in Seattle’s single-family zones that holds housing for more than one household.
- The map’s green, dark blue, and yellow dots represent duplex, triplex, quadruplex, and larger multi-unit houses (let’s call them all “‘plexes”) located in single-family zones. Because low-rise zones commonly allow such housing types as a matter of course, the map does not show them in low-rise zones. Together, ‘plexes comprise two-thirds of all multi-unit homes in Seattle’s single-family zones.
- Light blue dots represent townhouses located in single-family zones; there are just 63 of these in total, representing fewer than 2 percent of the multi-family units standing in SF zones.
- Finally, the orange dots represent permitted accessory dwelling units. ADUs, sometimes called in-law apartments or garden suites, are the only type of additional dwelling unit city planners currently allow property owners to build on lots in single-family zones, regardless of lot size. Though Seattle is home to nearly 1,500 ADUs, the map shows only about 70 percent of them, representing all ADUs Seattleites have constructed in the last 10 years. Addresses for ADUs built prior to 2005 are not in the public record. As shown on the map, a small number of ADUs are in low-rise zones, rather than single-family zones.
Assuming that the households living in ‘plexes and ADUs are the same size as the average household in Seattle—2.1 people—the extra housing choices provide homes for an additional 12,000 people who would not have found a home in these neighborhoods had these almost 4,600 lots been occupied by only one single-family home each.
Housing in Seattle’s single-family zones
[table_container]
|
Housing Type |
Number in SF zones |
| Detached, single-family houses | ~130,000 |
| Duplex structures | 2,275 |
| Triplex structures | 420 |
| 4-plexes and larger structures | 368 |
| Townhomes | 63 |
| ADUs |
1,456 |
[/table_container]
Navigating the map
The map (which you may find displays better in some browsers than others; we found it works better in Chrome than in Internet Explorer) shows different information at different levels of zoom. At closer zoom levels you can access more detailed information about each unit, while at larger zooms you can more easily compare patterns between neighborhoods and across the city.
As you zoom in, the dots representing ‘plexes change to colored polygons, outlining individual land parcels on each block. Dots representing ADUs remain dots even at close zoom as ADUs don’t cover parcels. Hovering over a colored shape shows a photo of the parcel; clicking on one opens a popup box giving more information about the unit, including a streetview photo, the unit type, the year it was built, and the square footage of living space. ADU popup boxes also show the unit description from the city’s building permit record.
Here is an example, to put it all together: my uncle has lived in the Central District for nearly 30 years. He lives in an old single-family home near 15th Avenue and Alder. On his block alone are a duplex (the green rectangle), a triplex (the blue one ), and two 4-plexes (the two yellow polygons):

Within just a few blocks of my uncle’s home are an additional four ADUs, plus 25 duplexes, and several more tri- and 4-plexes:

By hovering on the rectangles in the live map, you can look at the Google Maps street view of each property, and by clicking on the polygons you can look at more information about each home, including its size and year of construction.

At wider zooms, you can see how the units are spread. Though they’re found all over the city, these extra dwellings concentrate in neighborhoods closer to the center of Seattle. Compare how closely packed they are in neighborhoods such as Wallingford and Phinney Ridge with how scarce they are farther north, in areas like Maple Leaf and Wedgewood:

Or compare the relative density in Madrona and the Central District…

…versus the comparative paucity in West Seattle and Delridge.

Still, in every part of Seattle, single-family neighborhoods host ‘plexes and ADUs on many blocks, relics of the past and perhaps harbingers of a future in which zoning flexibility—as called for by the Seattle’s 2015 Housing Affordability and Livability Agenda and currently proposed in Portland—gives thousands of additional families such as mine and Charlene’s chances to live in the city.
Have a look yourself. If you are a Seattleite, count ‘plexes and ADUs near your home, near friends’ homes, or in neighborhoods you might like to live in. What do you find? Share your reactions below in comments. Next time, I’ll trace the history that explains why Seattle’s most exclusive zones are nonetheless sprinkled with ‘plexes.
[list_signup_button button_text=”Like what you|apos;re reading? Get our latest housing research right to your inbox.” form_title=”Housing Shortage Solutions Newlsetter” selected_lists='{“Housing Shortage Solutions”:”Housing Shortage Solutions”}’ align=”center”]
Notes on methods
The data for this map come from the King County Assessor, City of Seattle building permits, and City of Seattle zoning maps.
To map the duplexes, triplexes, quadplexes, apartment buildings, and townhouses, Sightline looked at the King County Assessor’s data sets. A cartographer combined these with City of Seattle zoning maps to find which multi-family units fell within the city’s single-family zones.
Data for ADUs come from two City of Seattle building permit data sets: one covering building permits finalized within the last 5 years and the other covering permits finalized between 6 and 10 years ago. A small number of permitted ADUs fall in low-rise, rather than single-family, zones. We are unsure of the exact number of ADUs in low-rise zones as this information is not included in permit data.
To calculate the number of total homes on the 4,582 lots in single-family zones that hold multi-family dwelling units, we added up the total number of homes of each dwelling type (e.g., two homes in each duplex structure, etc.). In this calculation we assumed conservatively that all 4-plex and larger structures held only 4 dwellings; we also calculated that each lot with an ADU holds 2 homes—the main home plus the ADU.
The map has additional data layers available by clicking on the Visible Layers button near the top right corner. Included are layers that show city parks as purple pentagons and the top-ranked Seattle public elementary schools as black house icons. I plan a full article on what each of these layers reveal in the future.
Thanks to map maker Jeffrey Linn of Spatialities for his tireless work to make this map as accurate as possible.
Also thank you to CartoDB for providing Sightline with a grant to use its map hosting services.

This is phenomenal work that injects a massive dose of empirical reality into Seattle’s housing affordability discussion. Kudos Sightline team!
Here are some photo of small multi-family in today’s single family zones from Wallingford and Green Lake (the modern rowhouses may be in LR but they were too good a representative of this sadly rare form and next door to a single family house to show scale to pass up): https://rezoneseattle.files.wordpress.com/2016/12/legalize.jpg
FWIW, The ADU shown on this map (Madrona, Pine & 29th) and three houses down from me was built so that their aging parents from out of state could come live with them and help out raising their newborns.
The ADU didn’t add a living space to the market but it does allow my neighbors to live a little more comfortably.
Let us get down to basics, this whole concept of destroying single family zoning is nothing more than a scam of many people promoting the builders. It has nothing to do with cultural diversity and creating a village atmosphere. We already do not require the builders to provide parking, what’s next bathrooms?
And the rents will still escalate.
You missed three authorized and legal ADUs on my block. What does this say about the accuracy of the ADU records? The apartment house and duplex are correct. The apartment house dates to before 1915. The duplex is not pre-existing but was approved in 1967 despite not conforming to the zoning.
Great data! To me, it shows that the idea of ruining “pristine” single family neighborhoods with ADUs is nonsense. It debunks the argument that property owners bought into single family neighborhoods and that ADUs would be too much change. We have some ADUs in our single family West Seattle neighborhood, mostly single women, and they are often the most community-minded neighbors you could ask for. For the future, we need to support diversity. ADUs are a great way to add new options, so we aren’t a city of monolithic condos for the millennials and single family homes for the rich and old.
I do not think that your simplistic view of many home owners is fair and justified
Thanks for this good work. They are several more ADUs on our block that were not included in this dataset. My guess is that there are many more ADUs/DADUs than captured here.
Thanks for your comment.
As the article notes: “Though Seattle is home to nearly 1,500 ADUs, the map shows only about 70 percent of them, representing all ADUs Seattleites have constructed in the last 10 years. Addresses for ADUs built prior to 2005 are not in the public record.”
There may also be unpermitted ADUs. We have no way of knowing how many of those may exist nor where.
The devil is in the details. If the rent is too high, it doesn’t matter if it is an ADU, or a multi family lot, or 6 townhouses,or…..We have only watched rents rise in Wallingford, and if you are a renter, plan on spending more than 33% of your income on housing which is ill advised. Oh, and then there’s medical………
MR and Michelle –
Thank you for pointing out discrepancies on your blocks. We know there are lots of unpermitted ADUs not in the city’s records. As for permitted ADUs, we’d definitely like to know why we may have missed some. If you’d be willing to privately email us the locations we could try to figure it out.
Thanks,
Dan
I concur with the above comments that the number of ADUs and DADUs is far greater than the map shows. My block shows none. I know of at least 5 neighbors on my block who have at least one unit on their property. Many are occupied by their children, parents or relatives, who are paying less than market, or no rent. This is our current reality. Let’s embrace it, and encourage more!
Could you include southeast Seattle on your map, please? Thank you.
We’re puzzled by your question, as the map covers the entire city of Seattle, including southeast Seattle.
The current DADU building code requires the owner on the title (not even extended family such as adult children or parents of the owner) to reside there. The Mike O’Brien proposal drops the owner occupied requirement. This will make it more cost effective to add a DADU or ADU to a property, providing more housing capacity throughout Seattle, thus reducing rent pressure.
Nice work as always, Margaret, and glad you mspped existing conditions and continue the explainers. My Summer 2015 writing on this topic will hit the streets soon in a new book with plenty of ideas about how to “have a look for yourself”.
I support ADUs to increase density. However, talk of removing the owner-occupied restriction is concerning. I work for the city and I know from years of experience that without that restriction, these SFR/ADU’s will be purchased by Investor types wanting to extract every dime per square inch. Keeping the owner invested personally in the property in general, keeps the units more affordable and about creating community not a bottom line.
Dulcie –
We are very interested in learning more about the potential impacts of removing ADU owner occupancy requirements. Do you have any examples or studies you could share that illustrate your concern?
Thanks,
Dan
The map is missing two major clusters of ‘plexes in the Delridge area: Puget Ridge Cohousing and Duwamish Cohousing. Each community comprises an entire block of town homes (duplexes, triplexes, etc.) within single-family zones.
It would be great if duplexes/triplex could not only by grandfathered in, but actually rezoned to lowrise so that if someone wanted to buy the house and remodel it, or if it is in bad shape and tear it down, they could replace it with a multi-unit property. If that can’t happen you end up with multiunit properties falling into disrepair and all the new investment happening where there is a single family home that can be knocked down to build another single family structure.
I own a couple of legal, non conforming duplexes in WS. The homes were built in 1910 and 1918. Because real estate estimating sites’ algorithms lowball estimates of such homes, it literally makes sense to permanently convert the homes to single family before selling because many buyers won’t pay above the estimates. With one of my homes the difference is literally over 200k. The lesson here, convert your home and lose a lot of equity.
Bill, I am an investor who would be happy to pay more for a duplex than single family. Google me to get in contact if you want to call my bluff!
I don’t understand Seattle. Everyone seems to love the boom in the economy, but no one wants to share their land with the people actually pumping the economy… The Renters? Since when did Renters get such a bad wrap? I live in NYC and almost everyone is a renter, but that doesn’t make them less vested in the neighborhood. I am one of 5 kids raised by a single mom, who worked 16 hrs a day, but we weren’t a lesser part of the neighborhood. In fact, we were a bigger part. All the neighbors knew us and would tell our mom if we were out of line. As we grew up, we all worked in the neighborhood, delivering the paper, shoveling snow, delivering groceries. We knew all are neighbors and they knew and cared about us. It was a true neighborhood. How many of you actually know your neighbors or their kids? If pristine neighborhood means sterile, then Seattle is succeeding.