This is Elisa Coghlan and Devin Porter. She is a librarian and he a graphic designer. (You’ve seen his charts in Sightline publications for years.)
Elisa Coghlan and Devin Porter, former Seattleites, in their single-family Ballard home. By Devin Porter, used with permission.
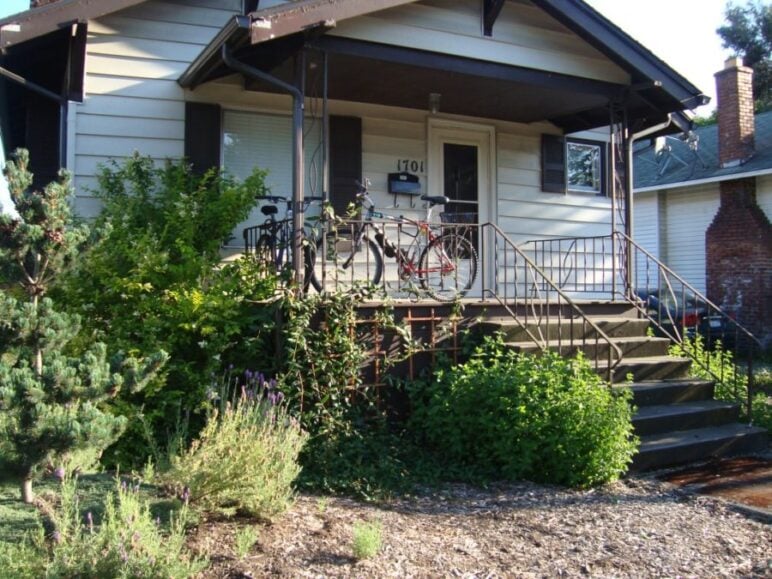
They’re pictured in the house they rented in Seattle from 2008 to 2014. It was at 1701 Northwest 65th Street, in Ballard. It was a typical, vintage Seattle house, built in 1916. If you’ve been in Cascadia for long, you’ve seen many like it. Devin and Elisa lived on the first floor and the landlord rented the basement as a separate unit.
Elisa and Devin’s home stood at 1701 NW 65th St in Ballard. By Devin Porter, used with permission.
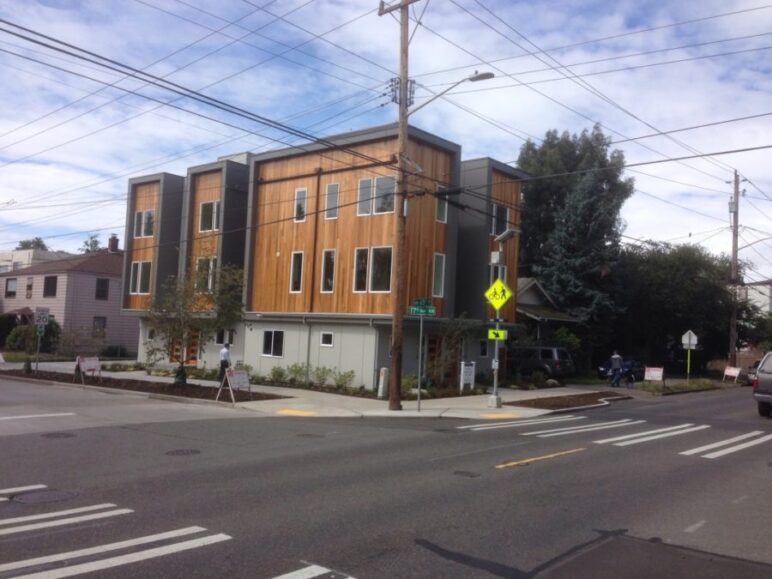
In 2014 Devin and Elisa moved away to accept a dream job in another state and their landlord sold the house to a company called Northwest Modern Builders for $490,000. In 2015, the developer demolished the house and built four rowhouses (pictured below and here).
After they moved, Elisa and Devin’s home was torn down and replaced with four new rowhouses. By Alan Durning, used with permission.
Where one home once stood, now there are four. The homes in the new rowhouses are each, at 1,160 square feet, almost as big as the old house’s two units combined, which totaled 1,360 square feet. The rowhouses have two bedrooms and 1.5 bathrooms each. And, of course, they’re new, not a century old. They have dramatically improved insulation, wiring, plumbing, and safety features. They each sold in 2016 for more than $530,000, for a total of $2.3 million. That’s more than four and a half times the 2014 sale price of the old house, but of course, building them cost a lot, too.
This is a housing story Seattleites hear a lot these days. At first blush it feels like a story of loss. The city lost one of its cheaper homes and replaced it with four expensive new townhomes. It feels as though a developer padded his wallet by making the city’s housing stock even more exclusive.
But is that the whole story?
The single-family home would have been about twice as expensive as any one of the new townhomes.
Imagine that instead of standing in a lowrise zone, Devin’s old home had stood in a single-family zone. In fact, if it had been across Northwest 65th Street, it would have been zoned single family. Then, the builder would not have been able to erect the townhomes. Instead she would have built just one new single-family home, all that was allowable on the parcel. The average sale price of the two new single-family homes built in Ballard over the last year was $1.07 million. In other words, the single-family home would have been about twice as expensive as any one of the new townhomes. In this scenario, Seattle would have lost out: it would have turned one typical single-family home into a newer, bigger, and much more expensive, single-family home, with no net gain in housing. In fact, the city would likely have lost a home since the landlord rented out the original house as two separate units. Two modest rental units would have become one McMansion. Instead, because of the lowrise zoning, two additional households found a home in Seattle; and while the new townhomes are expensive, they are some of the cheapest housing on the market in Ballard. What’s more, they took a little pressure off the city’s housing shortage, relieving some demand across the city.
Sightline wanted to track this story across the city. Do multi-family homes, like the rowhouses in Devin’s story, or things like condominiums, townhomes, and the four-packs popping up across the city, offer Seattleites cheaper or more expensive housing options than single-family homes? Today Sightline is publishing a new housing map in answer to this question. The map tracks all of Seattle’s multi- and single-family homes sales over the 12 month period starting July 1st, 2016.
Join the 15,000+ readers who get Sightline Institute’s latest research.
Get our latest research and news summaries straight to your inbox.
Almost finished! We need to confirm your email address. To complete the subscription process, please click the link in the email we just sent you.
←
Almost finished! We need to confirm your email address. To complete the subscription process, please click the link in the email we just sent you. In the meantime, here are other newsletters you may be interested in:
As the map shows, multi-family home sale prices are much cheaper than single-family home sales. In fact, across the city multi-family home sales averaged $220,000, or 30 percent, less than average single-family home sales over the last year. Even brand new multi-family homes, those built within the last 18 months, cost an average of $45,000 less than older single-family homes, those built prior to 2016. In other words, though the story of Devin’s home is happening in some parts of the city, that’s not the whole story. Multi-family homes are offering Seattleites cheaper homeownership alternatives to single-family homes.
In this article I’ll explain how to navigate the new map and delve into what the map shows about multi-family homes.
How to navigate the map
The map shows all home sales in Seattle from July 1st, 2016 through June 30th, 2017. In all, that’s nearly 11,000 sales. Of these, almost 7,000 were typical single-family homes, usually on a lot of at least 5,000 square feet; the map marks these sales with orange dots. The other nearly 4,000 sales were multi-family homes, represented by blue dots. This group includes condominiums, townhomes, rowhouses, and homes on residential small lots (RSL), like skinnies and four-packs, sometimes known as cottage housing. The size of each dot corresponds to the home sale price, according to the legend in the upper left.
The map has two views. The first is a rollup view where you can see summary dots for each of the city’s 77 neighborhoods, sized according to the average home price in that neighborhood. The second view appears when you zoom in a few levels. The neighborhood summary dots disappear and break into dots representing every sale over the last year. Here’s a brief tutorial on how to navigate each view.
Rollup view
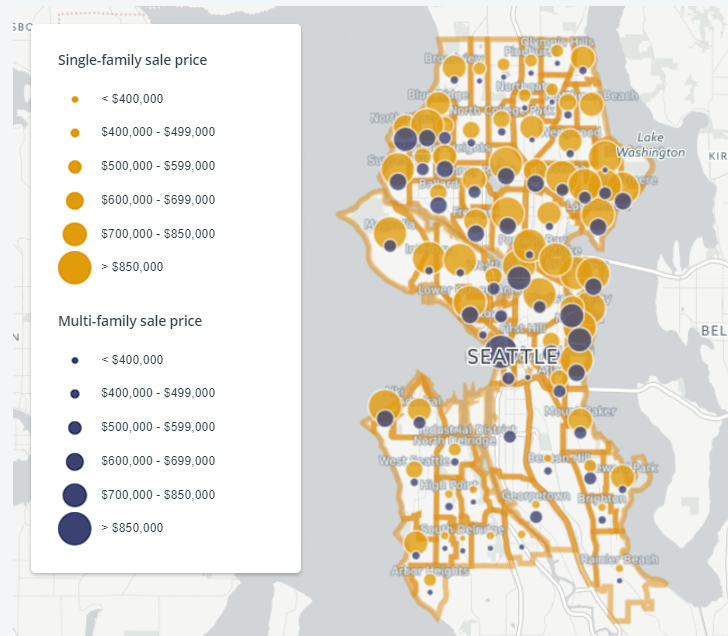
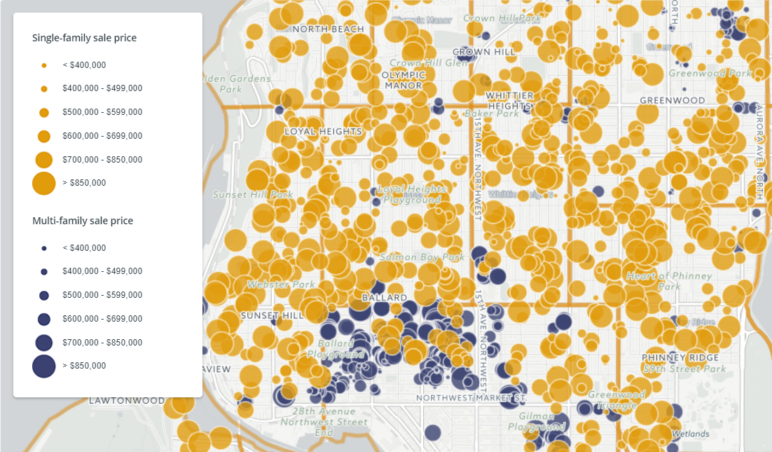
Here’s a screenshot of the map in the rollup view. As I stated above, orange dots represent single-family home sales and blue dots represent sales of all multi-family homes, including condominiums, townhomes, rowhouses, four-packs and skinnies.
Rollup view of the map. Dot sizes represent average sale prices by neighborhood. Orange dots represent single-family home prices and blue dot represent multi-family home prices. Screenshot by Sightline Institute.
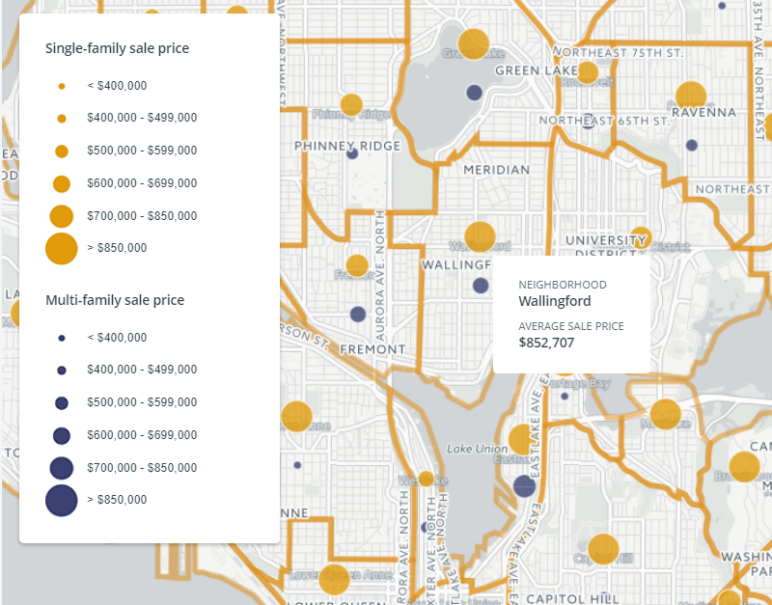
Hovering your mouse above, or clicking on, any dot on the map brings up a popup box which shows the neighborhood name and average home sale price in that neighborhood over the last year.
Hovering your mouse over, or clicking on, any neighborhood dot brings up a popup box with specific information about that neighborhood. Screenshot by Sightline Institute.
Individual sale view
When you zoom into the map a few levels, the neighborhood scale dots give way to the 11,000 dots representing each home sale over the last year, located on the parcel where the sale took place.
Zooming into the map, the neighborhood summary dots disappear and are replaced with dots showing every sale in the city from July 1st, 2016 to June 30th, 2017. Screenshot by Sightline Institute.
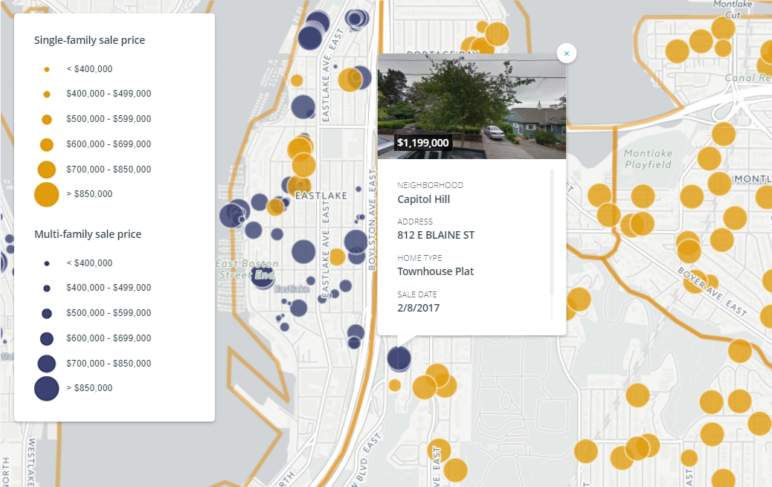
Hovering your mouse above any single dot will bring up a pop-up box with the neighborhood name as well as the sale price. Clicking on any dot will show a pop-up box with additional information, including a Google Maps street view of the location, the address, the sale date, and the year the home was built. Pop-up boxes for multi-family homes also list the housing type in one of two categories: townhomes and condominiums, depending on whether homeowners own their land individually (townhomes) or collectively (condominiums).
Clicking on individual sale dots reveals additional information about the sale. Screenshot by Sightline Institute.
Filter by year of home construction
We also created two widgets on the map, accessible on the right pane, which allow you to filter the map by year of home construction. The widgets don’t impact the rollup view of the map—the neighborhood average prices will remain the same no matter how you set the widgets. You can only filter the individual sale view by year built. Besides allowing you to filter dots by the year a home was built, the widget also shows the number of homes built in each of the five most common construction years, and this changes dynamically with the map view.
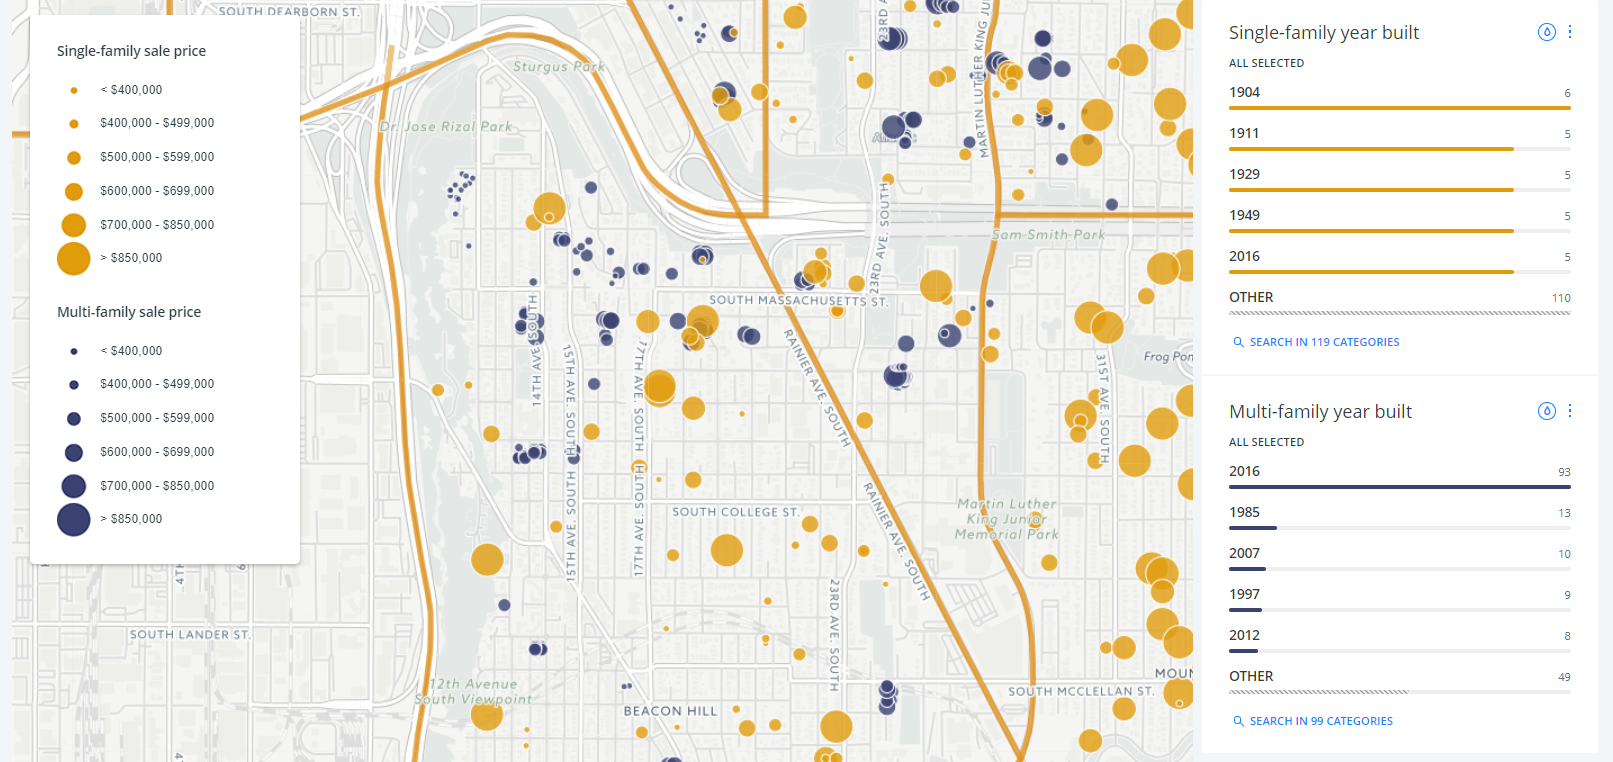
For example, here’s a screenshot of the north end of Beacon Hill showing all home sales over the last year. Six single-family homes were built in 1904 and five in each of 1911, 1929, and 1949. You can search for specific building years using the search option at the bottom.
The year built widgets to the right of the map show the most common construction years for sale dots on the screens. Screenshot by Sightline Institute.
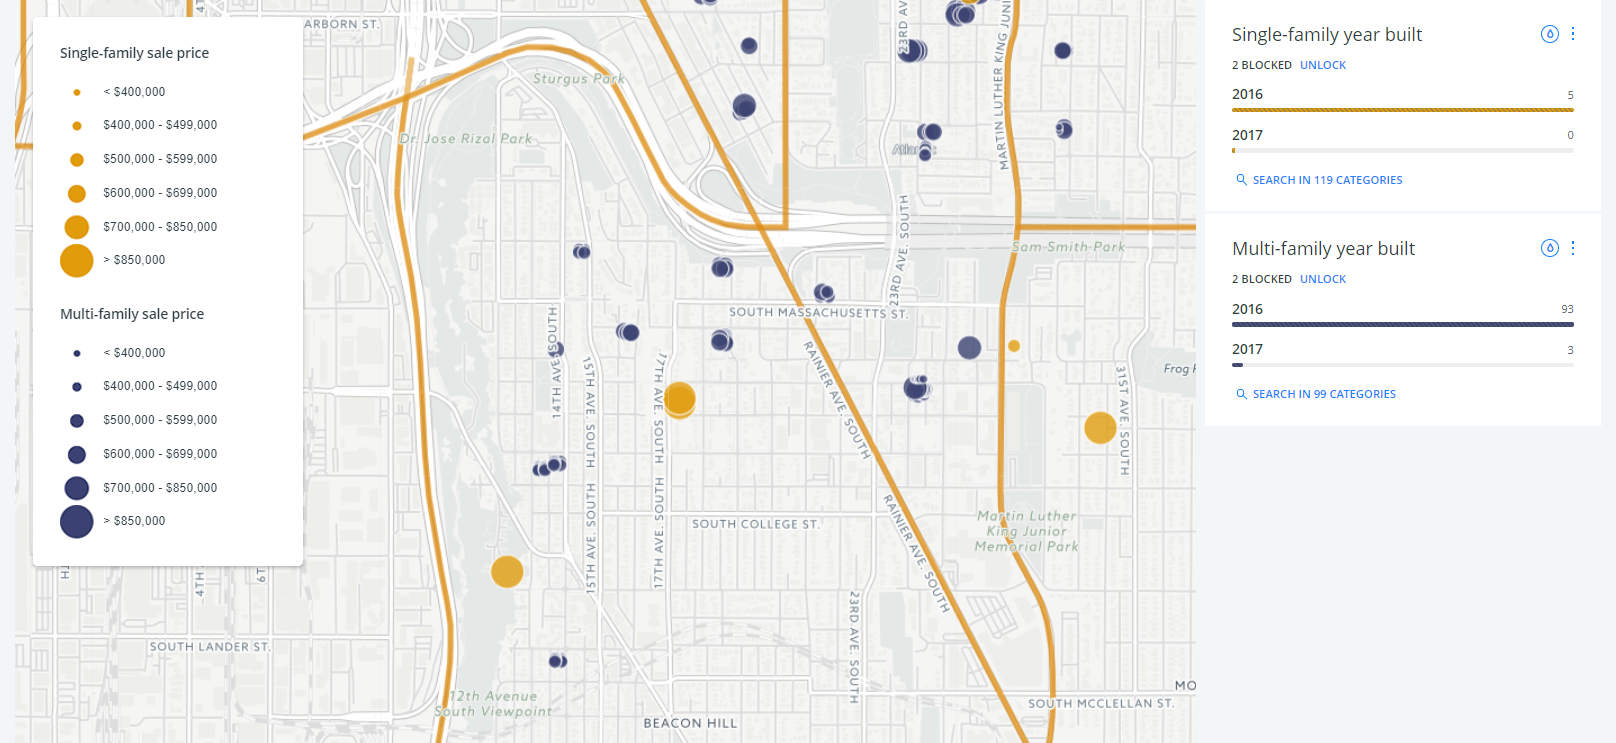
This is a screenshot of the same area, but using the widget to filter the sale dots for only new construction, homes built in 2016 or 2017.
The year built widgets allow you to filter sale dots by year of home construction. Screenshot by Sightline Institute.
Single-family home sale prices trounce multi-family prices
Orange dots dwarf the blue dots in almost every neighborhood across the city, meaning single-family home sales over the last year were far more expensive than multi-family sales. On average, single-family home sale prices towered nearly 42 percent over multi-family home prices.
Orange dots dominate blue dots in almost every neighborhood in Seattle.Screenshot by Sightline Institute.
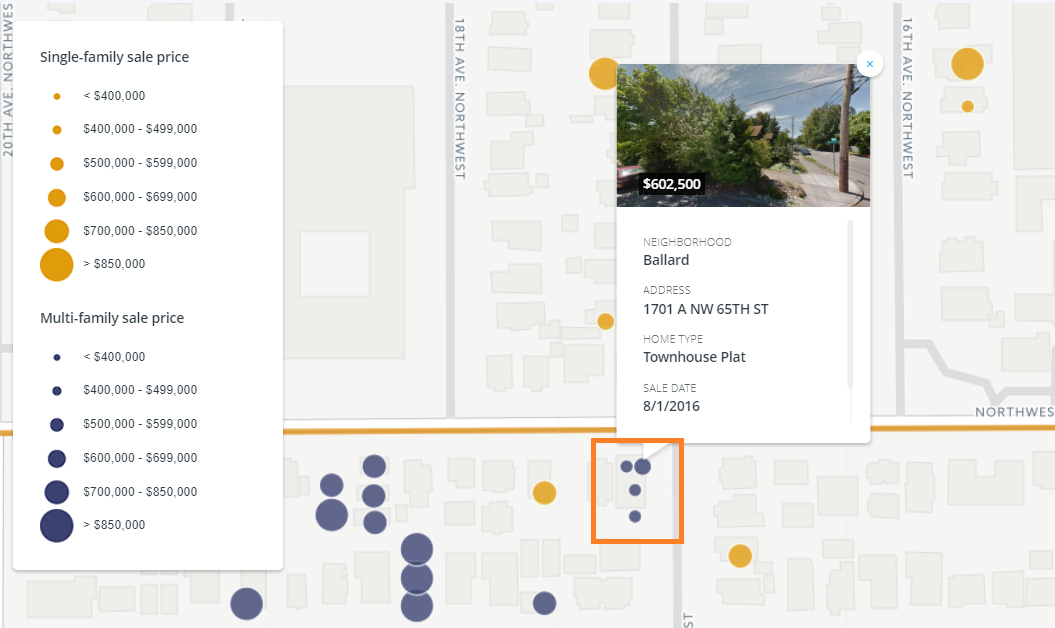
Below is a screenshot from the map showing the location where Devin’s house used to stand. The four blue dots clumped together, and highlighted inside the rectangle, represent the four townhomes that were built where Devin’s single-family home stood. The largest of the blue dots, which has its pop-up box shown, was the most expensive of the four townhomes. It sold for just over $600,000. But even this dot is equal to or smaller than all the orange dots in the shot, which represent the single-family homes sold in the area over the last year. In fact, the average sale price of single-family homes in Ballard over the map’s time period was nearly $690,000. So, though expensive, the new townhomes were significantly cheaper than almost all the single-family home options nearby and made homeownership in Ballard a possibility for a broader range of Seattleites.
The four blue dots highlighted are the four townhomes built where Devin’s house used to stand. They sold for less than all of the older construction single-family homes in the area. Screenshot by Sightline Institute.
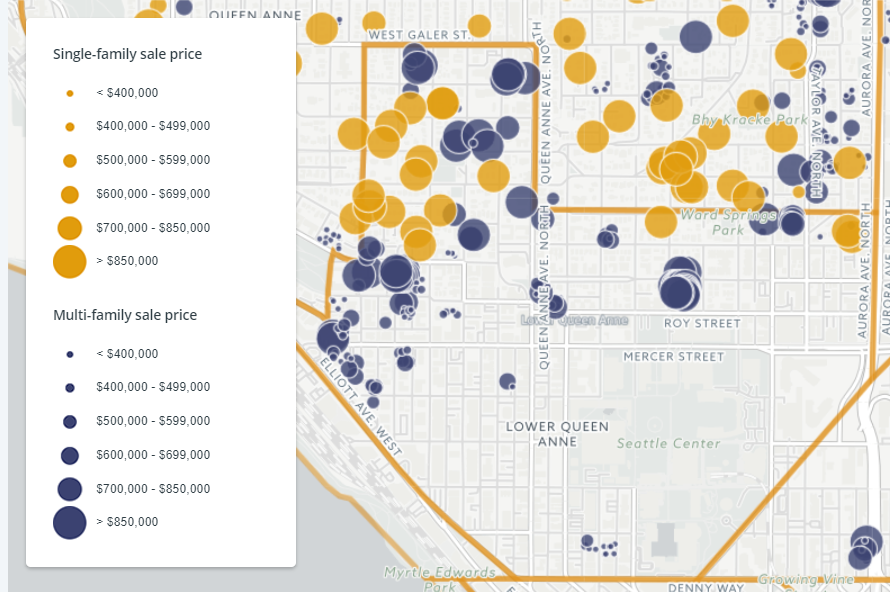
In three neighborhoods, the average single-family home sale price during the last year was over one million dollars more than the average multi-family home sale price. From greatest difference to least, these neighborhoods were Lower Queen Anne, Laurelhurst, and Madison Park. In Lower Queen Anne, homeowners sold the average single-family home for $1.8 million last year versus just over $660,000 for the average multi-family home.
In three neighborhoods, the average single-family home sale price during the last year was over one million dollars more than the average multi-family home sale price.
Here’s a screenshot of the neighborhood from the map. The size of the orange dots dominates the blue dots; the blue dots also come in a broader range of sizes, indicating that the multi-family homes in the neighborhood offer a wider range of price points, than the single-family homes. Multi-family home construction in Lower Queen Anne is opening up homeownership in the neighborhood, something desperately needed in a part of the Seattle core with few homeownership options under $1 million. Nearly one in five of the homes sold in the neighborhood last year were newly built multi-family homes, clumped together in two townhome developments (there were no new-construction single-family homes last year).
Single-family home sales prices in Lower Queen Anne over the last 12 months averaged over $1 million more than multi-family home sale prices. Screenshot by Sightline Institute.
Only one neighborhood saw the opposite trend
The dominance of single-family home sale prices last year held true in every neighborhood across the city save one: Georgetown. There, multi-family home sales averaged 14 percent more than single-family sales. The neighborhood’s somewhat unusual housing mix explains this difference. The area saw 42 home sales last year, nearly half which were townhomes in the newly opened Georgetown Collection development. Meanwhile the neighborhood’s single-family homes are some of the cheapest in the city, largely because the area’s single-family housing stock has seen very few updates for decades. Given that all but two of the single-family homes that hit the market in Georgetown last year were nearly 60 years older than every multi-family home on the neighborhood’s market, it’s not surprising that in this neighborhood multi-family homes outpriced single-family.
New to new: multi-family is nearly 40 percent cheaper than single-family
Of the 11,000 home sales in Seattle between July 1st, 2016 and June 30th, 2017, just 10 percent were of brand new homes, built in 2016 or 2017. Seattle isn’t seeing much new construction of single-family homes, and of these 1,100 brand new homes sold last year, three-quarters—or 829—were multi-family. Looking at just these 1,100 new-construction homes, the average single-family home sold for $1.1 million, while the multi-family home sales averaged $700,000. In other words, when it comes to new construction, multi-family homes offer homeownership at 62 percent the price of single-family homes.
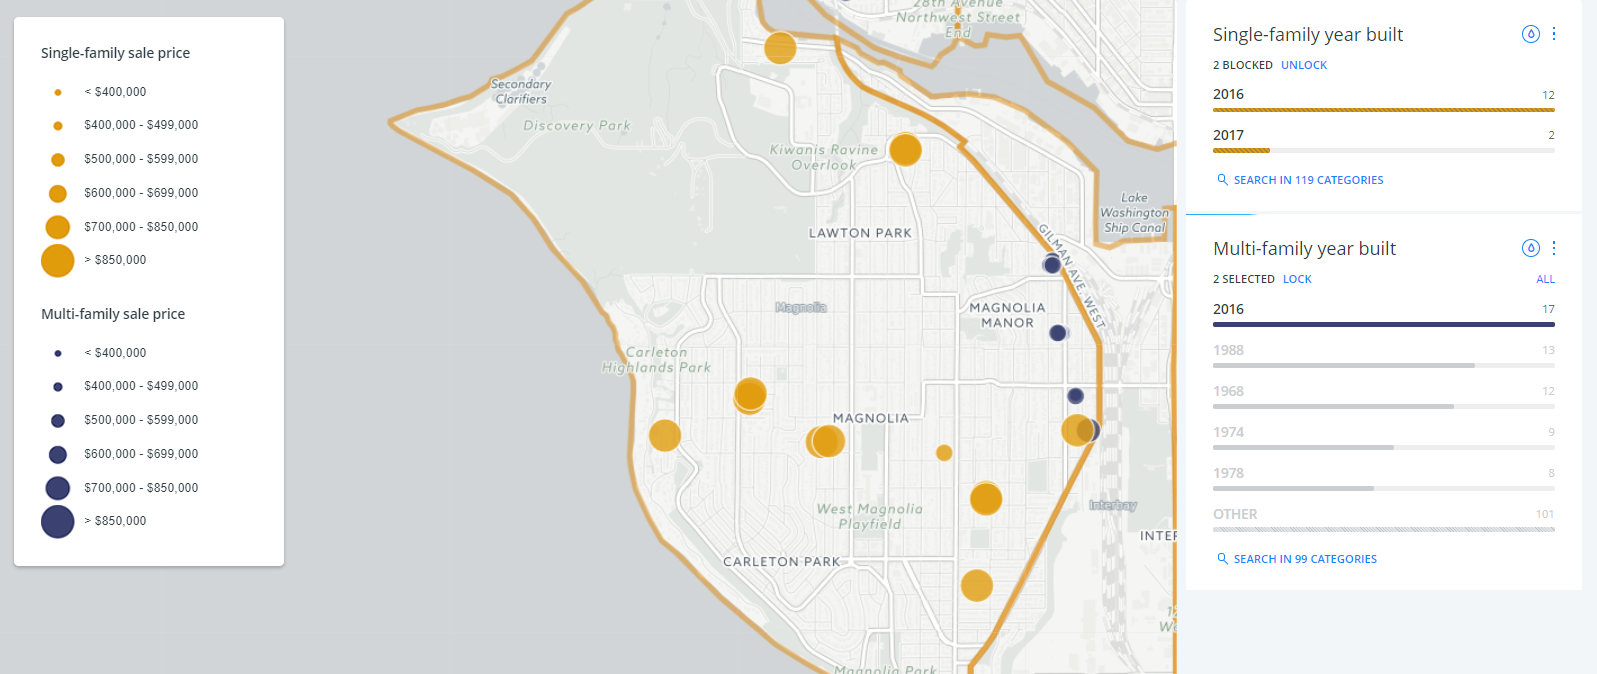
Magnolia is a neighborhood that has seen a fairly even split in sales of new-construction single- and multi-family homes over the last year, 14 and 17, respectively. Of these, the single-family home sales averaged $1.4 million. This was more than double the average price of the neighborhood’s new multi-family homes, which was $650,000.
Sales of new construction homes in Magnolia neighborhood. Screenshot by Sightline Institute.
Even old single-family homes cost more, on average, than new multi-family homes
On average new multi-family homes are even cheaper than older single-family homes.
Sales of Seattle’s older single-family homes—those built prior to 2016—averaged $748,316 over the last year. Compare this with the average sale price of newly built multi-family homes: $703,000. So even old single-family homes cost, on average, $45,000 more than newly built multi-family homes.
But what about the story of Devin’s house in Ballard?
Though on a city scale new multi-family homes sold for less than old single-family homes over the last year, that wasn’t always the case on a neighborhood scale. The owner of the single-family home Devin used to rent sold the house for less than the price of each of the four new townhomes that took its place, and that’s indicative of the neighborhood’s overall trend. Ballard is one of 12 neighborhoods scattered throughout the city in which new multi-family homes outpriced single-family home sales last year. Together these 12 neighborhoods saw almost two-thirds of the city’s new multi-family home sales last year.
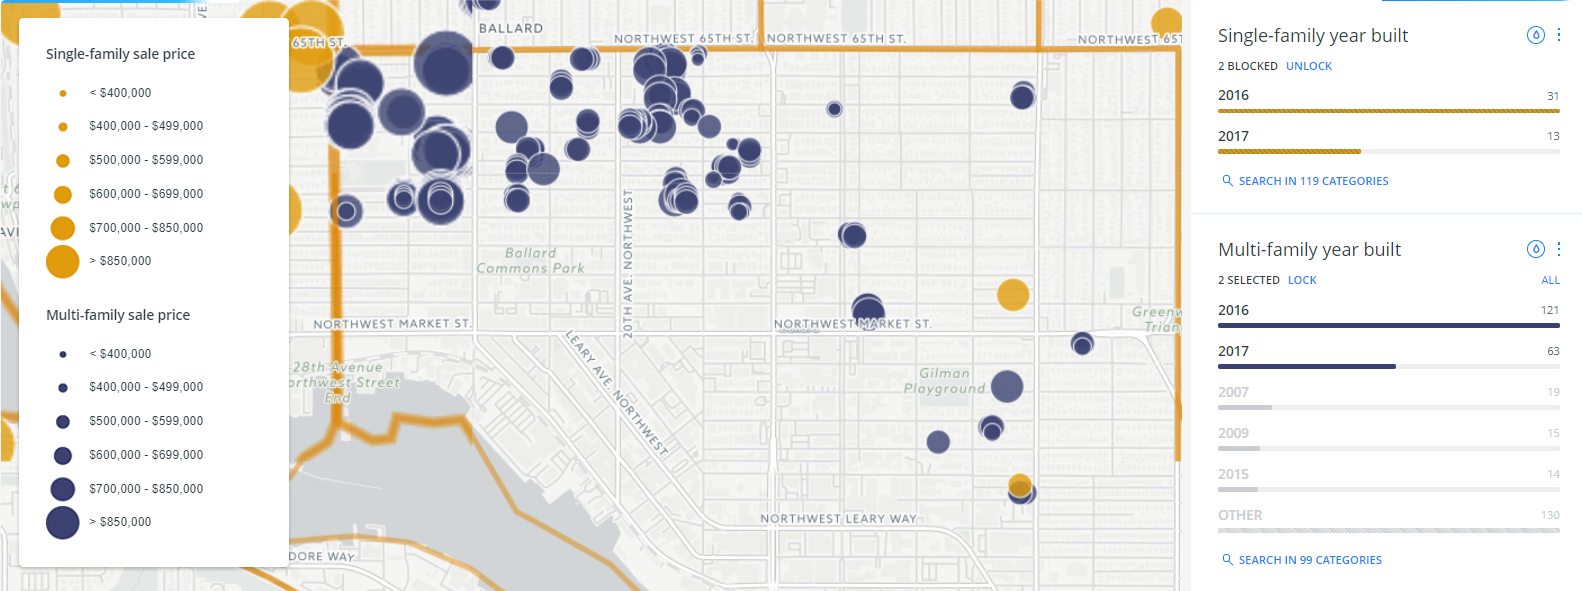
Ballard has been at the center of Seattle’s owner-occupied multi-family housing growth (this excludes apartments). Over the 12 months covered in the map, the neighborhood saw 171 sales of new-construction multi-family homes, equivalent to one-fifth of all multi-family home sales in the city during that period. Ballard’s share of the new multi-family home sales was double the next closest neighborhood, the Central District, which saw 86 new multi-family home sales. In Ballard, unlike in most of the city, the average price of new multi-family homes was $70,000 higher than that of single-family homes—largely because the single-family homes that did sell were relatively old, with an average building year of 1926. In each of these 12 neighborhoods there’s no way to know what prices would have been without the new development; buyers could have bid up existing housing prices even higher without the new homes to relieve some pressure from demand.
One in five of the new multi-family homes sold in Seattle last year were in Ballard. Screenshot by Sightline Institute.
But what would have happened if the city had zoned all of the residential land in Ballard single-family, making the construction of all of the neighborhood’s townhomes illegal? In other words, what would have happened if Ballard never got the approximately 100 additional housing units last year? It’s hard to say for sure. In the short-term, the average home sale price in Ballard might have been a little lower than it actually was. But two other things also would have happened.
The McMansion problem
The first is the McMansion problem. Some highly desireable neighborhoods with little multi-family zoning are at greatest threat of having old single-family homes torn down for builders to replace with newer, bigger, and fancier single-family homes. We can catch a glimpse of this trend in neighborhoods like Ravenna and Sunset Hill which are almost entirely covered in single-family zones and saw some of the most new single-family home construction last year. The new single-family homes in both of these neighborhoods sold for an average price of $1.4 million last year. Every townhouse and skinny not built increases competition for existing single-family houses, and the new single-families push up home prices without adding supply. That upward pressure on prices, spread across the city’s 133,000 single-family lots, pushes more small, old homes across the threshold from “leave alone” to “tear down and replace”: the higher prices, the more McMansions get built.
The longer-term cost problem
In addition to staving off McMansions, new multi-family homes also provide additional, and much needed housing choices. In the long run, this added supply is keeping housing prices in Ballard lower than they would otherwise be. Without these new homes, housing would be at even more of a premium in Ballard than it is today. Many of the people who found housing in the neighborhood’s new townhomes would instead have bid on the few old single-family homes that went on the Ballard market over the last year, and thus these older homes would likely have sold for even more than they did, driving the neighborhood’s already expensive single-family home sale prices even higher, which currently stands at an average of $690,000. In other words, the new multi-family homes kept the price of the neighborhood’s older single-family homes down. By extension, building even more new townhomes and the like would further slow—or even reverse—price increases. The new homes in Ballard may also be modulating prices across the city; more housing options in one neighborhood relieve pressure elsewhere.
Multi-family homes make homeownership a possibility for more Seattleites
Across Seattle, the condos, townhomes, rowhouses, four-packs, and skinnies that Seattleites love to hate are making homeownership possible for more people. Without these home choices Seattle would likely see more single-family teardowns for replacement by newer and bigger single-family homes, and fierce bidding wars would reserve homeownership for an even thinner crust of the city’s residents. Instead, multi-family homes bring down the city’s average home sale price. New multi-family homes sell for less than new single-family homes in almost every neighborhood across the city, and overall they sell for less than old single-family homes. What’s more, they provide more housing options to Seattleites, taking up less space than their single-family sisters, while relieving pressure in the housing market.
Seattle’s Housing Affordability and Livability Agenda proposes increasing opportunities for multi-family housing like the types we studied in this map. As the map shows, multi-family housing options may be Seattle’s best hope for a more affordable housing future for all. To welcome all the people who want to own a home in Cascadia’s premier city, one key is to understand that new multi-family dwellings, like townhomes, are a solution, not a problem. They seem expensive, but the alternatives are much more costly. To complete this article properly, I’d need to meet the residents of the four new townhomes that now stand where Devin’s old single-family home once was. They are the real end of this housing story.
Special thanks to Matt Stevenson of CoreGIS for his help in constructing this map, and to Devin Porter for sharing his housing story.
Methods
This map is based on data from the King County Assessor’s records from July 1, 2016 to June 30, 2017. Sometimes Assessor records misclassify properties, or are out of date. We expect these errors to be rare and not change the overall findings of this article. Nevertheless, please let us know if you find any sales on this map that are incorrectly classified.
Margaret Morales was a senior researcher for Sightline Institute. She earned her master’s from the University of British Columbia’s Institute for Resources, Environment, and Sustainability, where she was a Bridge Fellow focusing on issues of public health and the environment. There her research examined wastewater and biosolids management in British Columbia and Latin America. She received her Bachelor’s degree from Duke University in Environmental Science and Policy, and English. She also holds a certificate in Documentary Video from Duke and worked as a documentary filmmaker for non-profits in the United States, Canada, and Latin America. Her work has screened in multiple film festivals.
In her free time Margaret enjoys cooking, reading novels, and working on her photography.
About Sightline
Sightline Institute is an independent, nonpartisan, nonprofit think tank providing leading original analysis of democracy, energy, and housing policy in the Pacific Northwest, Alaska, British Columbia, and beyond.
Housing + Cities
Legalizing more affordable, welcoming, sustainable communities by allowing more homes, in all shapes and sizes, alongside less car-centric urban design.