

Takeaways
- Cascadia is home to more than 21 million residents—and it’s growing! While a bioregion describes an area based on its ecological characteristics, defining its people presents more of a challenge.
- The bioregion is split between two countries, nine states, a province, and a territory, plus the more than 1,500 First Nations reserves and Indian reservations that overlay these divisions.
- Population counts influence policy decisions across the region, and Canada conducts its next census this year.
Sightline has crunched the numbers, and the results are in: Cascadia, the bioregion stretching from the fjords of the Kenai Peninsula to the redwoods towering over the Russian River, and from the tide pools of the Pacific Ocean to the peaks of the Continental Divide, is home to more than 21 million people.
To kick off a new series on the people of Cascadia, this article details the bioregion’s population and the people that compose it. It’s the first such treatment Sightline has done in many years.
What is Cascadia?
Why, here, of course!
Cascadia is a bioregion, a collection of ecosystems and places bound by their natural and ecological similarities (such as the Columbia River watershed) rather than lines on a map (the 49th parallel, for instance).
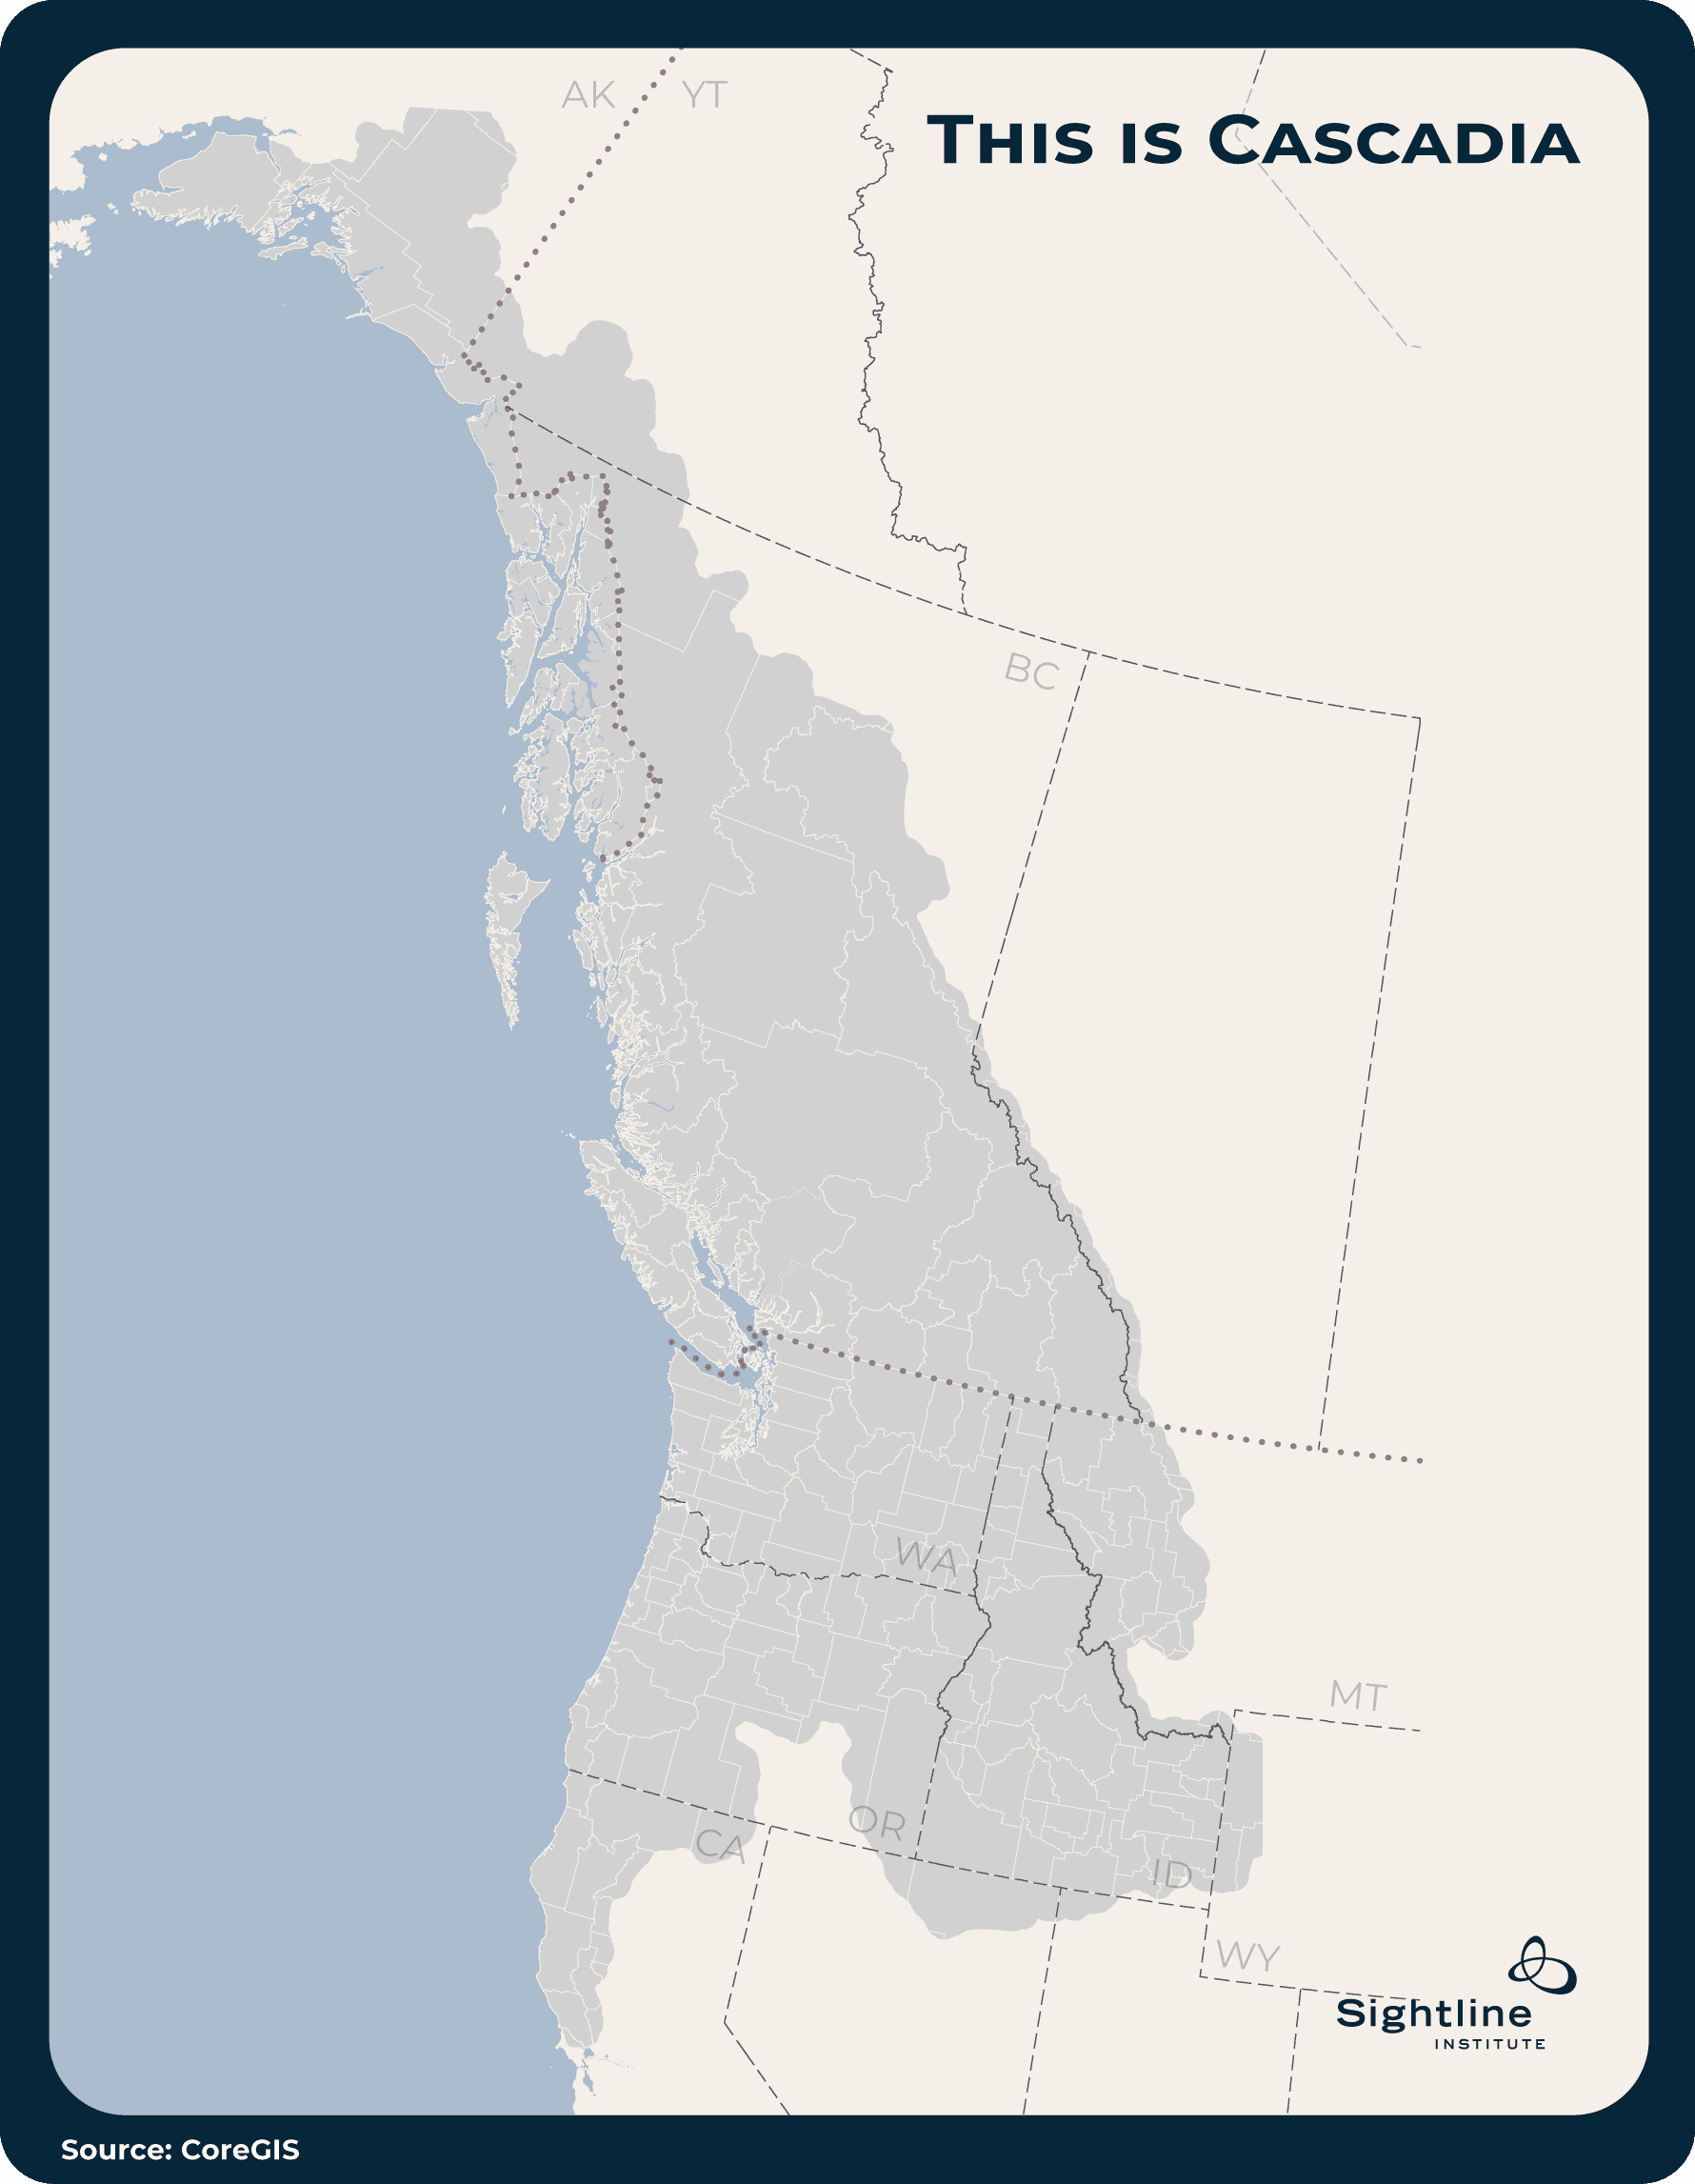
And Cascadia is Sightline’s bioregion. It encompasses the watersheds of the rivers that flow through North America’s temperate rainforest into the Pacific Ocean. The region derives its name from the water at the heart of it all, cascading down through the mountains and rainforests.1 From Sightline’s own Alan Durning, in his book This Place on Earth:
The unity of this diverse bioregion is in the movement of its water; every ounce of moisture that the ocean throws into the sky and the sky hurls down on the land inside this region’s borders tumbles toward the rain forest coast. If it does not evaporate or get trapped in underground aquifers along the way, the water will reach that dripping shoreline through one of several hundred swift, cold rivers.
While the bioregion describes an area based on its ecological characteristics, defining the people of that region presents more of a challenge. No statistical agency recognizes the bioregion as a boundary to enumerate within. You’d be hard-pressed to pull together population counts in the US census for the Skagit River watershed, while those numbers for Skagit County or Anacortes are easier to find.
So, to estimate demographic counts for Cascadia, Sightline assembled a collection of other political boundaries that approximate the region. This assemblage gives a reliable count of people in the specific counties, boroughs, and census divisions that resemble the Cascadian footprint. But the count, like all statistics, is subject to flaws such as survey error and cross-border incompatibility. (For more on the boundaries and methodology behind this analysis, see the Appendix.)
One bioregion divided by many governmental boundaries
That count: 21 million of us Cascadians! (21,561,819, to be exact.) If Cascadia were its own country, its population would be somewhere around the 60th largest in the world—smaller than Australia’s population of 28 million but just above Chile’s 20 million.2 But the bioregion is split between two countries, nine states, a province, and a territory, plus the more than 1,500 First Nations reserves and Indian reservations that overlay these divisions.
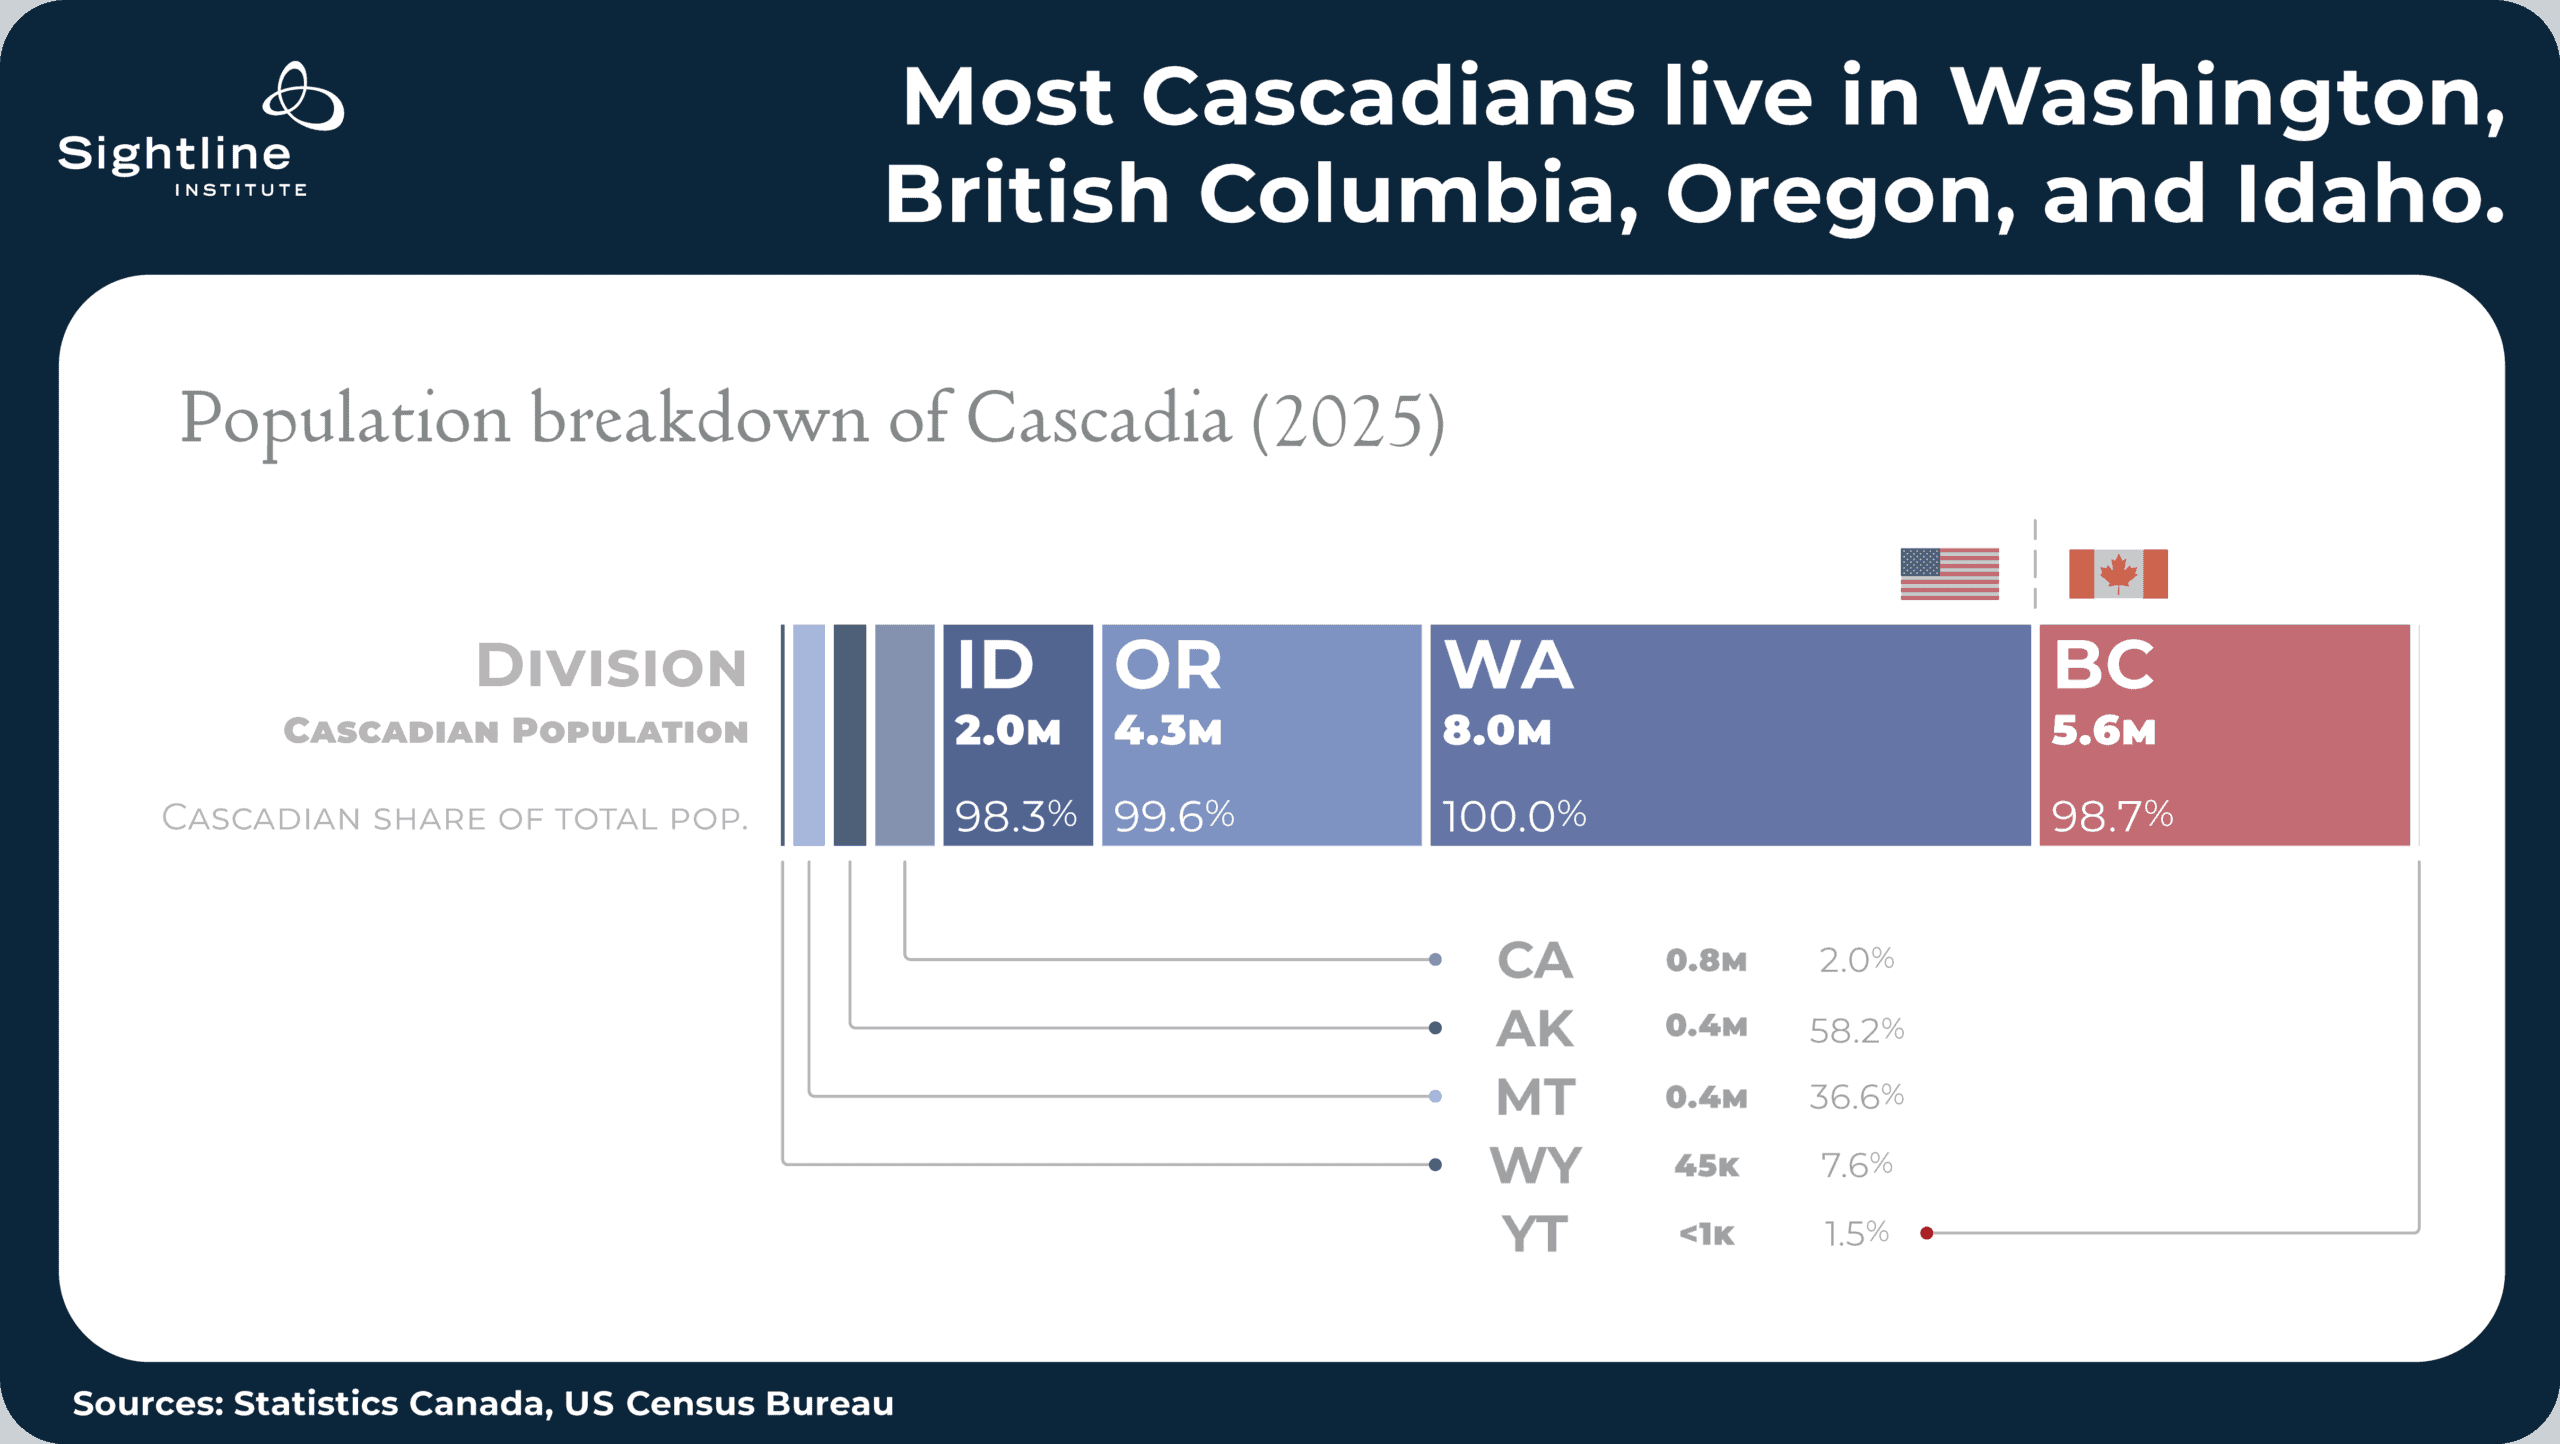
Most of those people (about 16 million) are residents of the United States, with Canadians making up the remaining quarter. Four subnational divisions house the lion’s share of the population, 19.9 million of the total 21.6 million: the state of Washington (37 percent), the province of British Columbia (26 percent), and the states of Oregon (20 percent) and Idaho (9 percent). These divisions are also almost completely within the region, with all four having at least 98 percent of their population living in the Cascadian portion—and in Washington, 100 percent.
Outside this core are major portions of two more states. More than 400,000 residents each of Alaska and Montana are Cascadians, making up over half of all Alaskans and more than a third of all Montanans. Since these two states have smaller overall populations, each contributes only about 2 percent of the region’s population.
And at its geographic edges, Cascadia overlaps with a small fraction of the residents of California (4 percent of Cascadians), Wyoming (0.2 percent), and the Yukon (0.003 percent). The region even crosses into Nevada and Utah, though the residents of these tiny Cascadian extremities contribute even less to the population.
Almost 800,000 Cascadians live along California’s north coast, the redwood forests and streams of our region’s southern reach, but they make up only 2 percent of Californians. Even this small section of California is home to almost as many Cascadians as Alaska and Montana combined.
We’re growing!
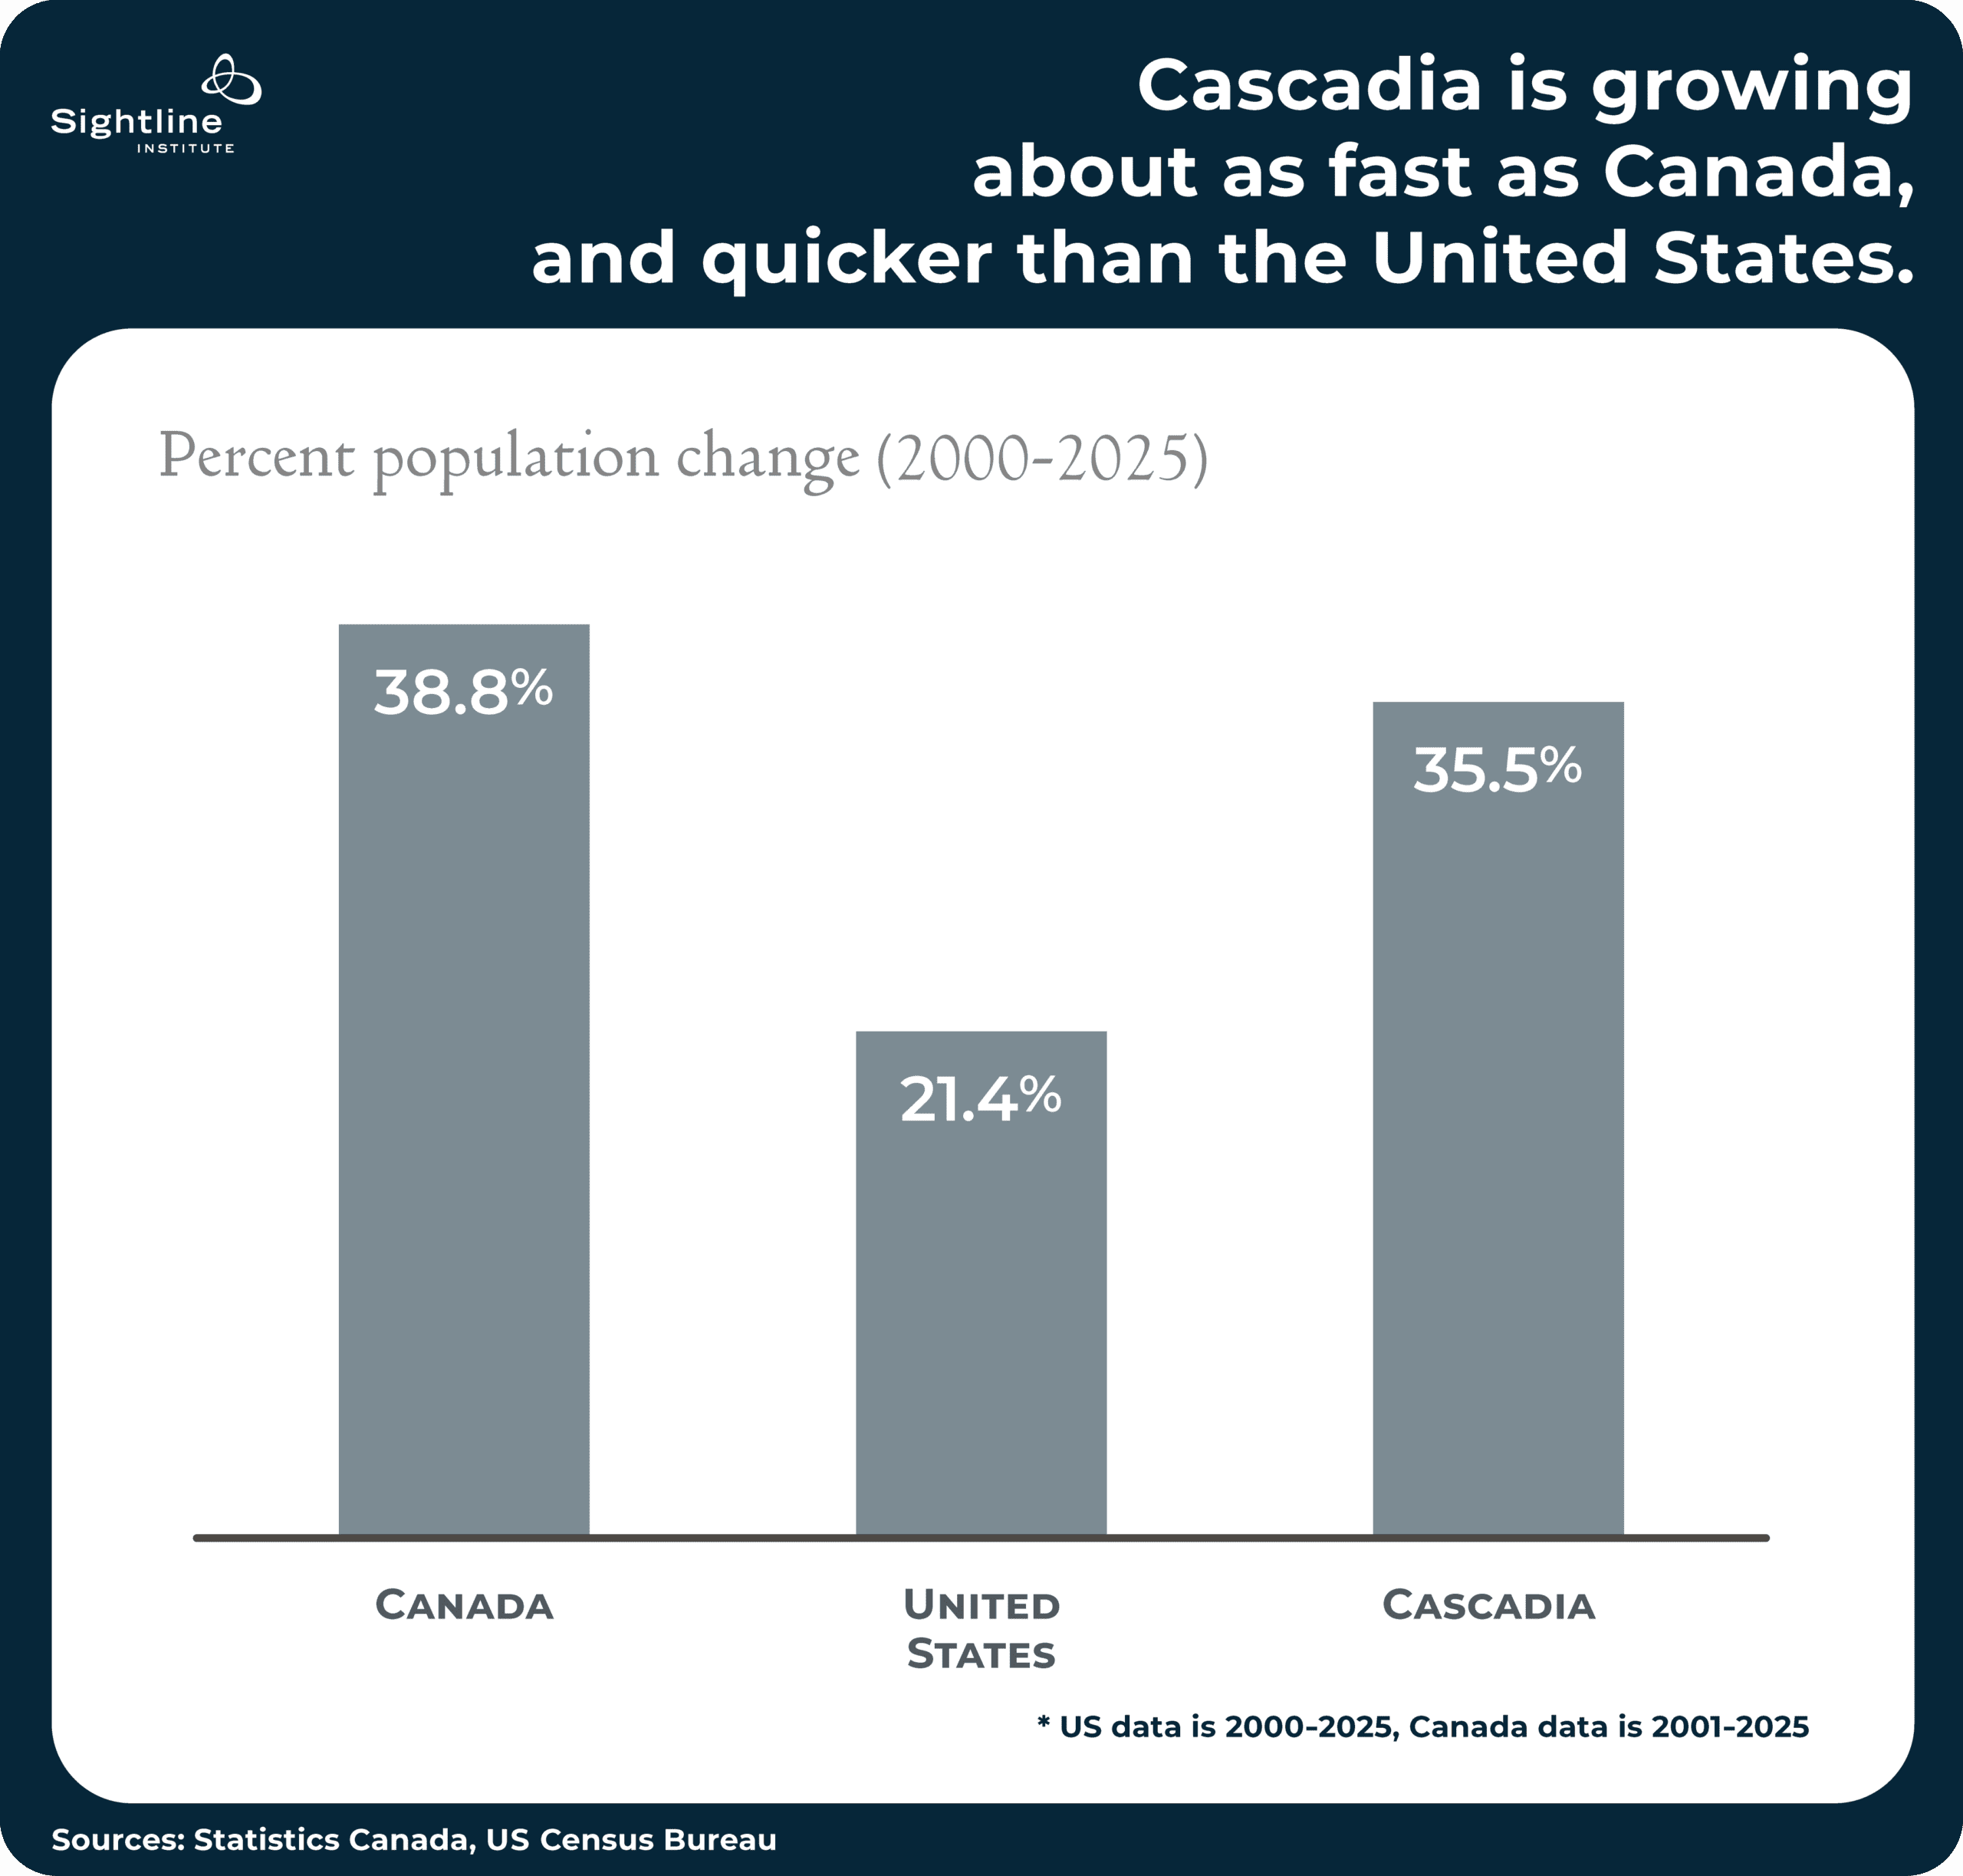
From 2000 to 2025, Cascadia’s population grew from 15.9 million to 21.6 million (35 percent). As of 2025, the bioregion’s population is roughly half that of Canada (42 million) and about 16 times smaller than the United States (342 million).3 Since the beginning of the millennium, it’s grown faster than the United States and about as fast as Canada.4
That population growth is a mix of natural increase (births minus deaths) and net migration into the region. A growing population has for decades been a fact of life in Cascadia.
Some large urban areas
The building blocks of Sightline’s analysis are counties (in most of the United States), boroughs and census areas (in Alaska), census divisions (in British Columbia, which mostly correspond to regional districts), and census subdivisions (in the Yukon).5 These “county equivalents” (to borrow a term from the US census) fill up the entire geography of the region. Unlike the Swiss cheese of municipalities or metro areas, every resident lives in one of these county equivalents, so they’re useful for enumerating the entire population.
Cascadia’s most populous county equivalents center on its largest urban areas, dotting the spine of the bioregion from the Salish Sea down to the Willamette Valley. The five most populous are Metro Vancouver, King and Multnomah Counties, which contain Seattle and Portland, respectively, and two suburban counties outside Seattle (Pierce and Snohomish).
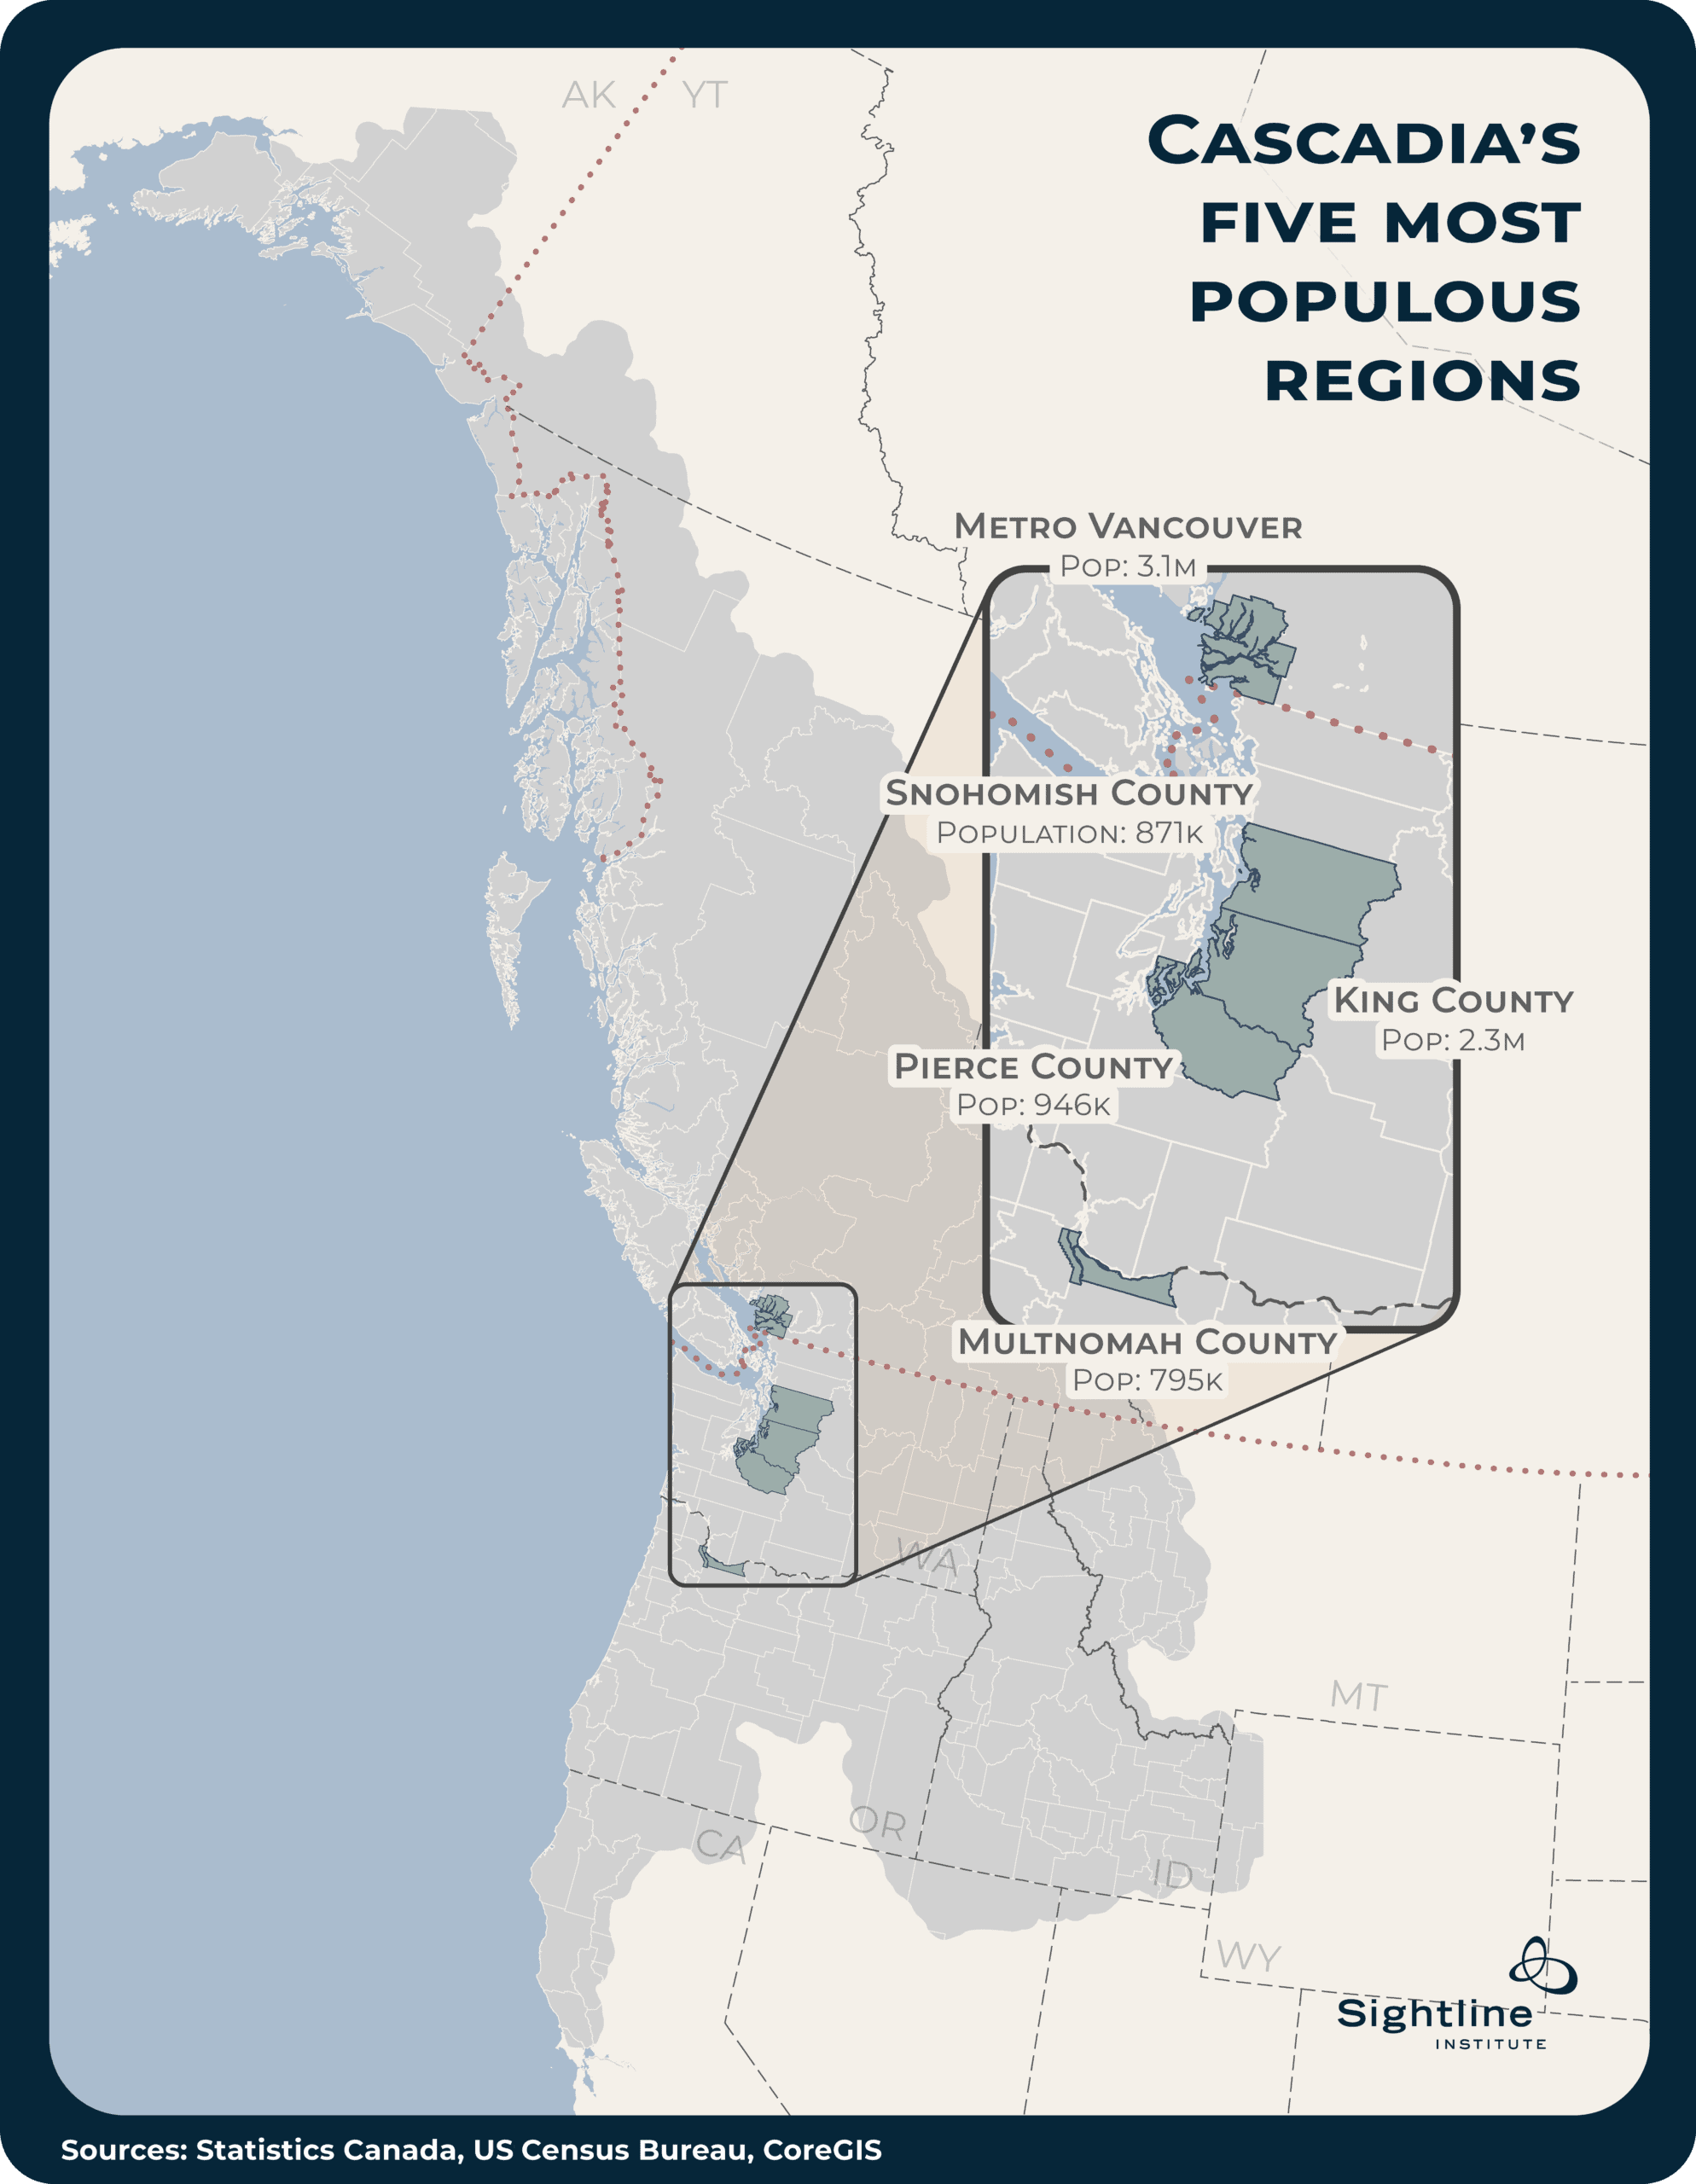
Three subnational divisions’ largest county equivalents fall into the five most populous of the bioregion: British Columbia, Washington, and Oregon. The largest Cascadian jurisdictions in the remaining six regions range from 550,000 to under 1,000 residents. (The Yukon has fewer than 50,000 residents across the entire territory, and its largest Cascadian settlement is the 688-person village of Haines Junction, the fourth largest municipality in the territory.)6
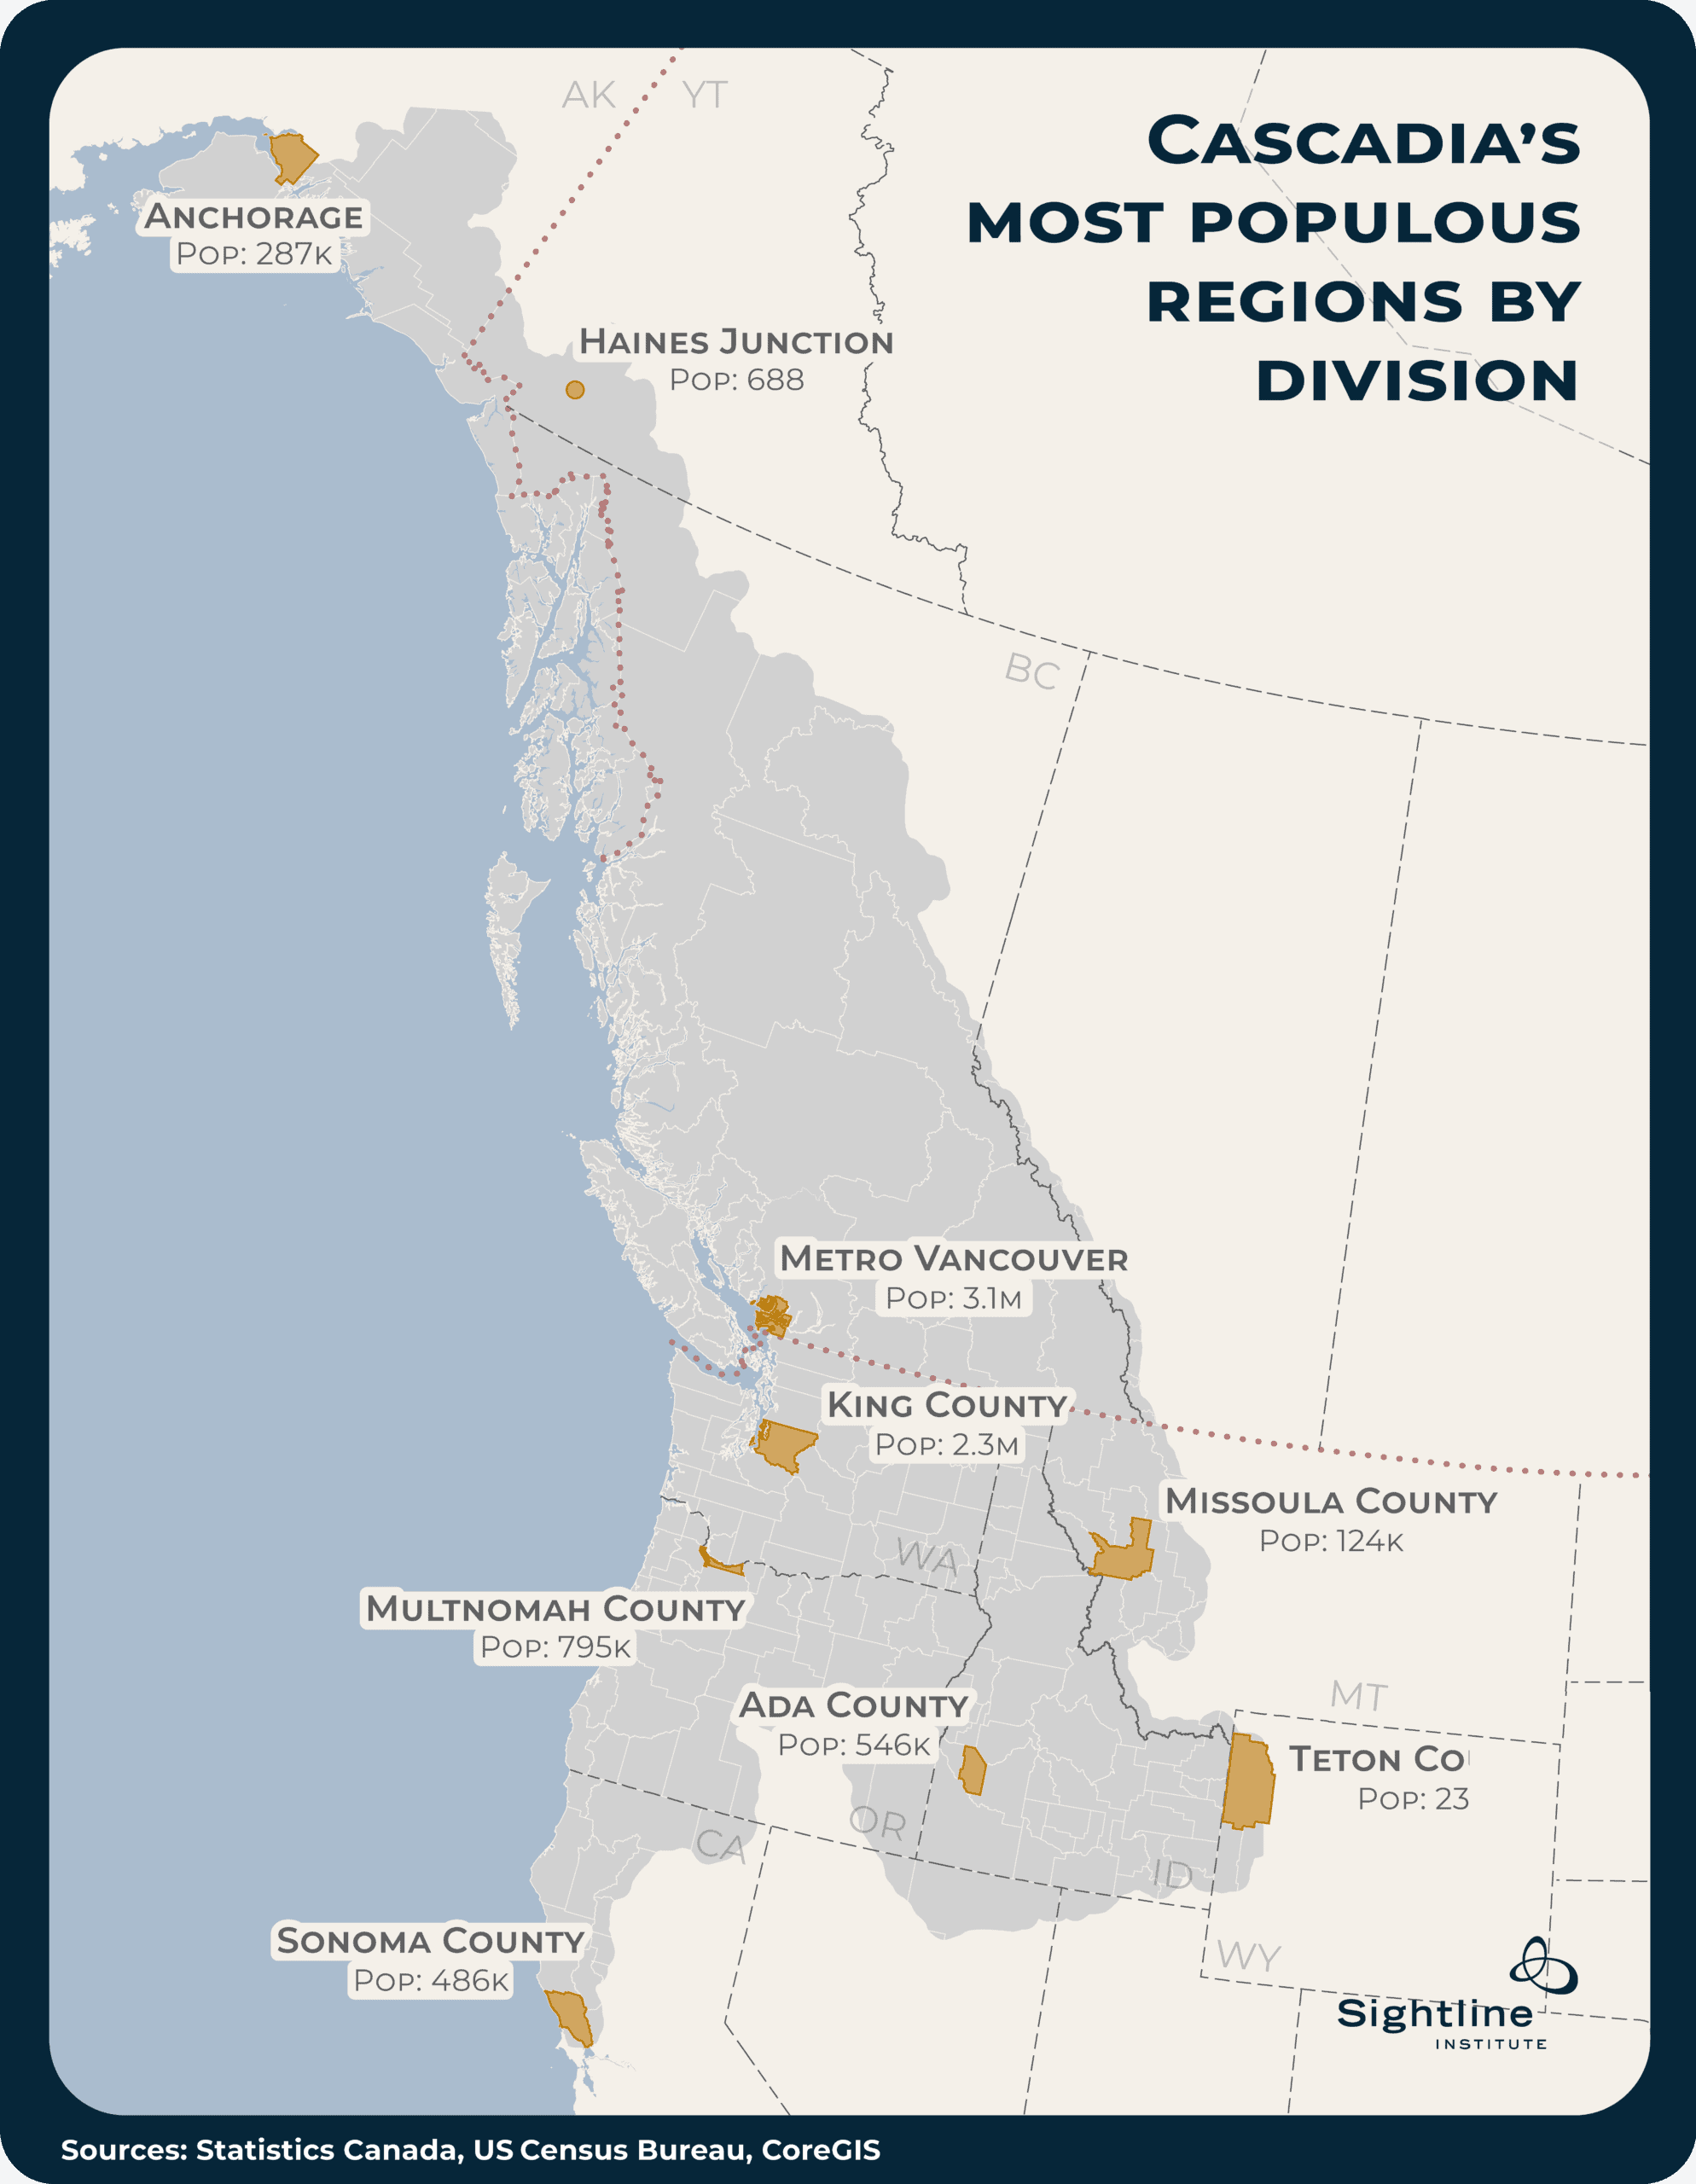
Government boundaries don’t neatly divide populations. Most people live in a handful of high-population county equivalents, while most county equivalents have a small population. Cascadia is no exception. The ten largest county equivalents—from Sonoma County, California, on up—are home to 10.8 million Cascadians, while the other half of the region is spread out across the other 165 jurisdictions. And a quarter of Cascadians hail from just two jurisdictions: the Metro Vancouver Regional District, British Columbia; and King County, Washington.7
Division |
County equivalent |
Population |
Cascadians in jurisdictions this size or larger |
Share of Cascadians in jurisdictions this size or larger |
|---|---|---|---|---|
| British Columbia | Metro Vancouver (Greater Vancouver) Regional District | 3,087,023 | 3,087,023 | 14.3% |
| Washington | King County | 2,344,939 | 5,431,962 | 25.2% |
| Washington | Pierce County | 946,288 | 6,378,250 | 29.6% |
| Washington | Snohomish County | 870,656 | 7,248,906 | 33.6% |
| Oregon | Multnomah County | 795,391 | 8,044,297 | 37.3% |
| Oregon | Washington County | 611,708 | 8,656,005 | 40.1% |
| Washington | Spokane County | 558,344 | 9,214,349 | 42.7% |
| Idaho | Ada County | 546,141 | 9,760,490 | 45.3% |
| Washington | Clark County | 532,119 | 10,292,609 | 47.7% |
| California | Sonoma County | 486,444 | 10,779,053 | 50.0% |
| British Columbia | Capital Regional District | 464,082 | 11,243,135 | 52.1% |
| Oregon | Clackamas County | 426,280 | 11,669,415 | 54.1% |
| Oregon | Lane County | 381,584 | 12,050,999 | 55.9% |
| British Columbia | Fraser Valley Regional District | 369,211 | 12,420,210 | 57.6% |
| Oregon | Marion County | 355,777 | 12,775,987 | 59.3% |
| Washington | Thurston County | 304,261 | 13,080,248 | 60.7% |
| Alaska | Anchorage Municipality | 287,155 | 13,367,403 | 62.0% |
| Washington | Kitsap County | 283,374 | 13,650,777 | 63.3% |
| Idaho | Canyon County | 275,123 | 13,925,900 | 64.6% |
| Washington | Yakima County | 259,185 | 14,185,085 | 65.8% |
| British Columbia | Central Okanagan Regional District | 254,635 | 14,439,720 | 67.0% |
| Washington | Whatcom County | 236,392 | 14,676,112 | 68.1% |
| Oregon | Jackson County | 221,795 | 14,897,907 | 69.1% |
| Washington | Benton County | 221,722 | 15,119,629 | 70.1% |
| Oregon | Deschutes County | 213,072 | 15,332,701 | 71.1% |
| Idaho | Kootenai County | 191,864 | 15,524,565 | 72.0% |
| British Columbia | Nanaimo Regional District | 187,662 | 15,712,227 | 72.9% |
| British Columbia | Thompson-Nicola Regional District | 158,059 | 15,870,286 | 73.6% |
| Idaho | Bonneville County | 135,771 | 16,006,057 | 74.2% |
| Washington | Skagit County | 132,975 | 16,139,032 | 74.9% |
| Oregon | Linn County | 132,843 | 16,271,875 | 75.5% |
| California | Humboldt County | 131,647 | 16,403,522 | 76.1% |
| Montana | Missoula County | 123,513 | 16,527,035 | 76.6% |
| Montana | Flathead County | 115,429 | 16,642,464 | 77.2% |
| Washington | Cowlitz County | 114,885 | 16,757,349 | 77.7% |
| Oregon | Douglas County | 111,951 | 16,869,300 | 78.2% |
| Oregon | Yamhill County | 110,024 | 16,979,324 | 78.7% |
| British Columbia | Fraser-Fort George Regional District | 107,639 | 17,086,963 | 79.2% |
| Washington | Grant County | 105,727 | 17,192,690 | 79.7% |
| Washington | Franklin County | 102,612 | 17,295,302 | 80.2% |
| British Columbia | North Okanagan Regional District | 100,142 | 17,395,444 | 80.7% |
| Oregon | Benton County | 97,728 | 17,493,172 | 81.1% |
| Idaho | Twin Falls County | 97,539 | 17,590,711 | 81.6% |
| British Columbia | Cowichan Valley Regional District | 95,822 | 17,686,533 | 82.0% |
| British Columbia | Okanagan-Similkameen Regional District | 94,327 | 17,780,860 | 82.5% |
| Idaho | Bannock County | 91,591 | 17,872,451 | 82.9% |
| Oregon | Polk County | 90,037 | 17,962,488 | 83.3% |
| California | Mendocino County | 88,122 | 18,050,610 | 83.7% |
| Washington | Lewis County | 88,062 | 18,138,672 | 84.1% |
| Oregon | Josephine County | 87,867 | 18,226,539 | 84.5% |
| Washington | Island County | 85,657 | 18,312,196 | 84.9% |
| Washington | Chelan County | 81,941 | 18,394,137 | 85.3% |
| Oregon | Umatilla County | 81,119 | 18,475,256 | 85.7% |
| British Columbia | Comox Valley Regional District | 80,105 | 18,555,361 | 86.1% |
| Washington | Clallam County | 78,202 | 18,633,563 | 86.4% |
| Washington | Grays Harbor County | 78,144 | 18,711,707 | 86.8% |
| British Columbia | East Kootenay Regional District | 72,880 | 18,784,587 | 87.1% |
| Washington | Mason County | 71,165 | 18,855,752 | 87.4% |
| Oregon | Klamath County | 70,274 | 18,926,026 | 87.8% |
| British Columbia | Central Kootenay Regional District | 68,593 | 18,994,619 | 88.1% |
| British Columbia | Cariboo Regional District | 67,002 | 19,061,621 | 88.4% |
| Oregon | Coos County | 63,992 | 19,125,613 | 88.7% |
| British Columbia | Columbia-Shuswap Regional District | 62,795 | 19,188,408 | 89.0% |
| Washington | Walla Walla County | 62,361 | 19,250,769 | 89.3% |
| Alaska | Kenai Peninsula Borough | 61,951 | 19,312,720 | 89.6% |
| British Columbia | Squamish-Lillooet Regional District | 56,588 | 19,369,308 | 89.8% |
| Idaho | Madison County | 55,172 | 19,424,480 | 90.1% |
| Idaho | Bonner County | 54,420 | 19,478,900 | 90.3% |
| Oregon | Columbia County | 54,091 | 19,532,991 | 90.6% |
| British Columbia | Strathcona Regional District | 51,853 | 19,584,844 | 90.8% |
| Idaho | Bingham County | 51,153 | 19,635,997 | 91.1% |
| Oregon | Lincoln County | 50,636 | 19,686,633 | 91.3% |
| Washington | Stevens County | 49,668 | 19,736,301 | 91.5% |
| Washington | Kittitas County | 48,803 | 19,785,104 | 91.8% |
| Montana | Ravalli County | 48,582 | 19,833,686 | 92.0% |
| Washington | Whitman County | 48,512 | 19,882,198 | 92.2% |
| Washington | Douglas County | 46,473 | 19,928,671 | 92.4% |
| Washington | Okanogan County | 45,230 | 19,973,901 | 92.6% |
| Idaho | Nez Perce County | 42,905 | 20,016,806 | 92.8% |
| British Columbia | Kitimat-Stikine Regional District | 42,423 | 20,059,229 | 93.0% |
| California | Siskiyou County | 42,013 | 20,101,242 | 93.2% |
| Idaho | Latah County | 41,842 | 20,143,084 | 93.4% |
| Oregon | Clatsop County | 40,926 | 20,184,010 | 93.6% |
| British Columbia | Bulkley-Nechako Regional District | 39,468 | 20,223,478 | 93.8% |
| British Columbia | Alberni-Clayoquot Regional District | 36,303 | 20,259,781 | 94.0% |
| Montana | Silver Bow County | 36,118 | 20,295,899 | 94.1% |
| British Columbia | Kootenay Boundary Regional District | 35,509 | 20,331,408 | 94.3% |
| Idaho | Jefferson County | 35,297 | 20,366,705 | 94.5% |
| British Columbia | Sunshine Coast Regional District | 34,589 | 20,401,294 | 94.6% |
| Washington | Jefferson County | 33,970 | 20,435,264 | 94.8% |
| Montana | Lake County | 33,392 | 20,468,656 | 94.9% |
| Oregon | Malheur County | 32,261 | 20,500,917 | 95.1% |
| Alaska | Juneau City and Borough | 31,609 | 20,532,526 | 95.2% |
| Idaho | Elmore County | 29,465 | 20,561,991 | 95.4% |
| Idaho | Payette County | 27,824 | 20,589,815 | 95.5% |
| Oregon | Crook County | 27,564 | 20,617,379 | 95.6% |
| Oregon | Tillamook County | 27,384 | 20,644,763 | 95.7% |
| California | Del Norte County | 26,410 | 20,671,173 | 95.9% |
| Idaho | Cassia County | 26,397 | 20,697,570 | 96.0% |
| Idaho | Jerome County | 26,362 | 20,723,932 | 96.1% |
| Oregon | Wasco County | 26,310 | 20,750,242 | 96.2% |
| Oregon | Union County | 25,900 | 20,776,142 | 96.4% |
| Oregon | Jefferson County | 25,740 | 20,801,882 | 96.5% |
| Idaho | Blaine County | 25,517 | 20,827,399 | 96.6% |
| Washington | Pacific County | 24,357 | 20,851,756 | 96.7% |
| Washington | Klickitat County | 24,331 | 20,876,087 | 96.8% |
| Oregon | Hood River County | 23,720 | 20,899,807 | 96.9% |
| Wyoming | Teton County | 23,333 | 20,923,140 | 97.0% |
| British Columbia | qathet (Powell River) Regional District | 23,039 | 20,946,179 | 97.1% |
| Idaho | Minidoka County | 22,911 | 20,969,090 | 97.3% |
| Oregon | Curry County | 22,621 | 20,991,711 | 97.4% |
| Washington | Asotin County | 22,545 | 21,014,256 | 97.5% |
| Montana | Lincoln County | 22,328 | 21,036,584 | 97.6% |
| Idaho | Gem County | 21,773 | 21,058,357 | 97.7% |
| Washington | Adams County | 21,488 | 21,079,845 | 97.8% |
| Wyoming | Lincoln County | 21,180 | 21,101,025 | 97.9% |
| British Columbia | North Coast (Skeena-Queen Charlotte) Regional District | 19,133 | 21,120,158 | 98.0% |
| Washington | San Juan County | 18,577 | 21,138,735 | 98.0% |
| Idaho | Idaho County | 17,874 | 21,156,609 | 98.1% |
| Oregon | Baker County | 16,658 | 21,173,267 | 98.2% |
| Idaho | Gooding County | 16,446 | 21,189,713 | 98.3% |
| California | Trinity County | 15,720 | 21,205,433 | 98.3% |
| Washington | Pend Oreille County | 14,457 | 21,219,890 | 98.4% |
| Idaho | Fremont County | 14,208 | 21,234,098 | 98.5% |
| Idaho | Shoshone County | 14,130 | 21,248,228 | 98.5% |
| Montana | Sanders County | 14,062 | 21,262,290 | 98.6% |
| Idaho | Boundary County | 13,997 | 21,276,287 | 98.7% |
| Alaska | Ketchikan Gateway Borough | 13,549 | 21,289,836 | 98.7% |
| Idaho | Teton County | 13,254 | 21,303,090 | 98.8% |
| Idaho | Valley County | 12,831 | 21,315,921 | 98.9% |
| Washington | Skamania County | 12,669 | 21,328,590 | 98.9% |
| Idaho | Owyhee County | 12,661 | 21,341,251 | 99.0% |
| Oregon | Morrow County | 12,602 | 21,353,853 | 99.0% |
| Washington | Lincoln County | 11,982 | 21,365,835 | 99.1% |
| Idaho | Washington County | 11,583 | 21,377,418 | 99.1% |
| British Columbia | Mount Waddington Regional District | 11,349 | 21,388,767 | 99.2% |
| Idaho | Benewah County | 10,508 | 21,399,275 | 99.2% |
| Montana | Deer Lodge County | 9,709 | 21,408,984 | 99.3% |
| Idaho | Clearwater County | 9,118 | 21,418,102 | 99.3% |
| Idaho | Boise County | 8,545 | 21,426,647 | 99.4% |
| Idaho | Lemhi County | 8,474 | 21,435,121 | 99.4% |
| Alaska | Sitka City and Borough | 8,319 | 21,443,440 | 99.5% |
| Idaho | Power County | 8,246 | 21,451,686 | 99.5% |
| Oregon | Wallowa County | 7,595 | 21,459,281 | 99.5% |
| Washington | Ferry County | 7,517 | 21,466,798 | 99.6% |
| Montana | Powell County | 7,157 | 21,473,955 | 99.6% |
| Oregon | Grant County | 7,075 | 21,481,030 | 99.6% |
| Alaska | Chugach Census Area | 6,553 | 21,487,583 | 99.7% |
| Alaska | Prince of Wales-Hyder Census Area | 5,777 | 21,493,360 | 99.7% |
| Idaho | Lincoln County | 5,603 | 21,498,963 | 99.7% |
| Montana | Mineral County | 5,185 | 21,504,148 | 99.7% |
| Idaho | Adams County | 5,013 | 21,509,161 | 99.8% |
| Washington | Wahkiakum County | 4,873 | 21,514,034 | 99.8% |
| Idaho | Custer County | 4,636 | 21,518,670 | 99.8% |
| Washington | Columbia County | 4,141 | 21,522,811 | 99.8% |
| British Columbia | Central Coast Regional District | 3,962 | 21,526,773 | 99.8% |
| Idaho | Lewis County | 3,704 | 21,530,477 | 99.9% |
| Montana | Granite County | 3,658 | 21,534,135 | 99.9% |
| Alaska | Petersburg Borough | 3,394 | 21,537,529 | 99.9% |
| Idaho | Butte County | 2,783 | 21,540,312 | 99.9% |
| Alaska | Copper River Census Area | 2,666 | 21,542,978 | 99.9% |
| Washington | Garfield County | 2,416 | 21,545,394 | 99.9% |
| Alaska | Hoonah-Angoon Census Area | 2,271 | 21,547,665 | 99.9% |
| Alaska | Haines Borough | 2,068 | 21,549,733 | 99.9% |
| Oregon | Sherman County | 2,051 | 21,551,784 | 100.0% |
| Alaska | Wrangell City and Borough | 2,007 | 21,553,791 | 100.0% |
| Oregon | Gilliam County | 1,971 | 21,555,762 | 100.0% |
| Oregon | Wheeler County | 1,472 | 21,557,234 | 100.0% |
| Idaho | Camas County | 1,316 | 21,558,550 | 100.0% |
| Alaska | Skagway Municipality | 1,104 | 21,559,654 | 100.0% |
| Idaho | Clark County | 783 | 21,560,437 | 100.0% |
| Yukon | Haines Junction Village | 688 | 21,561,125 | 100.0% |
| Alaska | Yakutat City and Borough | 672 | 21,561,797 | 100.0% |
| Yukon | Champagne Landing 10 Indian Settlement | 22 | 21,561,819 | 100.0% |
| Yukon | Kloo Lake Indian Settlement | 0 | 21,561,819 | 100.0% |
Cascadia holds 21 million unique stories
The bioregion’s 21 million people form a diverse group. Canada conducts its twice-a-decade census this year, and we’re over halfway to the next decennial US census.
These censuses will help decisionmakers across the region answer questions about the population. How much green infrastructure funding goes to a town? Which schools should be opened or closed? Do legislative district boundaries need to be redrawn? Some parts of the region are growing faster than others, and knowing where Cascadians are going will help us all plan for the future.
This article is the first in Who is Cascadia, a new Sightline series on the populations of the bioregion. In future installments, I’ll explore more demographic characteristics, behaviors, and beliefs of the region’s people.
Appendix
For the analysis in this series, Sightline assembled a list of census tabulation regions that approximate Cascadia’s natural boundaries. Most jurisdictions were clearly within the region or outside it, but some located on the edge required judgment calls. The full list includes
- Every borough and census area in Southeast Alaska, plus the Municipality of Anchorage, Chugach Census Area, Copper River Census Area, and Kenai Peninsula Borough
- Every census division in British Columbia except Northern Rockies, Peace River, and Stikine
- Del Norte, Humboldt, Mendocino, Siskiyou, Sonoma, and Trinity Counties in California
- Every county in Idaho except Bear Lake, Caribou, Franklin, and Oneida
- Deer Lodge, Flathead, Granite, Lake, Lincoln, Mineral, Missoula, Powell, Ravalli, Sanders, and Silver Bow Counties in Montana
- Every county in Oregon except Harney and Lake
- Every county in Washington
- Lincoln and Teton Counties in Wyoming
- The census subdivisions of Haines Junction, Kloo Lake, and Champagne Landing 10 in Yukon
- No counties in Nevada or Utah, because the population centers of the overlapping counties fall outside Cascadia
Population counts in this piece are from annual population estimates by Statistics Canada and the US Census Bureau. Historical counts come from the US decennial census (2000, 2010, and 2020) and the Canadian Census of Population (2001, 2011, and 2021). While there are many benefits to using these data, there are also a few downsides. Of note,
- The most recent censuses are already five or six years old; all contemporary population data depend more on survey estimates and administrative records.
- Censuses conducted a year apart (e.g., the 2020 US census and the 2021 Canadian census) are not exactly comparable.
- Censuses can have overcounts and undercounts, which may disproportionately affect certain groups such as Indigenous communities.
- Any survey can flatten the nuance of people’s lives and identities into categories such as “multiracial” or “homeowner” or the ever-nebulous “other.”
- Combining the Canadian and US censuses requires judgment calls on integrating the differing categories and questions. These may not always be compatible.
- Focusing on government records biases analysts toward topics that are available and easily tabulated.
