fbpx
Donate Newsletters

Welcome to Sightline Institute’s redesigned website!

You’ll find our same top-notch solutions research, just with a fresh new look. Learn more here about new features, or simply browse as usual. 

Transit Score: Cascadia Smackdown

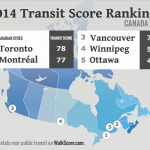
The 2014 Canadian Transit Scores are out…and Vancouver, BC clocks in as the third most transit-friendly city in the Great White North, narrowly bested by Toronto and Montreal. Pretty good, eh?

Canada Transit Score
Canadian Transit Scores by Walk Score (Used with permission)

But what’s even better: when you combine Canada and the US, Vancouver comes in at number 6! The only US cities with a better Transit Score than Vancouver are New York, San Francisco, and Boston.

Looking more narrowly within the Cascadia bioregion, Vancouver’s Transit Score beats the pants off its nearest two rivals. Portland and Seattle both do pretty well within the US, with Transit Scores of 50 and 57, respectively. But Vancouver shellacks both cities, with a score of 74.

So why does Vancouver’s Transit Score outstrip Seattle’s and Portland’s so handily?

Read more

Gas Consumption Shifting Into Reverse?

Many Northwest drivers are preparing to top up their tanks for travel this Labor Day weekend—and will pay dearly for the privilege. But there’s new evidence that high fuel prices are curbing our appetite for gas.

We detail the evidence in our latest report: Shifting Into Reverse. According to state and federal data, total gasoline consumption in Oregon and Washington in 2011 was about 4 percent lower than it was in 2002—the year that overall motor fuel consumption in the two states peaked. And early data suggests that high prices in the first part of 2012 sent fuel consumption even lower this year.

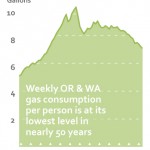
Meanwhile, the region’s population keeps growing—which means that fuel consumption per person keeps falling. In fact, per capita gasoline consumption is now at its lowest level in nearly 50 years.

The chart to the right shows the long-term trends. Gas consumption per capita skyrocketed during the post-war period, up until the oil crisis of 1979—a year when oil prices spiked. That was followed by years of volatility as the Northwest economy cratered and recovered, and federal fuel economy standards ushered rapid efficiency gains in the vehicle fleet. In the late 1980s, fuel consumption per capita hit a bumpy plateau. But once gas prices started to rise in 1999, the region’s drivers have been consuming less and less gas.

Read more

Who Won The Olympics?

flickr, Plashing Vole

The closing ceremony is over, the medals have all been awarded…but there’s still time to argue over Olympic glory. And since there are no more actual athletic competitions to judge, the only thing that we geeks have to argue about is the numbers.

By some measures, the US was the standout performer of the 2012 summer Olympics.  With more golds, more silvers, and more total medals than any other nation, it sure looks like the US has a lock on the gold medal for most athletic country, right?

Not so fast. Sure, the US got a lot of medals. But there are also an awful lot of us: we’re the third most populous nation in the world, trailing only China and India. We’re also a wealthy nation—and as New York Times blogger Nate Silver convincingly argues here, wealthy nations have an Olympic-sized advantage in racking up medals. So, naturally, you’d expect a wealthy nation with lots and lots of residents to earn a lot of medals.

So after adjusting for population, how did the US do in the Olympics? Gauged by medals per capita, our performance was nowhere near medal-worthy. Among the 85 nations that received at least one medal, the US ranked 28th in the number of gold medals per capita, and a lowly 49th in total medals per capita. In a word…meh.

Interestingly, the three standouts in the medals-per-capita race were all Caribbean nations that specialize in track and field. Tiny Grenada netted just one medal—Kirani James‘s gold in the men’s 400m. Yet with a population of just 105,000, James’s performance earned Grenada far and away the most golds per capita, and also the most total medals per capita.

Coming in at silver in medals per capita was Jamaica. Usain Bolt got the headlines, but their entire short-distance track team was dominating, garnering 12 medals—including 4 of each flavor—from a national population of about 2.7 million.  (That’s less than one one-hundredth of the size of the US.)

Nabbing the bronze in the per-capita medal race was Trinidad and Tobago, with 4 medals—a gold in the javelin and 3 third-place finishes in other track events—out of a population of 1.3 million. All three of the top per-capita medal earning nations have less economic output per capita than the US—which pushes them even farther ahead in the adjusted medal-winning rankings.

After the jump, the top 20 finishers in the medals per capita race:

Read more