fbpx
Donate Newsletters

The No DAPL Movement: New Shapes, New Fronts

Editor’s note: The following is a guest article by Mark Trahant, originally published at TrahantReports.com. Mark is the Charles R. Johnson Endowed Professor of Journalism at the University of North Dakota, a Sightline board member, an independent journalist, and a member of The Shoshone-Bannock Tribes. He has been closely following events around the Dakota Access … Read more

Dakota Access Pipeline: Misleading the Court, the Public…or Both?

The company behind the Dakota Access Pipeline (DAPL) owes its investors a straight answer: does it face a January 1 contractual deadline with its shippers, or doesn’t it? Company spokespeople have told the court that they do, but told the press that they don’t. Now, with less than two weeks before the alleged deadline, it’s … Read more

DAPL: “The Fight Will Continue, and It Can Still Be Won”

Editor’s note: Sightline publishes guest articles only rarely. We publish this reflection by Zarina because we feel it highlights a crucial human dimension to the thin green line, the growing movement to obstruct fossil fuel infrastructure. Although the Dakota Access Pipeline is beyond the borders of Cascadia, the opposition movement is of monumental importance to … Read more

The Rickety Finances Behind the Dakota Access Pipeline

Sightline Institute this week co-published a report noting weaknesses in the financing behind the Dakota Access Pipeline (DAPL) and questions around the long-term usefulness of the project. The report—The High-Risk Financing Behind the Dakota Access Pipeline: A Potential Stranded Asset in the Bakken Region of North Dakota—describes how the company behind the pipeline is under extreme … Read more

8 Great Things about the Alberta Climate Plan

Author’s note: Unless otherwise indicated, all dollar amounts are in Canadian dollars. Back in May, voters in Canada’s most conservative province got fed up with 44 consecutive years of conservative rule and elected the New Democratic Party (NDP) (NDP is to the left of the Liberal Party that won the federal election in October). The new leadership wasted no … Read more

All the World’s Carbon Pricing Systems in One Animated Map

[button link='{“url”:”http://www.sightline.org/2017/06/06/map-the-future-is-carbon-priced-and-the-us-is-getting-left-behind/”,”title”:”Click here for an updated version of this map”}’]

Editor’s note: We updated this map in 2017—you can see it here.

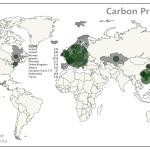
Oregon and Washington leaders are contemplating turbocharging their clean energy transition by instituting carbon pricing here in the Pacific Northwest. Will a cap or tax on carbon work? Has anyone else ever done this before? Why, yes. Since you ask: Scandinavian countries have been pricing carbon for more than two decades. The European Union Emissions Trading System (EU ETS) has been pricing carbon for almost a decade. US states and Canadian provinces have been pricing for years. Today, there are 39 (1) different programs that collectively put a price on 12 percent of all the greenhouse gas (GHG) emissions in the world. And when China’s national program starts in 2016, almost a quarter of global GHG pollution will carry a price tag to speed the changeover to clean energy. The animated map below shows carbon pricing programs around the world, with the size of the bubbles indicating the amount of pollution priced.

Click to enlarge. Original Sightline Institute graphic, available under our free use policy.

Carbon pricing programs come in many flavors: tax, cap-and-trade, or hybrids, and implemented at the level of country, region, state, or even city. (A fully sort-able table of the programs is at the bottom of this article.) The biggest program is the EU ETS, covering a little less than 2,000 million metric tons (MMT) of GHG emissions, or about 45 percent of all the emissions in the European Union. Japan’s carbon tax is the next biggest player, covering about 800 MMT, or 70 percent of Japan’s emissions. China, with several years of pilot project experience under its belt, is now committed to rolling out a cap-and-trade program in 2016 that will dwarf both the EU and Japan’s programs, probably covering about 5,000 MMT of pollution. For reference: the entire world emits about 36,000 MMT, so China’s program alone will price about 13 percent of global emissions. To get a sense of how the carbon pricing programs relate to global emissions, the map below shows the world’s biggest polluters. (You can also see countries re-sized by emissions here.) The US has a conspicuous mismatch between its large red pollution bubble and the lack of a green price bubble. President Obama, not to be outdone by the Chinese, has announced an agreement with China to cut carbon pollution. However, new Congressional leadership has vowed to move in the opposite direction by delaying and undermining federal efforts to cut pollution.

Original Sightline Institute graphic, available under our free use policy.

Here are a few questions about global carbon pricing programs that Pacific Northwest leaders might want answered:

Read more

There’s Plenty of Room at Hotel California

Pretend you’re the governor of Oregon or Washington, or the head of a key committee in the state legislature in Salem or Olympia. Let’s say you’re convinced: Climate change is real, it’s a huge risk, and we need a fast, smooth transition beyond carbon fuels. Putting a price on carbon is the single best way to nudge the whole economy in that direction.

What do you do? Designing an entire carbon pricing system from scratch… that’s a lot of work! Isn’t there an “off-the-rack” option available? There is! There are, actually. British Columbia’s carbon tax shift is ready to copy. Or, if you prefer to link up with the best US carbon market, California has spent the past eight years building a state-of-the-art cap-and-trade program and writing all the rules and regulations to go with it. Not only that, but Oregon and Washington have already done some of the groundwork for linking to California by contributing to the Western Climate Initiative’s 2010 framework.

Linking isn’t just a way to avoid recreating the wheel. It has a lot of benefits: it can cut the cost of reducing pollution, reduce the risk that emissions will “leak” across state borders, trim the costs of administering the program, and make it simpler for multi-state entities to comply because the rules are the same across borders.

That all sounds great. What do you need to do? Here is a summary of what Oregon or Washington would need to do to link, with comparisons to California’s linkage with Quebec this year.

Read more

Why Washington State Should Adopt a BC-style Carbon Tax

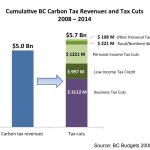
Cumulative BC Carbon Tax Revenues and Tax Cuts 2008-2014

Editor’s Note: Washington’s Carbon Emissions Reduction Taskforce is on the job, weighing alternative carbon-pricing proposals. Some members of the panel have asked what our ideal policy would be for Washington State. Yoram Bauman shares his thoughts today. Alan Durning will share his argument for a California-style cap-and-trade system, with key modifications, another day.

If I had my druthers, Washington State would push for a BC-style revenue-neutral carbon tax. Full disclosure: I’m part of the CarbonWA.org campaign to put just such a policy on the ballot in Washington State in 2016. In this article you’ll find information on the latest iteration of the CarbonWA policy proposal.

The BC approach

The basic idea behind the BC approach is to phase in a carbon tax on fossil fuels and pair it with broad-based tax reductions that benefit most households and businesses—which BC does by reducing personal and corporate income taxes—plus targeted tax reductions that focus on communities that may be disproportionately affected by the carbon tax, such as low-income households. (To match the language I’ve used in previous posts, the broad-based tax reduction is the entrée and the targeted benefits are the side dishes.)

Cumulative BC Carbon Tax Revenues and Tax Cuts 2008-2014
Chart by BC Budgets 2008-2013 (Used with permission.)

Adapting the BC approach for Washington State

Something very much like the BC approach might work in Oregon, which, like BC, has an income tax. But Washington State has no income tax, so the CarbonWA proposal is for the entrée to be a reduction in the state sales tax, which generates revenue from just about all of the state’s households, businesses, and organizations, and for the side dishes to be targeted benefits for low-income households, manufacturers, and small businesses.

Read more

Four Carbon Pricing Pitfalls to Avoid

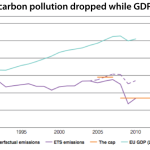
Despite its widely discussed woes, every year the European Union Emissions Trading System (EU ETS) cuts more carbon pollution than the entire state of Oregon spits out. That’s no small feat. The EU cap-and-trade program limits carbon dioxide emissions from more than 11,000 power stations and industrial plants in 31 participating countries, covering 45 percent of the EU’s total greenhouse gas (GHG) emissions. The market has operated for nearly a decade with no price manipulation and no deleterious economic impacts, and it is on track to reduce pollution 21 percent below 2005 levels by 2020.

Nonetheless, the early years were rocky for Europe’s carbon-pricing pioneer. Here’s what Oregon and Washington can learn from the EU’s missteps.

(1) Set the cap right

(1.1) Use actual emissions data.

The EU ETS began with a pilot phase from 2005 to 2007. During this phase, to quell industry fears and opposition, the EU gave companies carbon allowances for free. Because the EU did not have verified emissions data, it asked companies to estimate the number of allowances they would need. Unsurprisingly, some power plants and industrial facilities used over-optimistic growth projections and overestimated their future emissions, so the EU handed out more allowances than needed. When verified emissions data became available in 2006, participants realized that there were too many carbon allowances in the market, and the price crashed.

California learned from this experience and began collecting verified emissions data years before starting its cap-and-trade program. It then based its cap on actual emissions, not self-reported estimates. Cascadia can avoid over-allocation and price shocks by setting its cap based on verified emissions data. It can help the market function smoothly by making this data publicly available and keeping it transparent.

Read more

Reggie Recommends

If you still need to meet Reggie, you can get introduced in Part 1.

(1) Yes, you can lower emissions without harming the economy.

RGGI’s CO2 emissions from electricity dropped by more than 40 percent between 2005 and 2012 while the region’s economy improved. The entire US economy has been slowly backing away from its unhealthy, codependent relationship with energy use, but RGGI’s economy has really broken it off. Below, RGGI CO2 emissions (blue dotted line) steeply declined from 2005 to the present, while RGGI state economies (blue solid line) improved. The US’s failure to cut emissions (dotted red) as fast as RGGI hasn’t helped the economy (solid red).

RGGI Performance To-Date and the Path Ahead, May 2014, by ENE
RGGI Performance To-Date and the Path Ahead, May 2014 by ENE (Used with permission.)

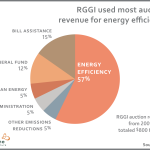
The big secrets to scaling down emissions while maintaining a healthy economy are: 1) increase energy efficiency, and 2) decrease imports of dirty out-of-state power. That should make Cascadia’s ears perk up: we have some great energy efficiency experience, and most of our dirty power comes from out of state.

Some of the dramatic decrease in RGGI’s emissions was due to lower electricity consumption, driven partly by energy efficiency programs funded by RGGI auction revenue. Some was due to shifting away from coal and petroleum.

Below, you can see that total electricity use in the RGGI states was lower in 2012 than in 2005. You can also see the changing fuel mix: coal and petroleum (red and brown) generated one-third of RGGI states’ power in 2005, but only 10 percent in 2012! Natural gas (orange) rose from one-quarter to nearly half. This change was driven by several factors, including: 1) the price of natural gas dropped relative to the prices of coal and oil, 2) coal capacity decreased as coal plants were retired or converted to natural gas, and 3) RGGI’s price for carbon piled on to widen the price gap.

Read more