To Build Fast, Think Small
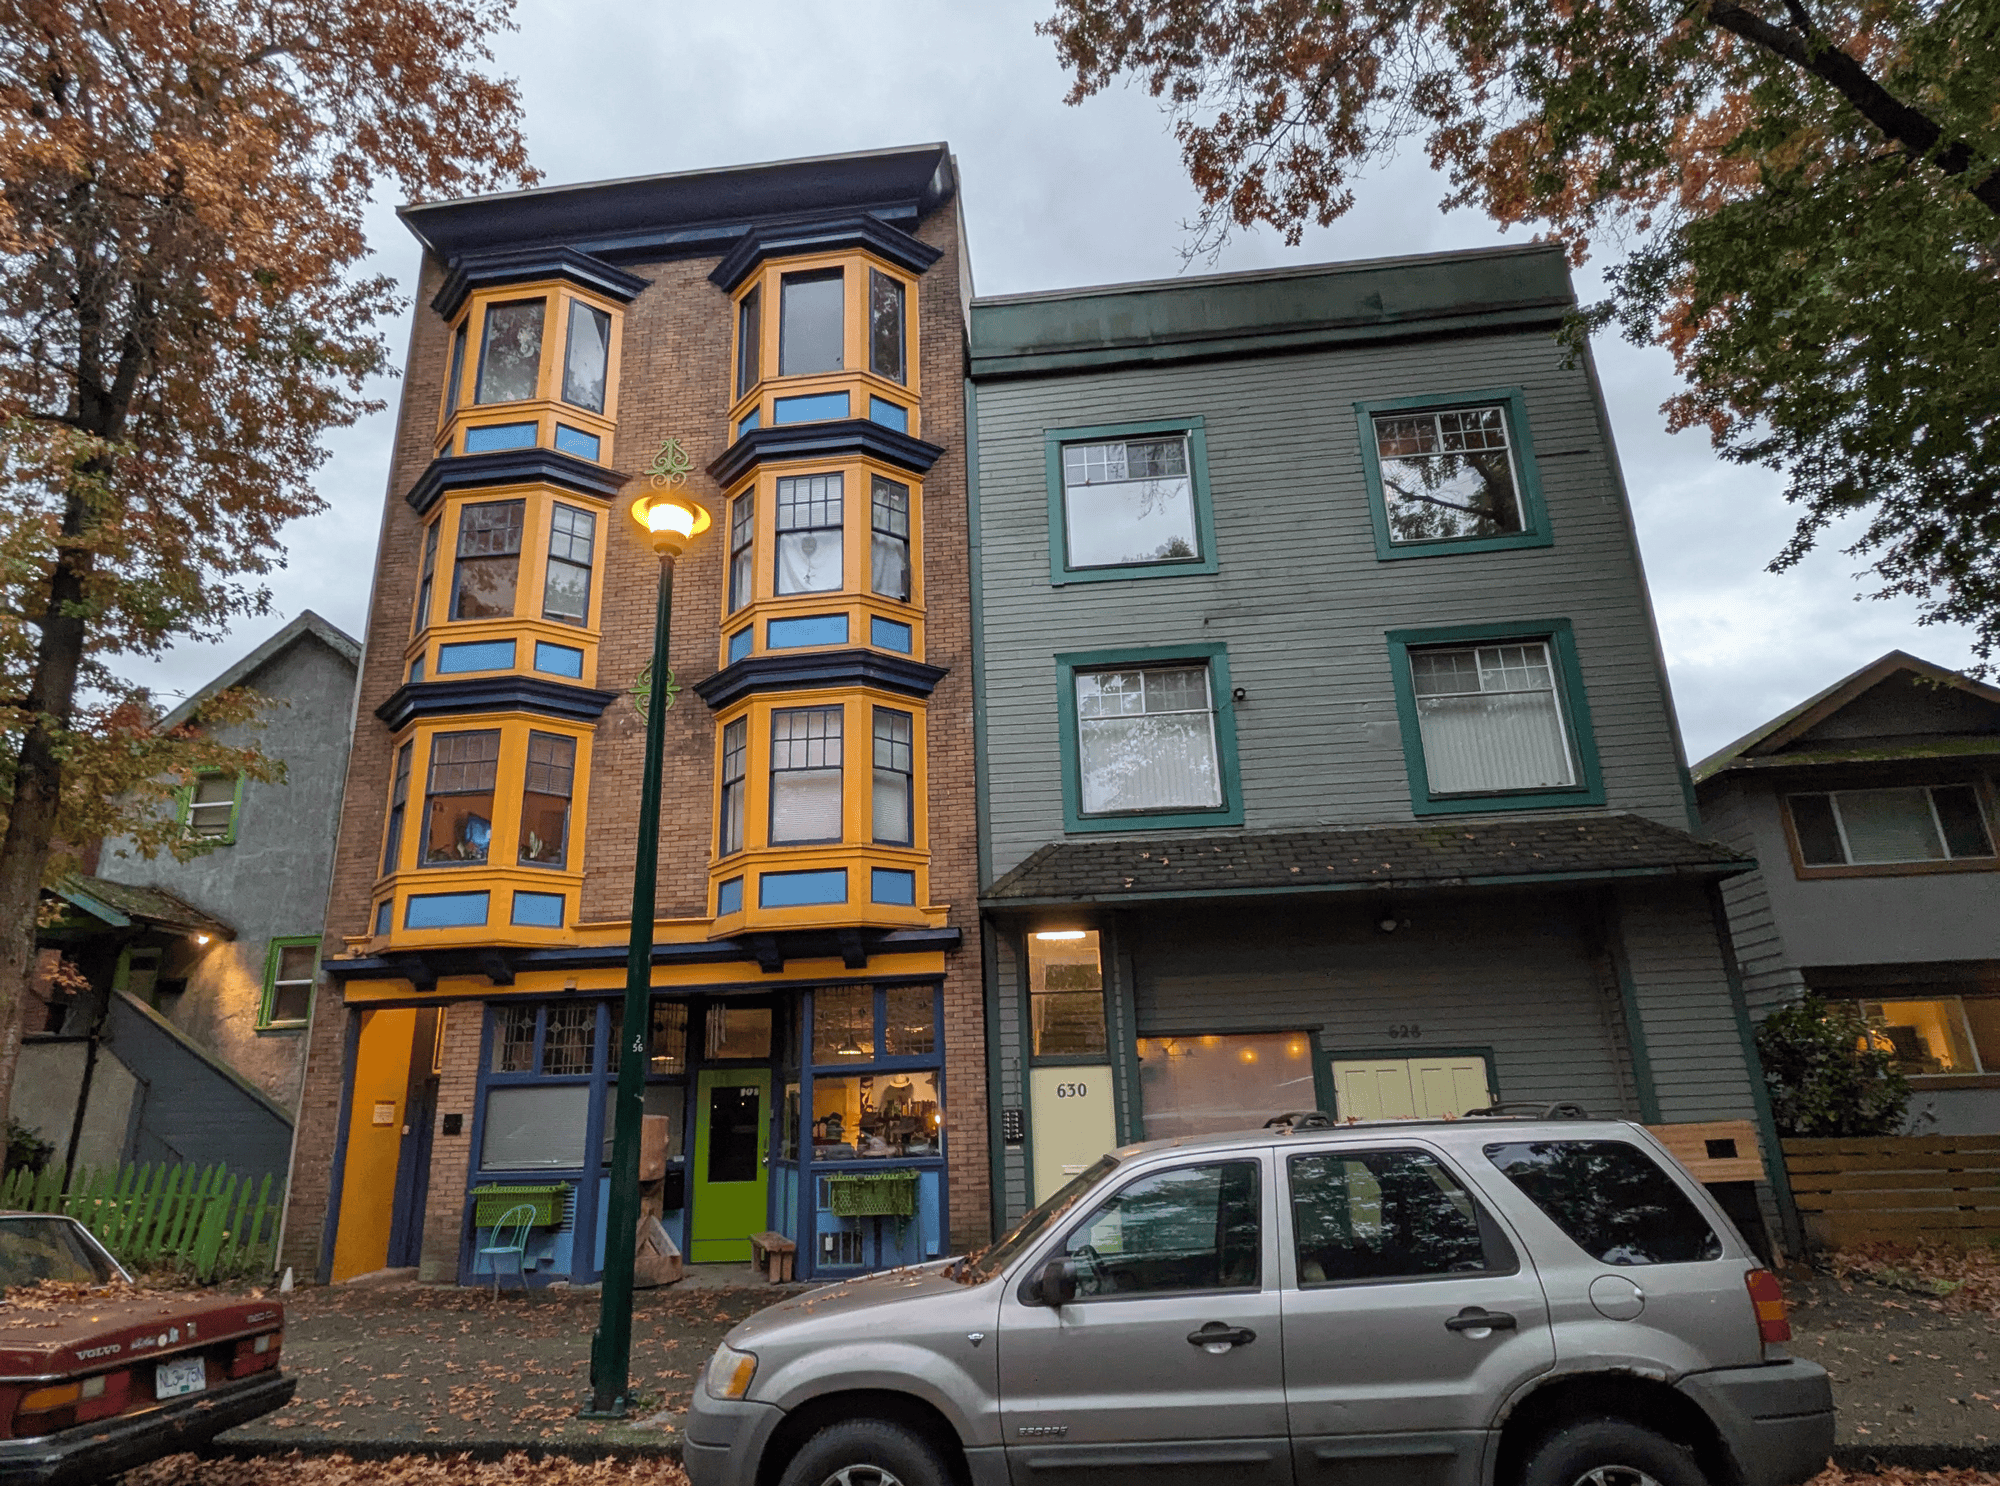
How re-legalizing small apartment buildings would spur the homes city dwellers need now.
How re-legalizing small apartment buildings would spur the homes city dwellers need now.
Takeaways Find audio versions of Sightline articles on any of your favorite podcast platforms, including Spotify, YouTube, and Apple. Editor’s note: Sightline Institute is co-publishing this article with the Canadian Centre for Policy Alternatives. View its version here. The costs of public infrastructure are becoming the go-to excuse for restrictive zoning policies in British Columbia. … Read more

Takeaways British Columbia has made great strides in recent years opening up more homes, in all shapes and sizes, to address its severe housing shortage and resulting unaffordability. Unfortunately, one step it hasn’t taken—that neighboring Washington and Oregon have—is lifting the caps on unrelated roommates who can live together, effectively mandating empty bedrooms in homes … Read more
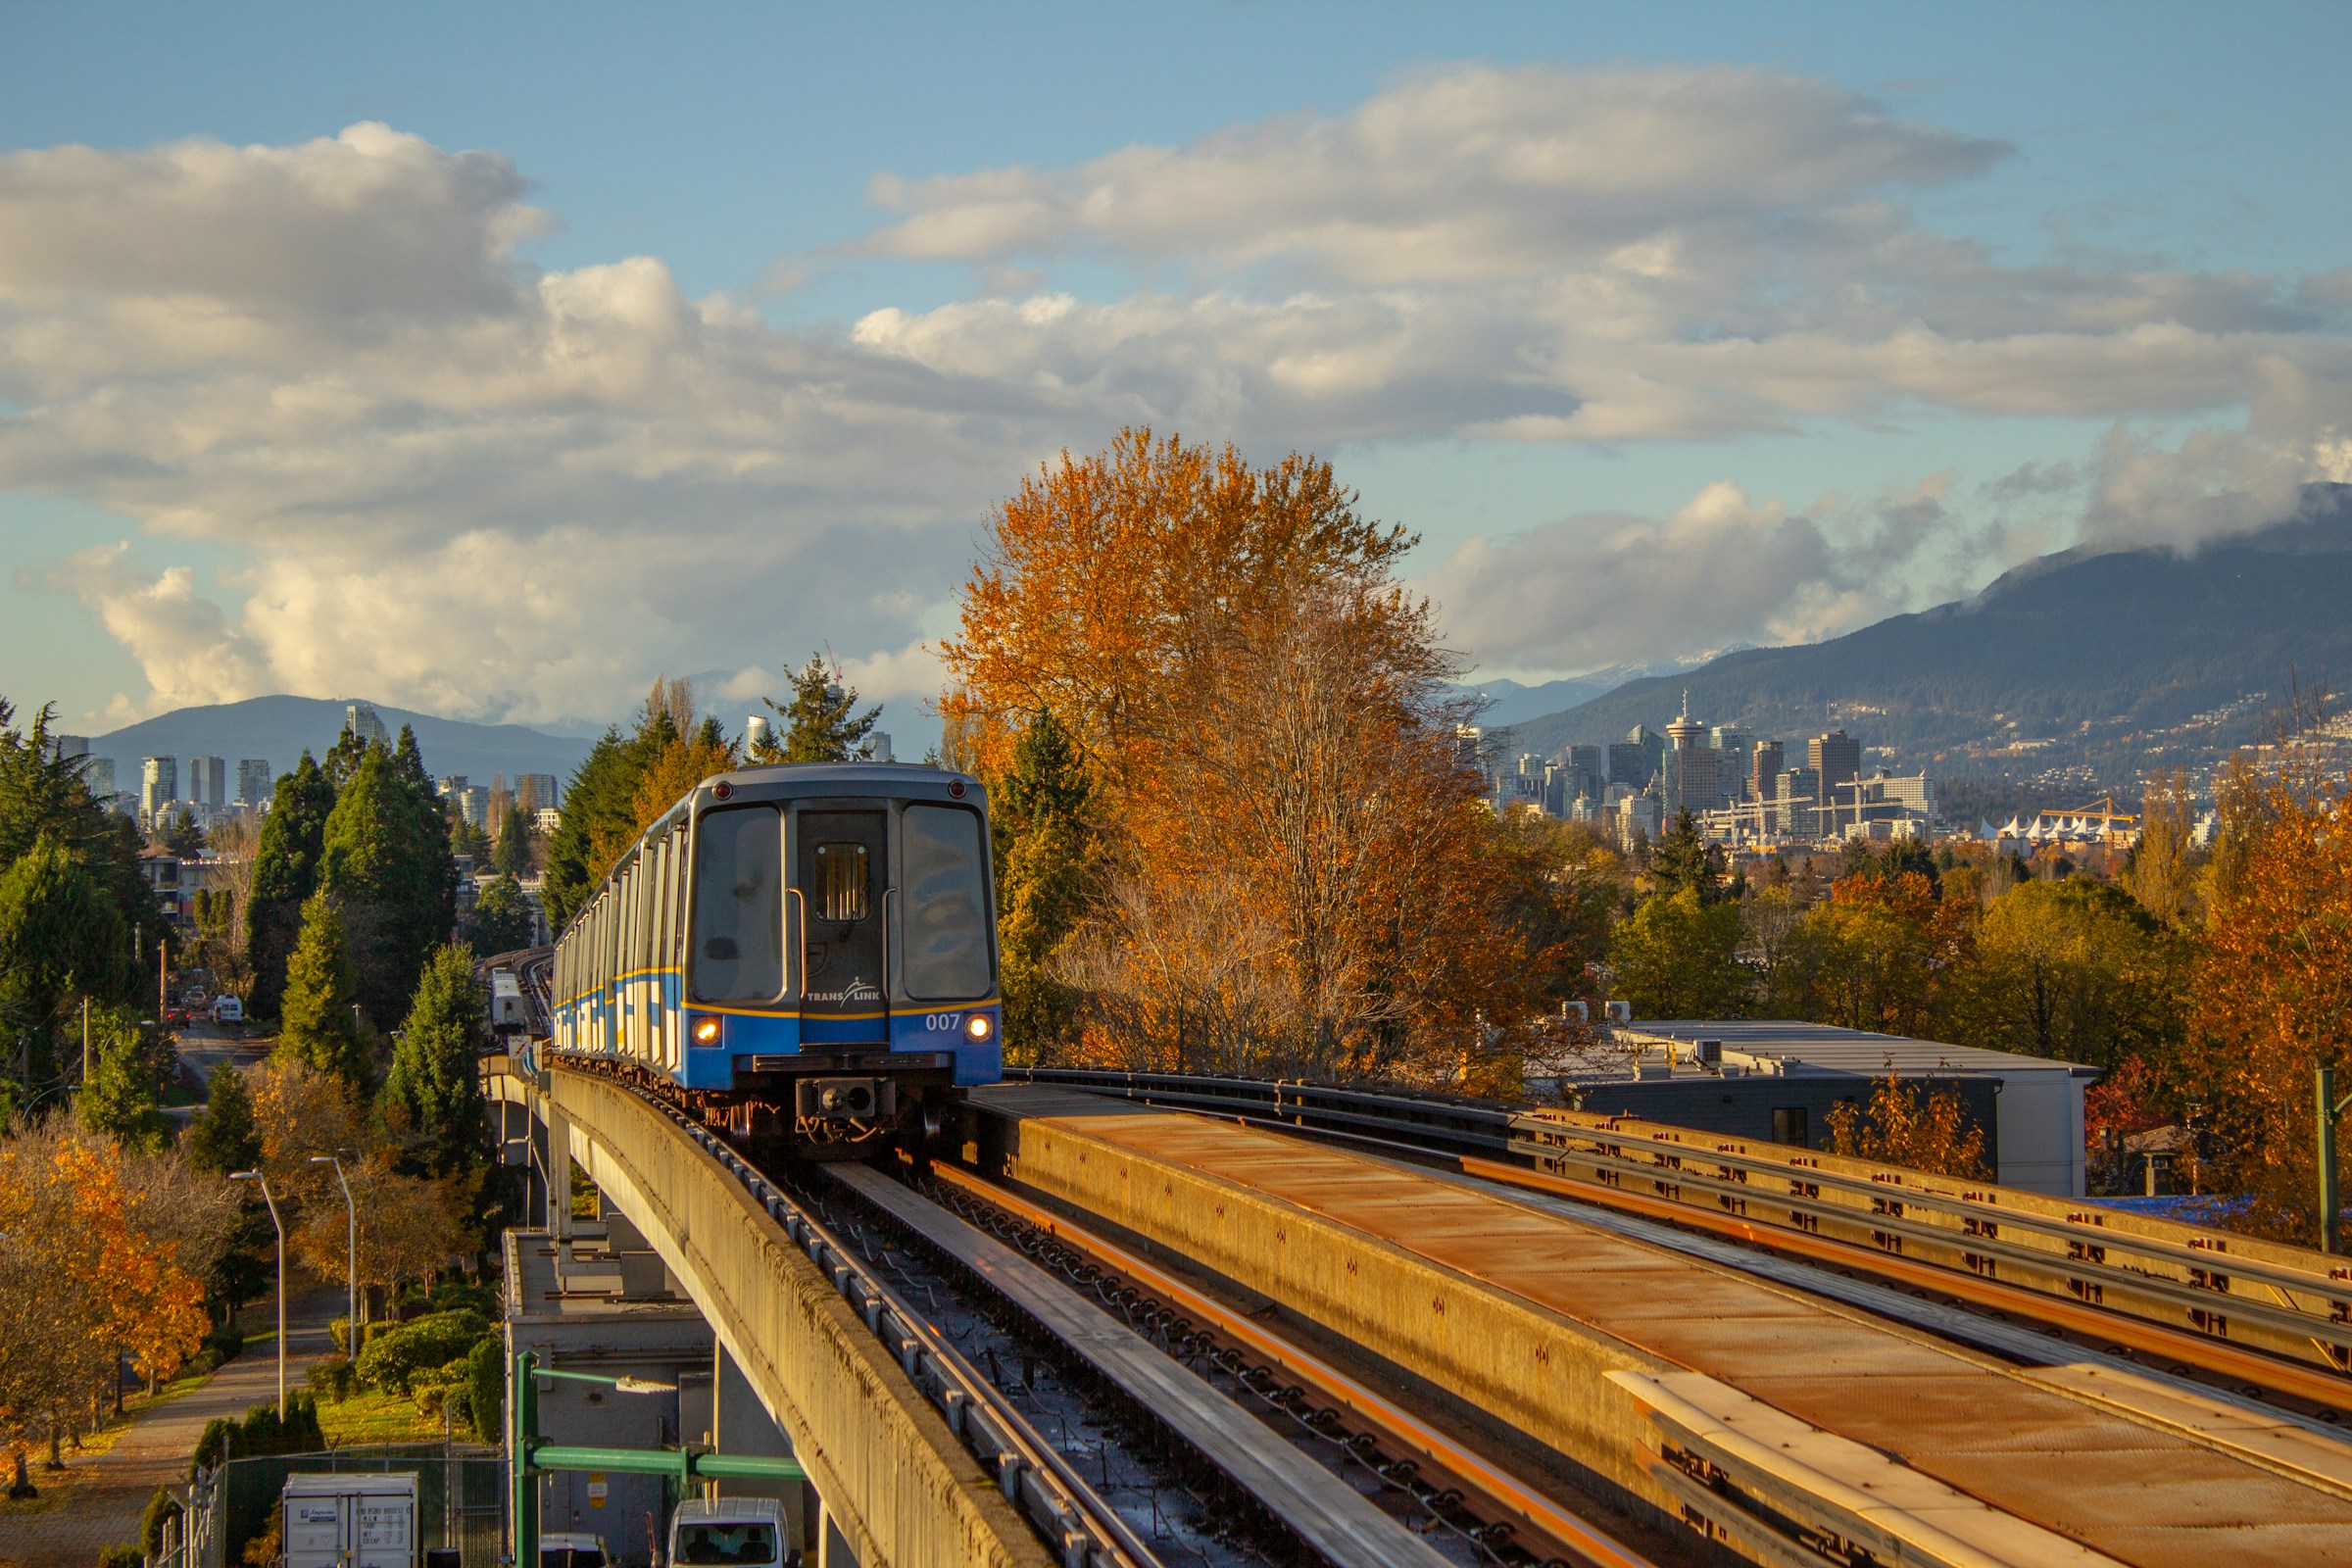
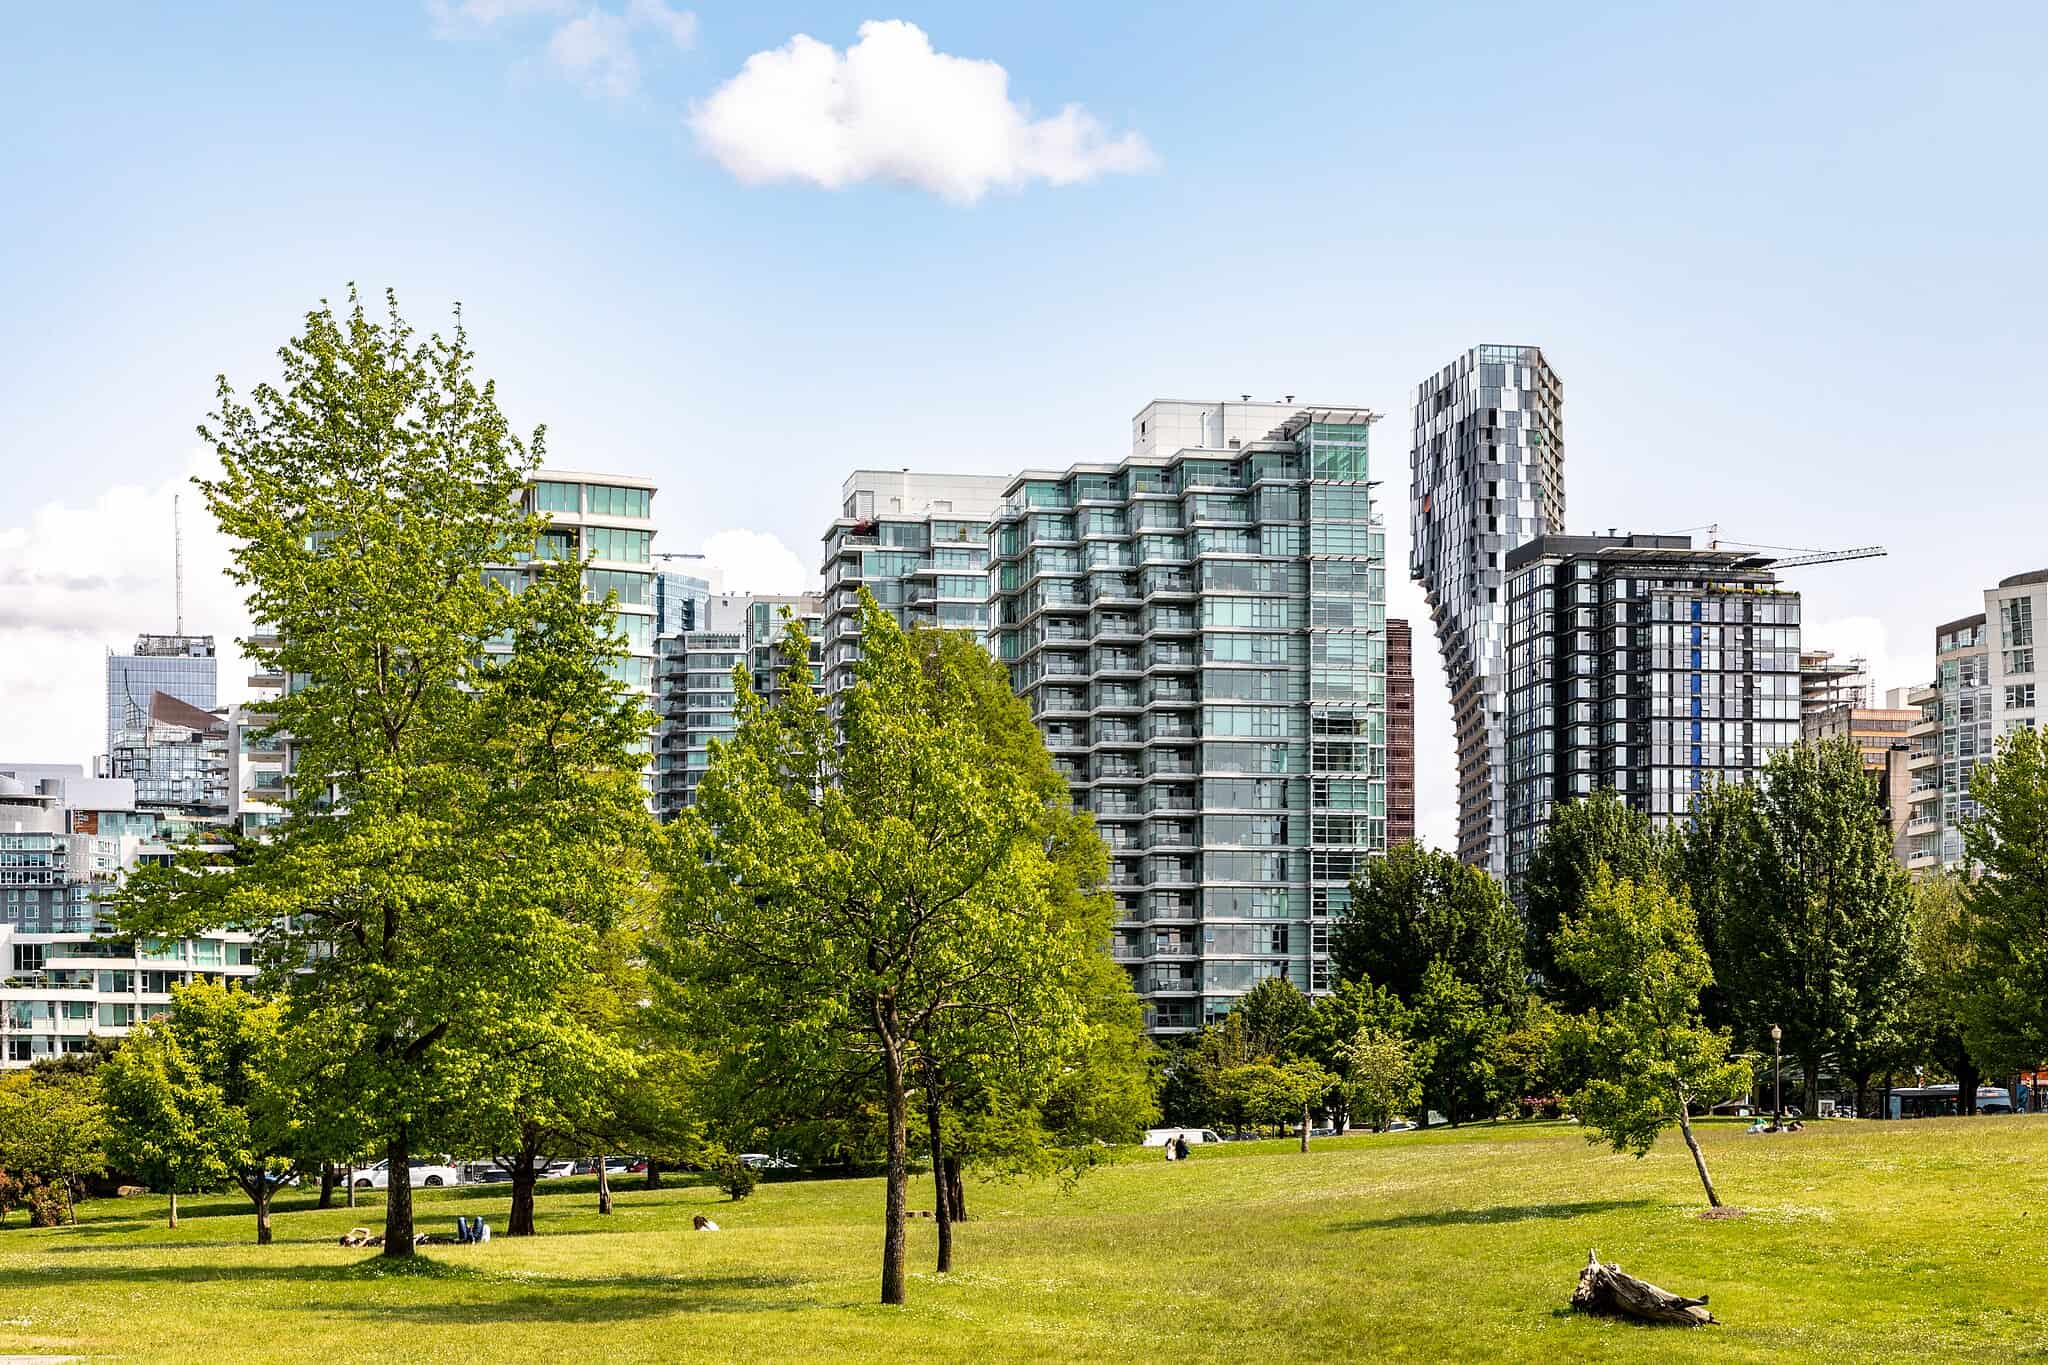
Takeaways For years, opponents of transit and infill housing in British Columbia mostly succeeded in blocking new homes and transit lines, driving up the province’s notoriously high home prices and rents. Slowly, though, small projects made it through that gauntlet, until late last year, leaders passed a raft of reforms to unlock more homes, in … Read more
Early efforts in California, Colorado, and New York offer lessons to get started.
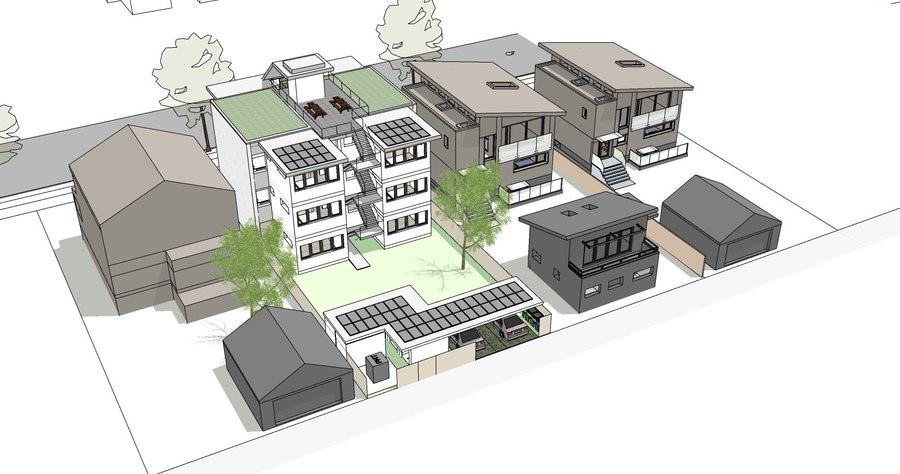
Find audio versions of Sightline articles on any of your favorite podcast platforms, including Spotify, Google, and Apple. As people across Cascadia buckle under soaring home prices and rents, leaders are scrambling to legalize, or try to legalize, more “middle housing” options amid their single-detached-dominated stock. While options like laneway homes and backyard cottages, duplexes … Read more
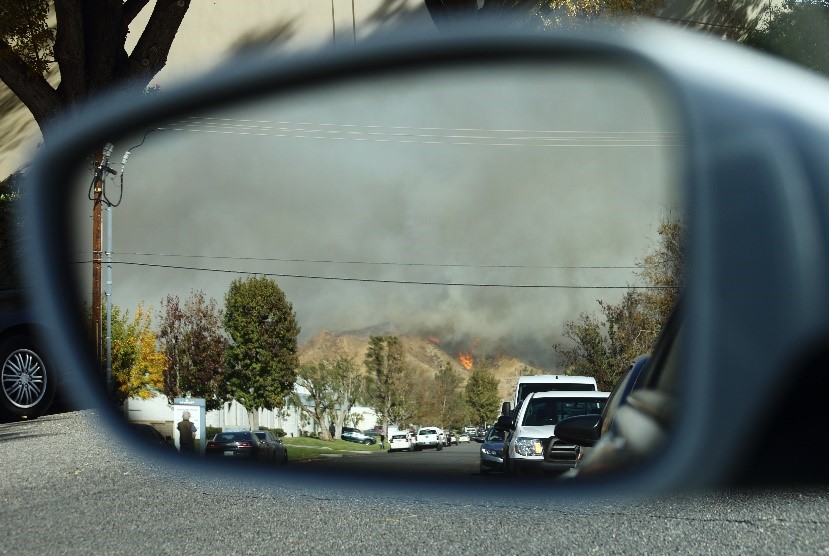
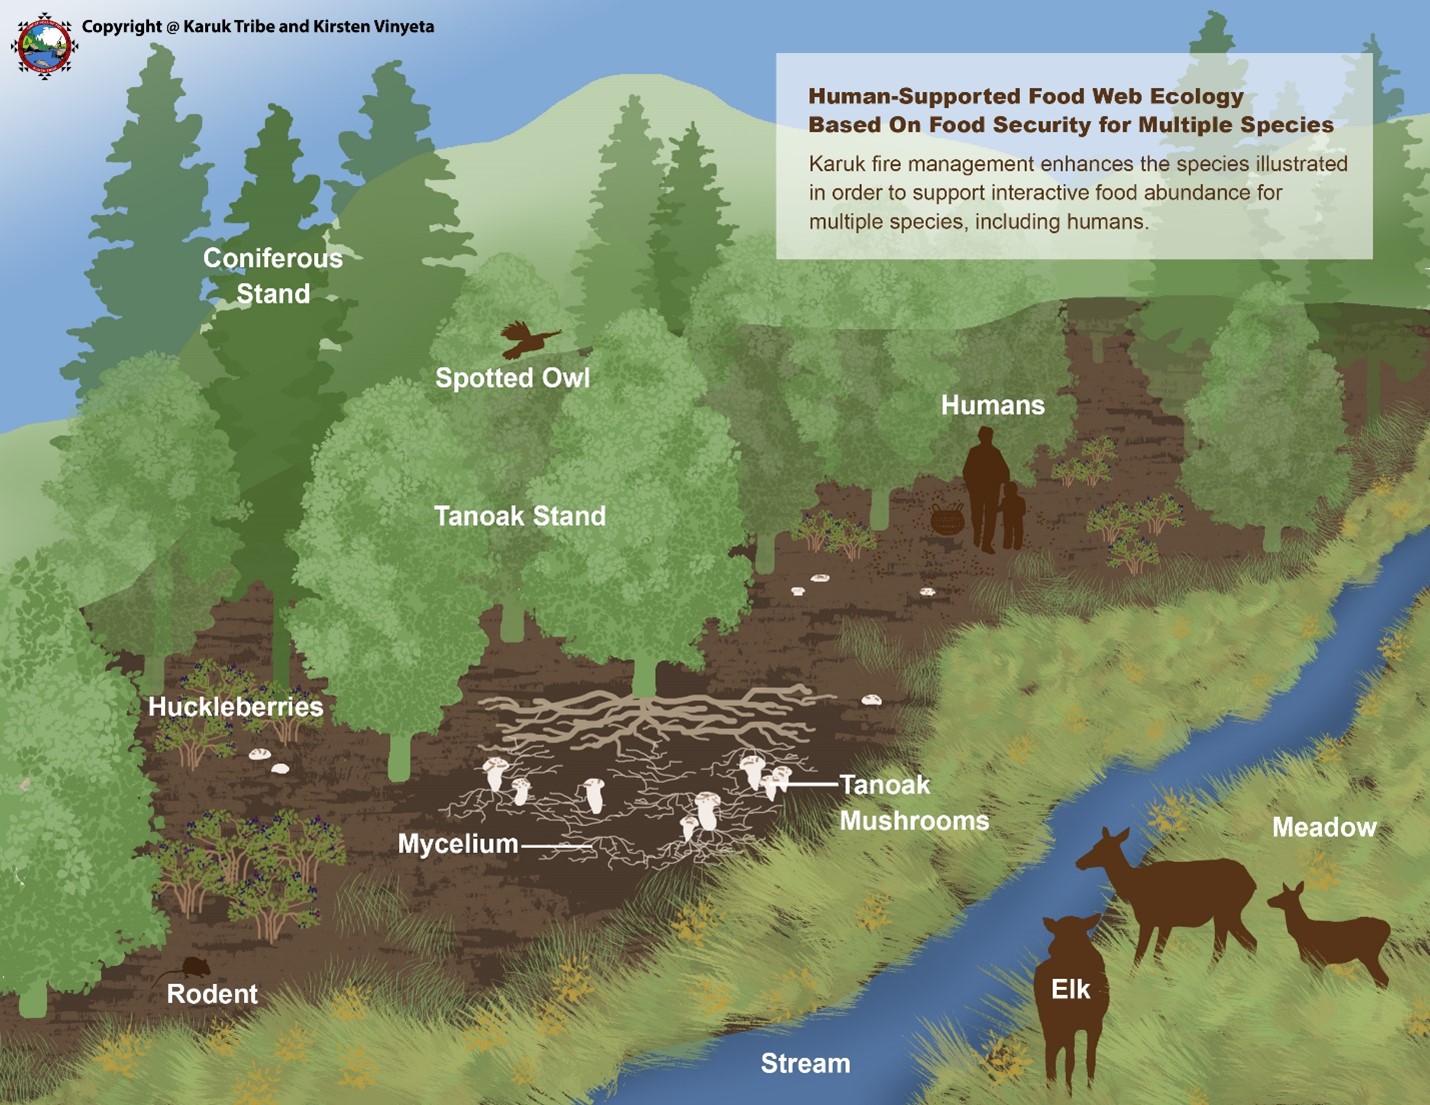
Three ways to curb the sprawl that traps us on a wildfire treadmill.