How the 2026 Washington Legislature Can Right-Size the Power Grid

A transmission authority, plus three other ideas, to speed development of the transmission lines Washingtonians needed yesterday.
A transmission authority, plus three other ideas, to speed development of the transmission lines Washingtonians needed yesterday.

Once the most innovative in the nation, the top-two model is showing cracks. Here’s how the Evergreen State can upgrade.
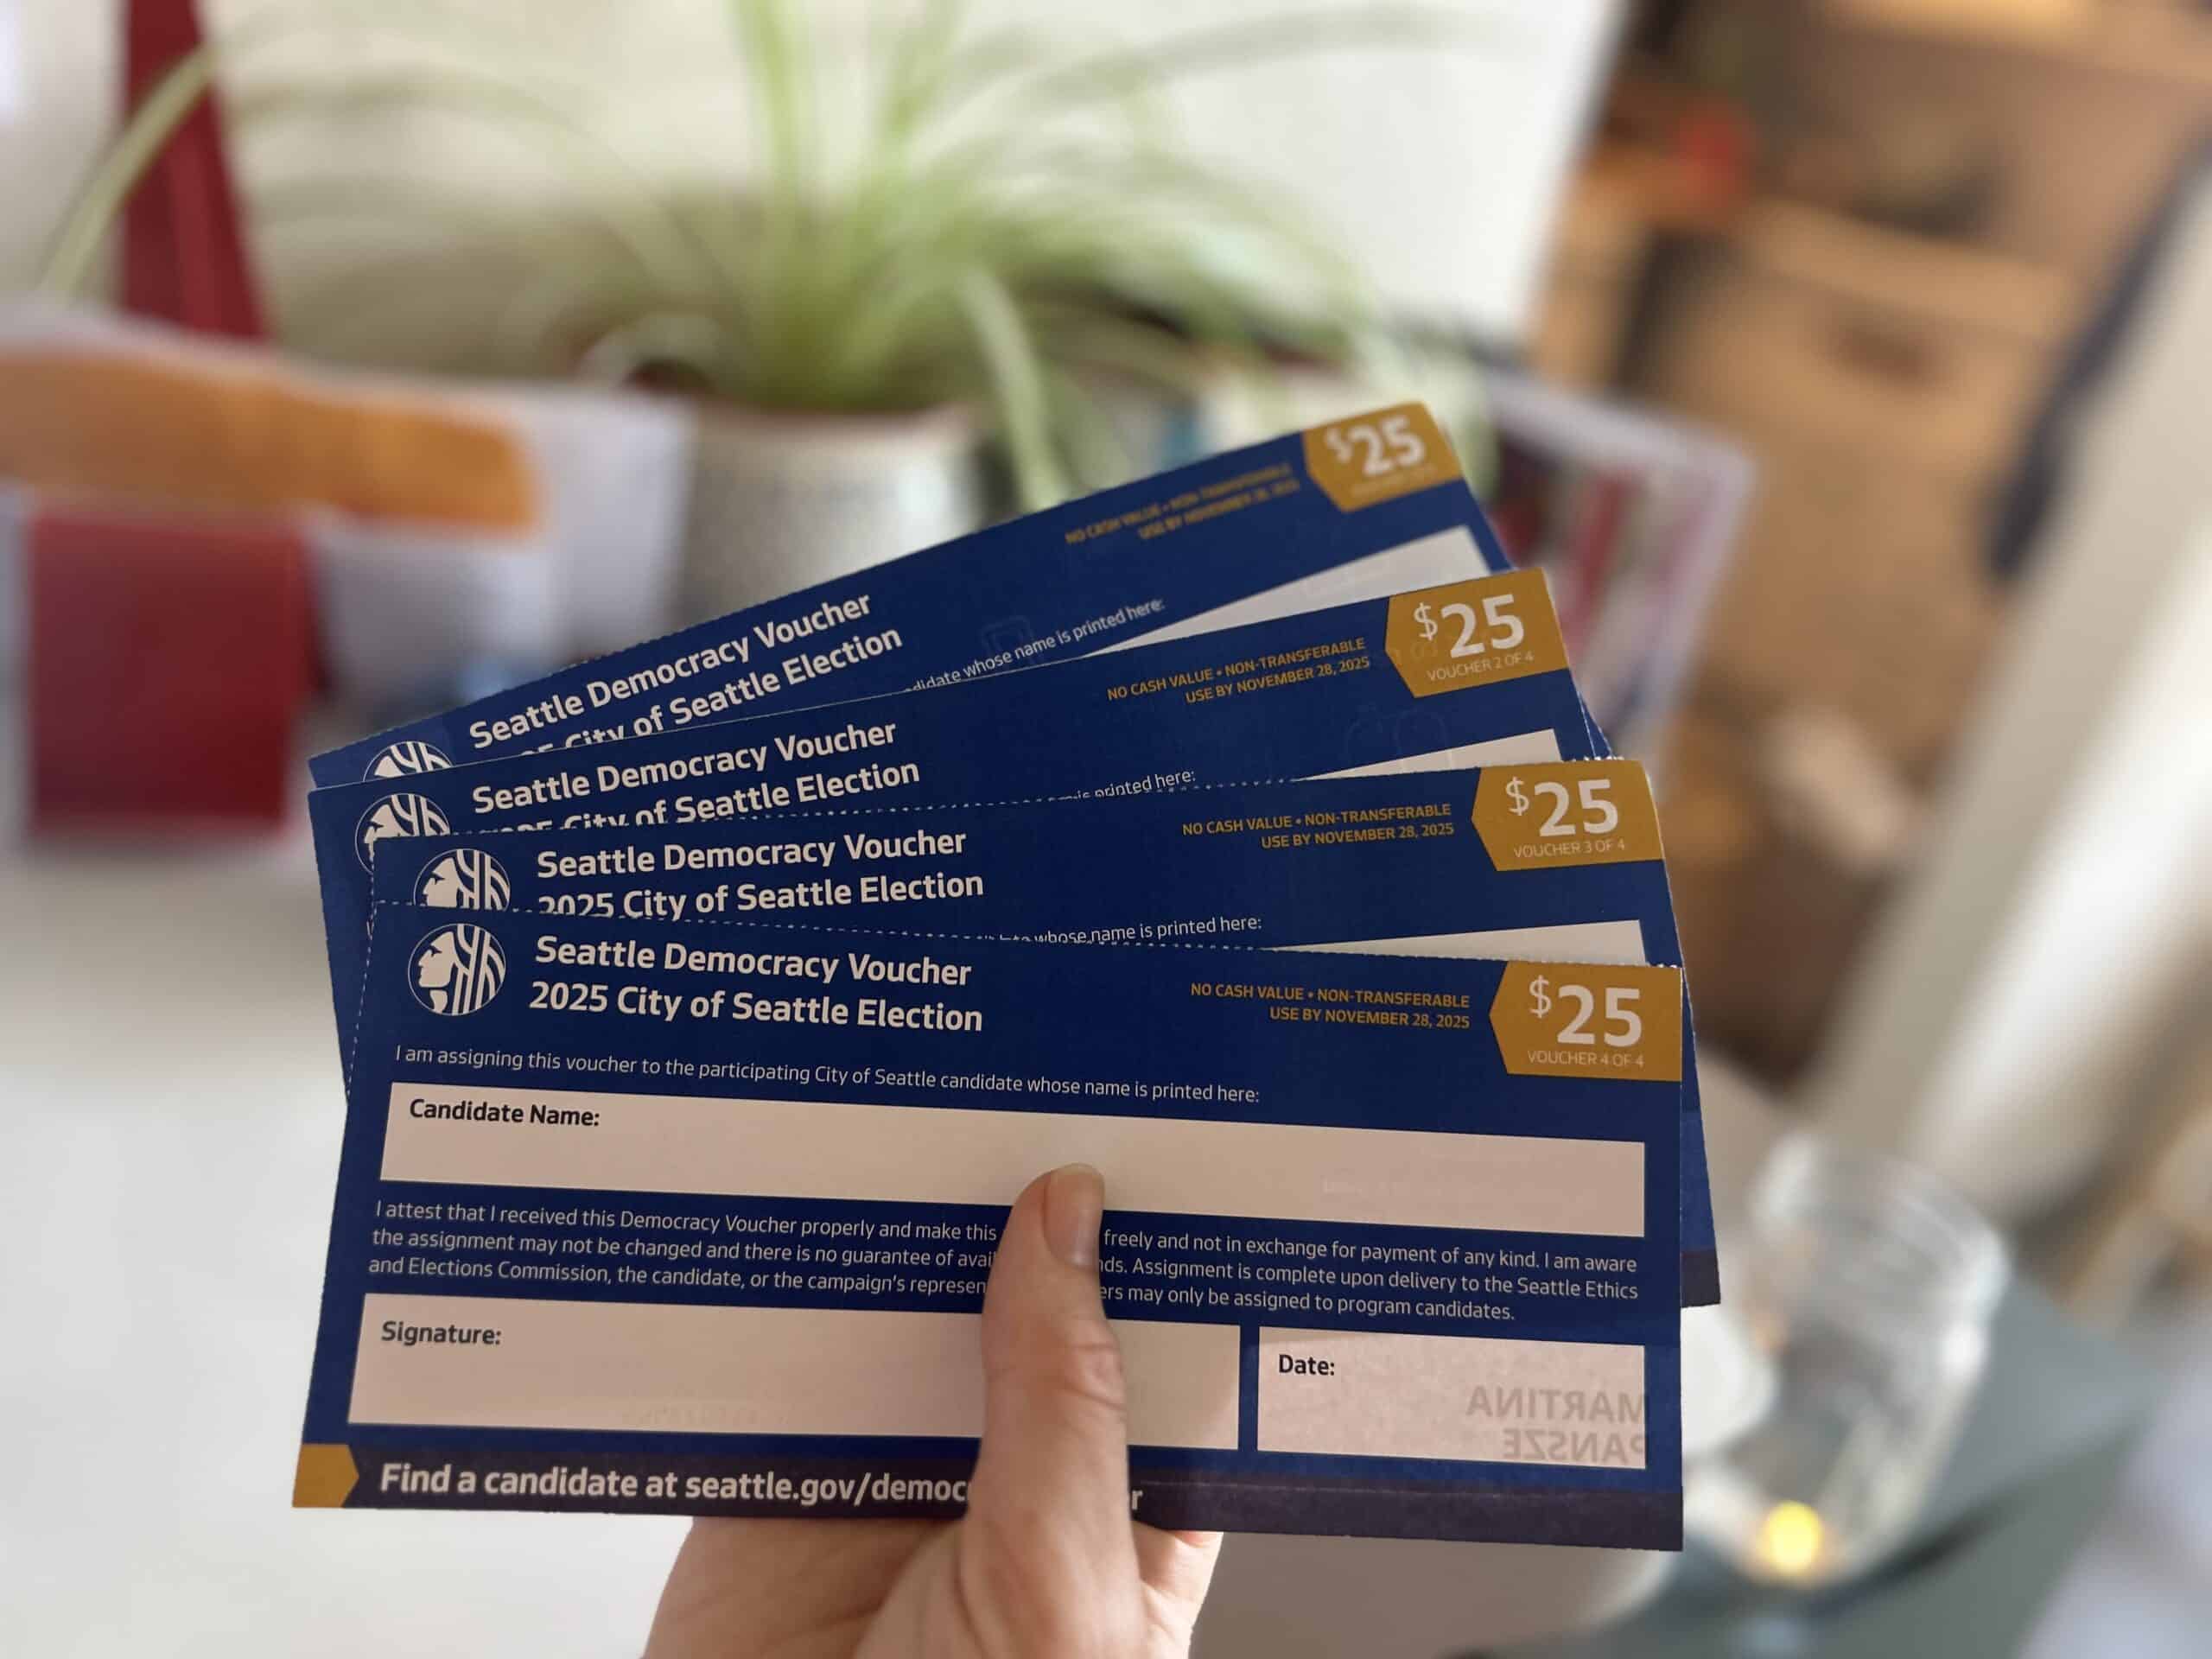
With candidates of all political stripes taking advantage of the city’s small-dollar campaign program, Seattleites themselves become the real winners.

August’s levy renewal offers Seattleites proven benefits to democracy for a low price.

Research finds independent spending is up in cities with and without public financing for local campaigns—and democracy vouchers are delivering on their people power promise.
The Northwest needs a better way to evaluate power line projects.
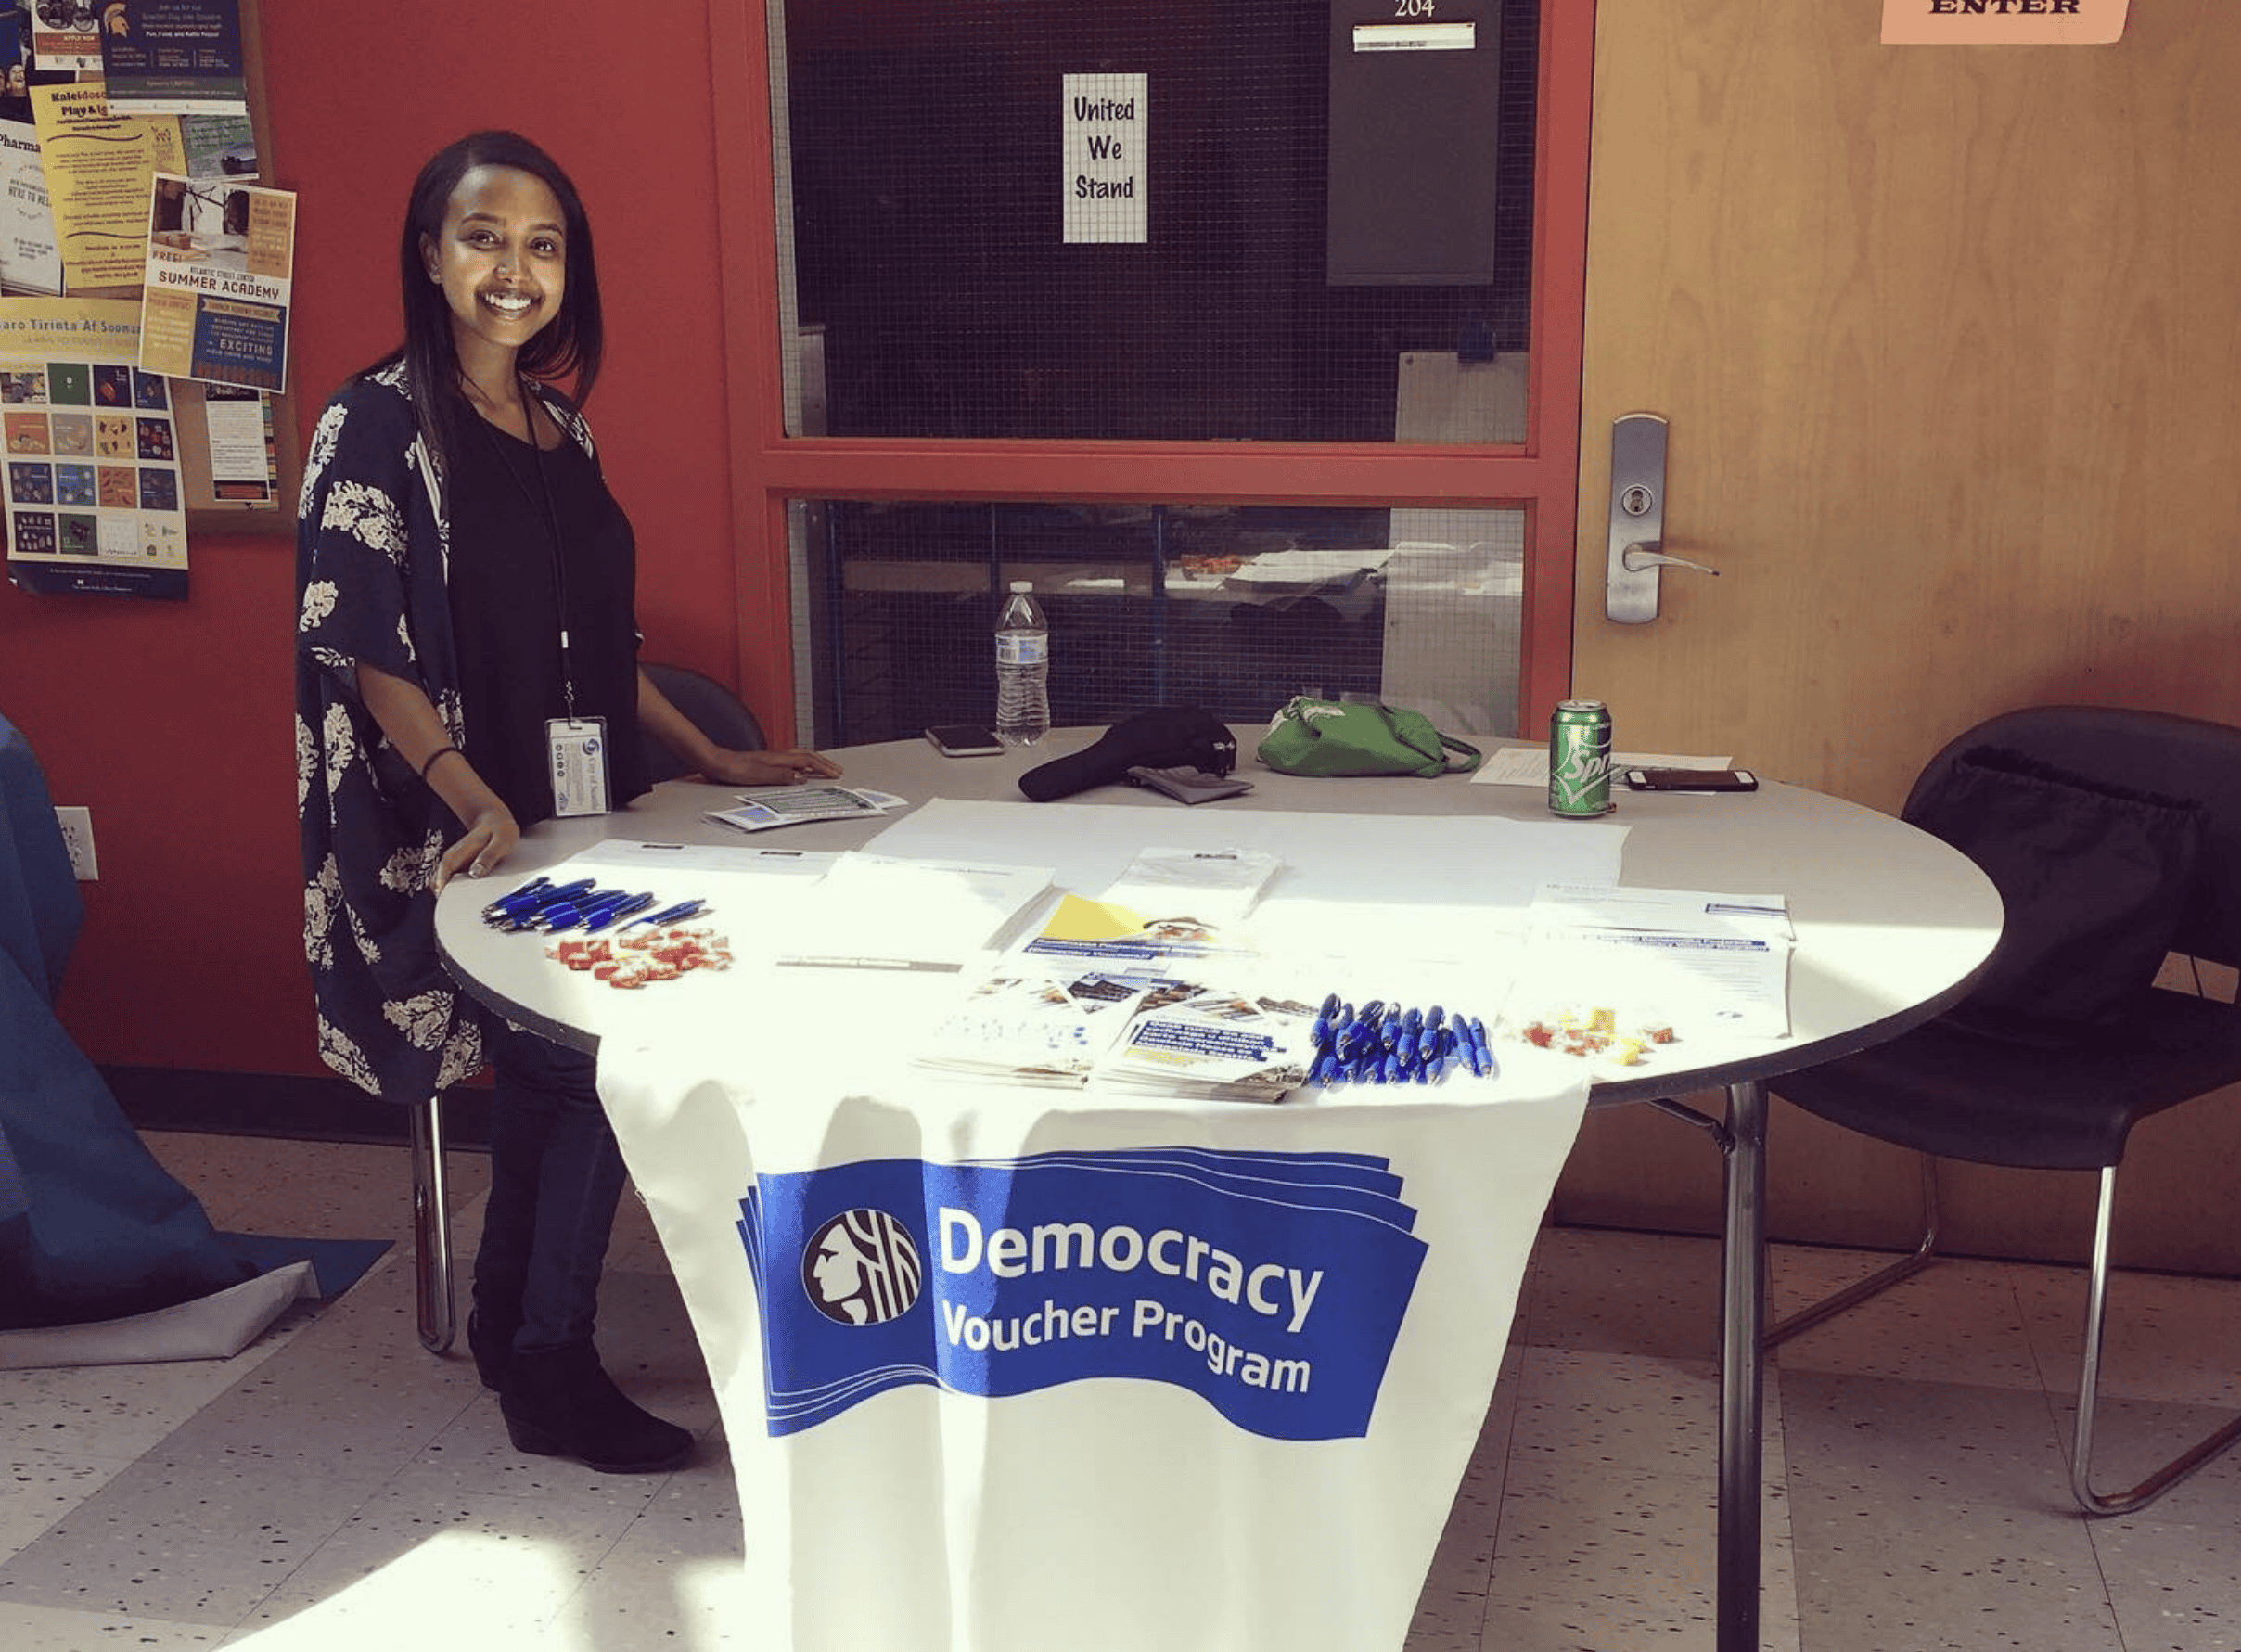
A decade in, and up for renewal in August, Seattle’s model campaign funding program has blasted past even its ambitious initial goals.
Contacts available for comment and background: OLYMPIA, WA – Washington lawmakers have passed a slate of bills to unblock new homes in cities and towns statewide and to lower home costs and rents for Washingtonians. They now head to the Governor’s desk for final approval. “These are big wins for the people of Washington,” said … Read more

MEDIA CONTACT: Catie Gould, Sightline Institute, catie@sightline.org OLYMPIA, WA – Washington’s Parking Reform and Modernization Act, SB 5184, was passed by the state House of Representatives on Friday, April 11 in a 64 – 31 bipartisan vote. It is one of the strongest parking reform packages attempted anywhere in the United States. Sightline Institute senior researcher Catie Gould, who … Read more
MEDIA CONTACT: Catie Gould, Sightline Institute, catie@sightline.org OLYMPIA, WA – Washington’s Parking Reform and Modernization Act, SB 5184, has a hearing in the House Committee on Local Government at 10:30 AM on Friday, March 14. The bill—introduced by Senator Jessica Bateman and approved by the state Senate in a 40-8 bipartisan vote on February 19—would … Read more