All of the kids returning to school this week brings to mind those classic school essays along the lines of “What I did this summer” and “What does democracy mean to me?” Should the kiddies be confronted with a new twist on the latter—“What will climate change mean to me?”—they’ll find help from a new tool released recently by The Nature Conservancy, the University of Washington, and the University of Southern Mississippi.
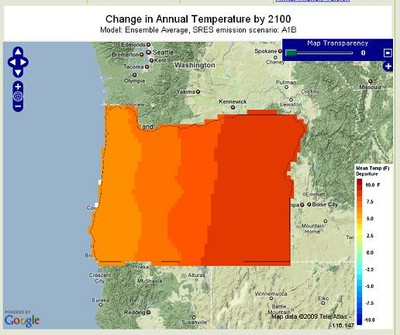

Climate Wizard provides predicted temperatures and rainfall worldwide for 2050 and 2100 based on best-, medium-, and worst-case scenarios of carbon dioxide emissions and global warming (the non-US data is only available for 2050 at present). You can zoom in for a closer look on regions and states you’re most interested in.
According to the analysis, in the US, Kansas, Nebraska, and Iowa really get hosed in the temp department, while even temperate Washington warms about 7 degrees by the end of the century if you take the most pessimistic data set. And California had better get used to droughts and fires—the Golden State gets pretty crispy with dramatic drops in summer precipitation in some places, while other spots could be hit with deluges.
The dire projections provide all the more reason for concerned citizens to get involved in the discussion about US climate change legislation. Senate leaders pushed back until later this month the release of proposed legislation to complement the Waxman-Markey bill that passed the House in June. Grist has a great round up of climate-related action, both for and against the legislation (if you’re feeling a little apathetic, news on the anti-campaigns could get you fired up).