Remember way back in 2008, when the economy hit the skids just as gas prices hit the roof? I sure do. Among other big stories from the summer: traffic volumes started declining, fast. For the US, it was the steepest year-over-year reversal of vehicle travel ever recorded.
But once the economic slide bottomed out and gas prices came back to earth, vehicle travel started inching up again. According to Federal numbers, total vehicle miles traveled in the Northwest states is almost back to where it was in 2007.
 But this bust-and-boom cycle has obscured what may be a more significant long-term trend: measured per capita, northwesterners’ appetite for vehicle travel has fallen, modestly but unmistakably, over the last decade.
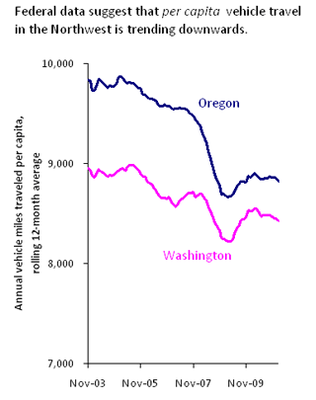
The chart to the right tells the story. The steepest declines in personal vehicle travel did take place in 2008, when gas prices were spiking. And vehicle travel ticked back up a bit when gas prices fell. But there’s a clear downward trend to the numbers: even before gas prices shot upwards, even when the economy was humming along nicely in the middle of the decade, residents of the northwest were slowly reducing how much they drove.
The thing is, though, that the trends have been pretty slow. The chart to the right is scaled to accentuate month-to-month change; but the numbers show that, from the 2004 peak to the last month for which data are available, vehicle travel per person declined by about 7 percent.
Just a percent or two per year: that kind of slow, steady change is probably too gradual to notice in your daily life. My family’s vehicle travel has probably fluctuated much more widely than that. So this is the sort of trend that you can only tell by sifting through data—there’s no way you can rely on your recollections about your own driving to know whether it’s real. But unless state and federal numbers are mistaken, the underlying trends are very real: measured per person, we’re logging fewer miles on the road.
