
Here’s data from the latest coal report from the US Energy Information Administration, taking us up through the end of 2011:
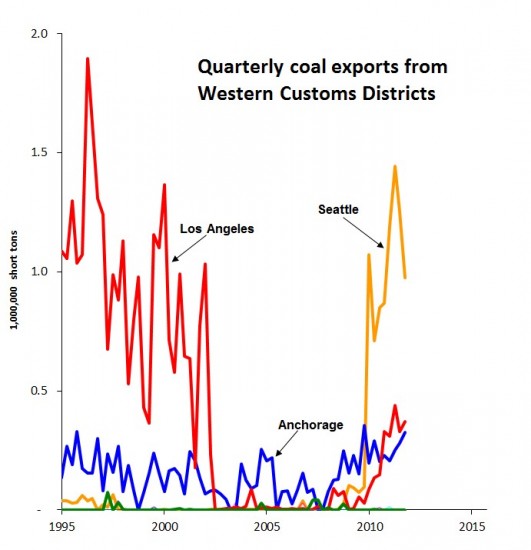
Driven by falling volumes leaving the Seattle Customs District, overall coal exports for the West declined during each of the last two quarters of 2011. The Seattle District shipped a bit less than 4.9 million short tons in 2011. Fourth quarter exports totaled less than 1 million, down 22 percent from the previous quarter. Coal shipments from the Los Angeles and Anchorage Customs Districts were up slightly in the fourth quarter.
Coal exports out of the Great Falls (Montana) Customs District remain at near-zero figures, which strongly suggests that coal shippers are not using spare capacity at the Ridley Terminals at Prince Rupert, BC. (It’s theoretically possible that some Ridley-bound coal is moving instead via the Blaine crossing in the Seattle District, but it would be a tortuous and congested route. More likely, Ridley is proving too far away to be economically viable.)
Nationally, coal export trends were bifurcated.
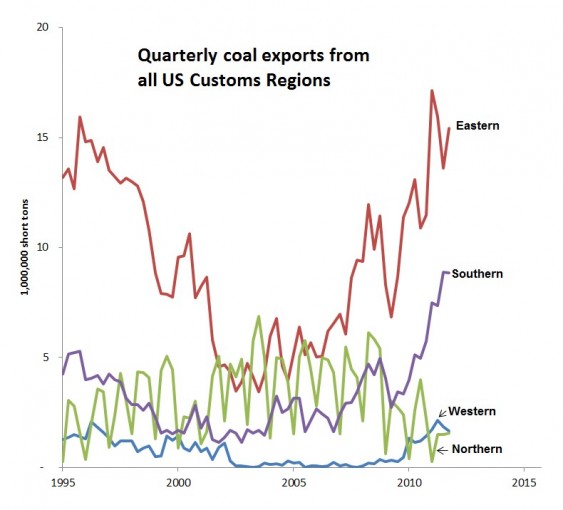
Exports from the Eastern and Southern Customs Regions were trending up strongly during much of 2010 and 2011. In the Western and Northern Regions, however, coal exports have been more-or-less flat, in aggregate.
It’s useful to compare the trends shown in the chart to the coal export plans talked about for the Northwest. If those projects were built and operating at capacity, the Western Region could be shipping a whopping 35 million tons of coal per quarter—all of it out of the Seattle and Portland Customs Districts—more than doubling even the prodigious exports from the Eastern Region.
The EIA is promising new quarterly data in June, and I’ll report on it here when it’s available.
Thanks to Pam MacRae for research assistance.
All of my reporting on quarterly coal export volumes can be found in the series “Coal Export Trend Reports.” All data come from the US EIA’s latest quarterly coal report, covering the entire Western Customs Region. In addition to the districts shown on the chart here, the Western Region includes the Portland, Great Falls, Nogales, San Diego, and San Francisco Districts. These districts have been reporting virtually no coal exports.
Nota bene – The first chart shows Customs Districts here, not ports. The Port of Seattle does not move coal. But some coal does get exported out of the Seattle Customs District region by way of the rail crossing at Blaine, Washington. It is Powder River Basin coal heading to BC’s Westshore Terminal for onward shipment to Asia.
