Here’s data from the latest coal report from the US Energy Information Administration, taking us up through the second quarter of 2012:
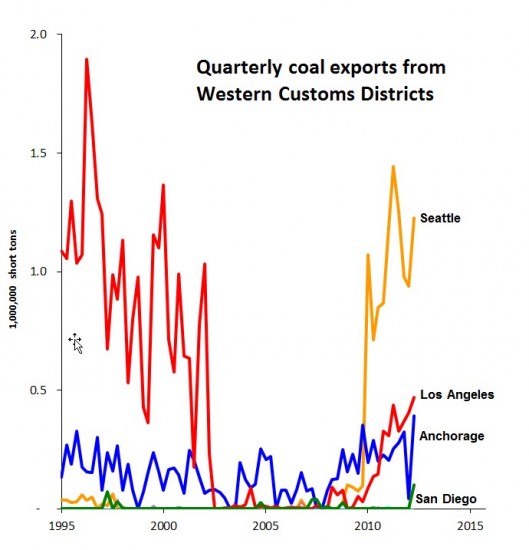
[Update 12/28/12: The green line labelled is in error on this chart. The San Diego Customs District exported virtually no coal products in Q2 2012.]
In the Western Customs Region, depicted above, three Districts reported meaningful quantities of coal exports. Here’s the interesting stuff.
The Seattle District figures represent coal that is shipped north from Washington into British Columbia for onward shipment to Asia. The district shipped a little more than 1.2 million short tons of coal in the second quarter of 2012, which constituted a rebound after three consecutive quarters of decline. Still, shipments were off from the high-water mark of more than 1.4 million tons in the second quarter of 2011.
Cloud Peak Energy, which moves coal from Montana to BC’s Westshore Terminal just north of the border, appears to claim credit for nearly all of the coal shipped through Seattle — “approximately 1 million tons,” in its second quarter investor report — but it’s not clear who owns the remainder of the coal.
The Los Angeles District‘s coal shipments registered less than a half million tons, but quarterly exports notched up by about 16 percent, continuing a long term climb.
The Anchorage District reported a sharp bounce-back to nearly 400,000 tons of coal exports following an anemic first quarter.
The Great Falls District continues to report near-zero figures for coal exports. The numbers for Great Falls are of interest because the logical route from Powder River Basin coal mines to BC’s Ridley Terminals at Prince Rupert would take coal across the border at the Sweetgrass, Montana crossing in that district. So low export tallies suggest that US coal shippers are not able to use the Ridley Terminals at Prince Rupert to any meaningful degree. (It is conceivable that some of the coal bound for Prince Rupert is crossing the border at Blaine, Washington in the Seattle Customs District but this would entail a tortuous and congested rail route.)
Nationally, coal export trends were consistent across regions.
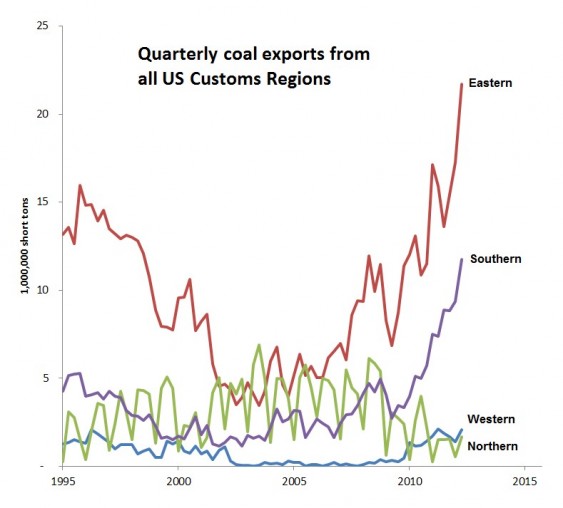
Western and Northern Region coal shipments increased, but both are at present bit players compared to the Eastern and Southern Customs Regions where coal exports continued surging during the second quarter of 2012. Total US coal exports were up an astonishing 31 percent, putting the country on track to set an all-time coal export record in 2012.
It’s useful, however, to compare recent trends to the coal export plans for the Northwest. If those projects were built and operating at capacity, the Western Region could be shipping 36 million tons of coal per quarter, more than all the coal exported currently from the Eastern and Southern Regions combined.
The EIA is promising new quarterly data in December, and I’ll report on it here when it’s available.
Thanks to Pam MacRae for research assistance.
All of my reporting on quarterly coal export volumes can be found in the series “Coal Export Trend Reports.” All data come from the US EIA’s latest quarterly coal report, covering the entire Western Customs Region. In addition to the districts shown on the chart here, the Western Region includes the Portland, Nogales, San Diego, and San Francisco Districts. These districts have been reporting virtually no coal exports.
Please note: The first chart shows Customs Districts, not individual ports. The Port of Seattle does not move coal, for example.
