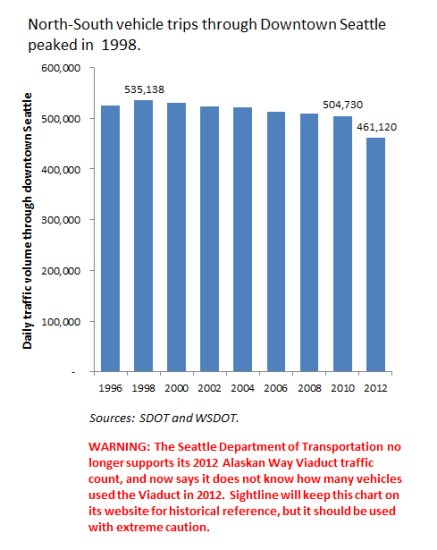
UPDATE: The Seattle Department of Transportation (SDOT) has now backed away from its previously published traffic counts for the Alaskan Way Viaduct!! The agency now says that it has no idea how many vehicles used the Viaduct in 2012. See our update on Viaduct traffic data—and be advised that this post, and particularly the chart below, are based in part on data that SDOT no longer supports.
Last week, I wrote about the surprising (and largely unheralded) decline in vehicle traffic on Seattle’s Alaskan Way Viaduct in 2012. That’s when the state demolished the south end of the structure, shunting vehicles through a set of hairpin turns that can back up traffic, particularly during rush hour. Because of the delays, many drivers now avoid the route. Yet surprisingly little of the traffic that “disappeared” from the Viaduct moved to parallel routes. City streets near the Viaduct saw a slight uptick in traffic. So did I-5. But on the whole, traffic through downtown declined by a whopping 8 percent after Viaduct construction began—meaning that between 2010 and 2012, about 1 trip out of 12 vanished. But perhaps just as surprisingly, the declines of 2012 merely accelerated a longstanding trend. According to data from the Washington and Seattle departments of transportation, traffic through downtown Seattle actually peaked all the way back in 1998 and has declined steadily since then.
 Just to be clear, traffic volumes don’t necessarily correspond to congestion, or to the frustration people experience in heavy traffic. A lot of folks still slog through rush hour traffic in Seattle; many have little choice. And lots of Viaduct commuters are no doubt annoyed by rush hour delays. (A number of them commented on my last post!) But when weighing the relative importance of the Viaduct, it’s worth keeping the numbers in perspective. A highway lane can carry at most 2,000 cars per hour. With the tight curves at both the north and south ends slowing down traffic, the Viaduct may now carry no more than 1,500 cars, and possibly fewer. With 4 lanes of traffic through the curves, this suggests that the Viaduct may now carry no more than 6,000 peak-hour round trips. Those are important trips, to be sure. Some of them are very important, and many of them will be difficult to service with transit. Still, it seems a particularly relevant number to keep in mind when evaluating a project that’s costing the state $4.2 billion.

“Auto traffic” in the headline, maybe?
Maybe you should lay a Sound Transit ridership chart alongside the one above. It would show double-digit annual ridership gains along roughly the same timeline, based primarily on adding mass transit capcaity in the same norht-south corridor. Coincidence?
An important consideration – an investment in transit indirectly helps those trips that cannot be replaced by it by removing the trips that *can* be replaced from the roads they use. That’s why people who can’t see any way to use the bus or train for their job should be glad we’re investing in transit.
Speaking of investing in transit, we definitely have to do something to help those poor West Seattle people out. They have gotten one of the shorter ends of the stick in this tunnel project. Hopefully they won’t make the mistake of continuing to champion it, thinking that its completion will solve their problems.
Can you comment on how many trips are projected in the lifetime of the new $4.2B viaduct and thus how much we will be subsidizing each trip? How does that compare to the full cost of a trip on the bus?
As we gear up to decide whether we want to pay extra sales tax and car tab fees to keep Metro as current levels, it would be nice to see the cost effectiveness of the Metro proposal versus what we committed to with the viaduct. Obviously some viaduct trips cannot be replaced by a bus trip (freight, delivery vans, etc.), but the comparison is relevant for an overall vision of what makes a cost- efficient transporation system.