In the previous article in this series about Washington’s Citizens’ Initiative 1464, we mapped in-district giving to winning Washington state legislative candidates. But mapping Washington’s legislative districts geographically creates a misleading visual distortion of the data. Despite the fact that each legislative district contains nearly the same number of people, sparsely populated rural districts are geographically much larger than densely populated urban districts. As a result, rural districts loom large, while urban districts nearly disappear from view on the map.
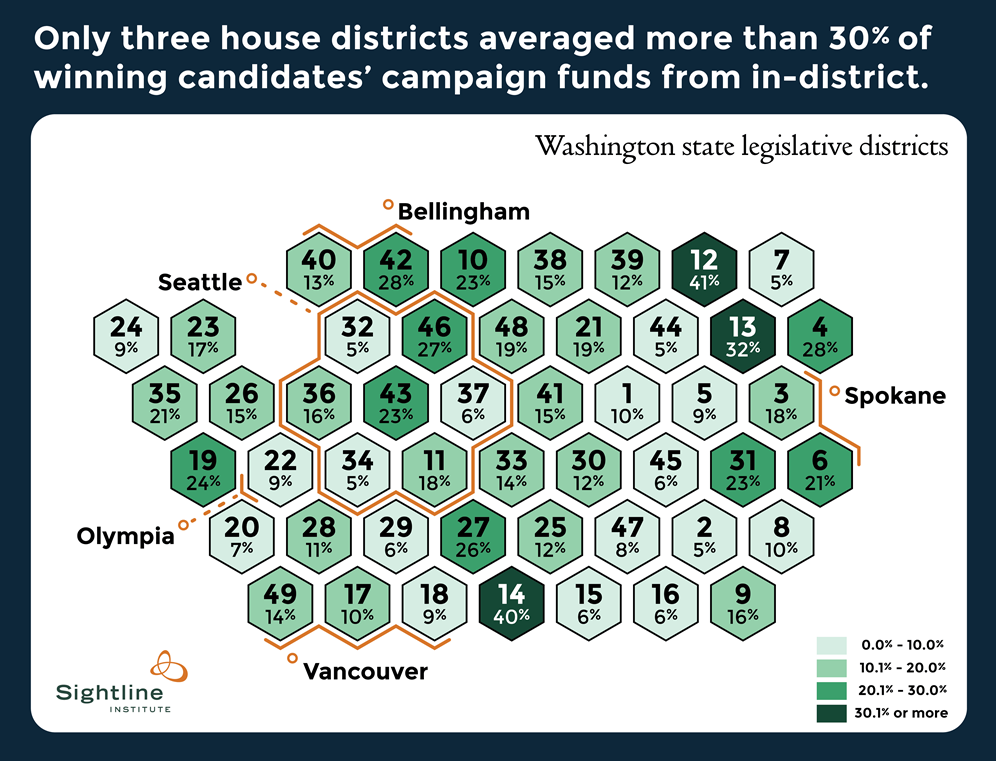
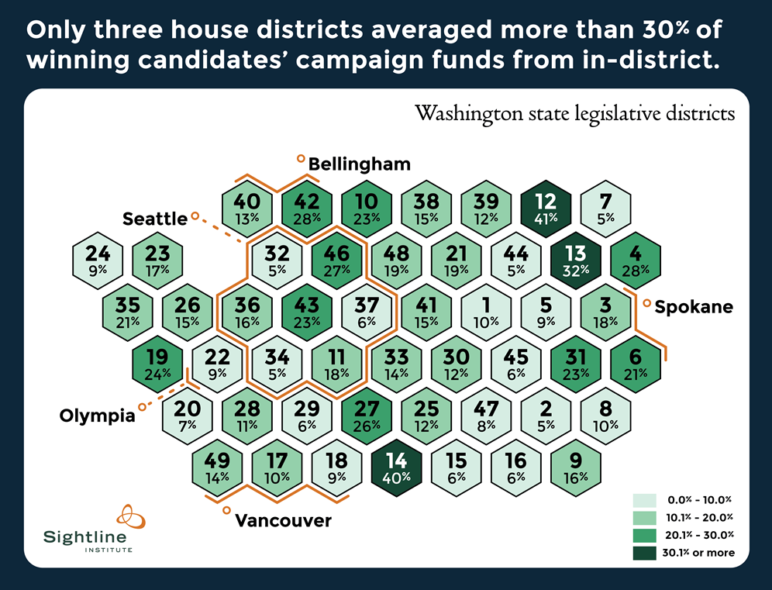
To correct for this misleading quirk of the maps and instead to give each district equal visual weight, we created new maps showing each district as a same-sized hexagon. The districts in the dense Puget Sound region take up most of the space, but we arranged the districts in roughly the same order they appear in the state and labeled major cities to help readers orient. Each hexagon is labeled with the district number and the percent of winning candidates’ funds that came from in-district donors. Based on this percent, we color-coded each hexagon by the amount of in-district funding winning candidates from that district raised, so that darker green shades represent higher rates of in-district donations.
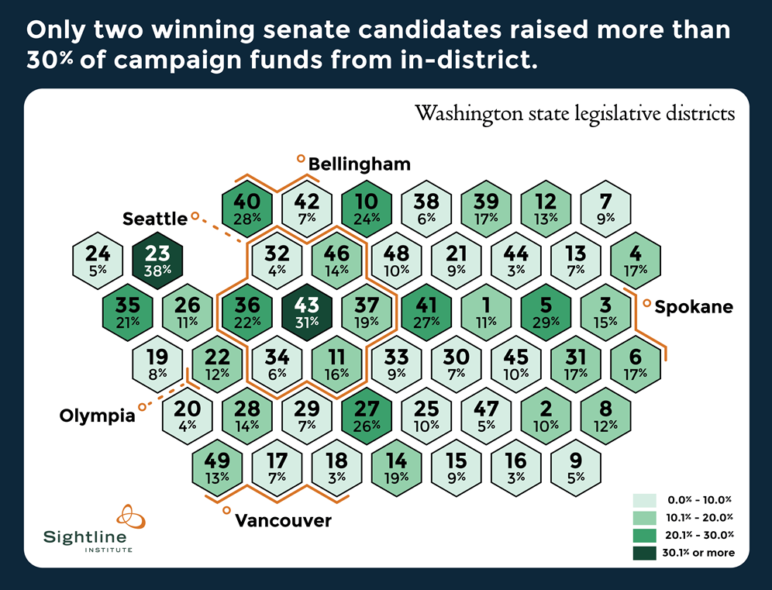
The map below shows that nearly half the senate winners in 2012 and 2014 received 10 percent or less of their campaign funds from in-district donors (lightest green hexagons), while only two Washington state senators, Jamie Pederson (District 43, Seattle) and Christine Nasser Rolfes (District 23, Kitsap Peninsula) (darkest green hexagons), raised even 30 percent of total campaign funds from in-district donors.
The story is similar in the state house. In only three districts (darkest green hexagons) did winning house members raise an average of 30 percent or more of their campaign funds from in-district donors: the 12th District, East Wenatchee; the 13th district, Ellensburg; and the 14th District, Yakima. On the other hand, average winning candidates in 19 districts—over a third of the house—depended on distant donors for 90 percent or more of their contributions (lightest green).
Conclusion
I-1464’s Democracy Credits could radically transform these maps. If each of the roughly 90,000 registered voters in each legislative district had $150 in Democracy Credits to contribute to a candidate of her choice, candidates from every district would have equal opportunity to fundraise from their own constituents, rather than relying on a handful of wealthy organizations and donors in a small slice of the state. Democracy Credits could empower winners to switch from raising a pittance from in-district donors to relying heavily on their own constituents to send them to Olympia.
To read more about the campaign funding patterns of Washington’s current state legislators, read both of our previous articles on the topic, the first of which looks at the types of donors that contribute most to winning candidates, and the second at where the money comes from.

I am just waiting to dismantle I 1464 if it wins on Tuesday. Some of the best people
that lobby would make excellent elected officials and some of the best elected officials would make the best paid lobbyisits.
Don ‘t take the power of the people away from Government.