British Columbia is of two minds. The province has pledged to reduce its greenhouse gas pollution by 80 percent by 2050, but simultaneously it aims to become the world’s largest exporter of liquefied natural gas (LNG), a fossil fuel that contributes to climate change through emissions of carbon dioxide and methane. BC is currently considering 19 LNG export proposals, many of which are colossal in size. In fact, two of the proposals would each produce more LNG than the entire country of Australia, one of the world’s top exporters.
To make clear the scale of the provincial government’s LNG plans, Sightline calculated the likely cumulative greenhouse gas emissions from the facilities. Assuming that the proposed LNG plants operate at “best-in-class” standards, we determined that BC’s 19 proposals would more than double the province’s emissions. Even assuming full electrification of all the facilities’ refrigeration and power generation processes, a near-impossible scenario, the proposals would still increase the province’s carbon emissions by over 70 percent.
Estimating BC’s LNG pollution
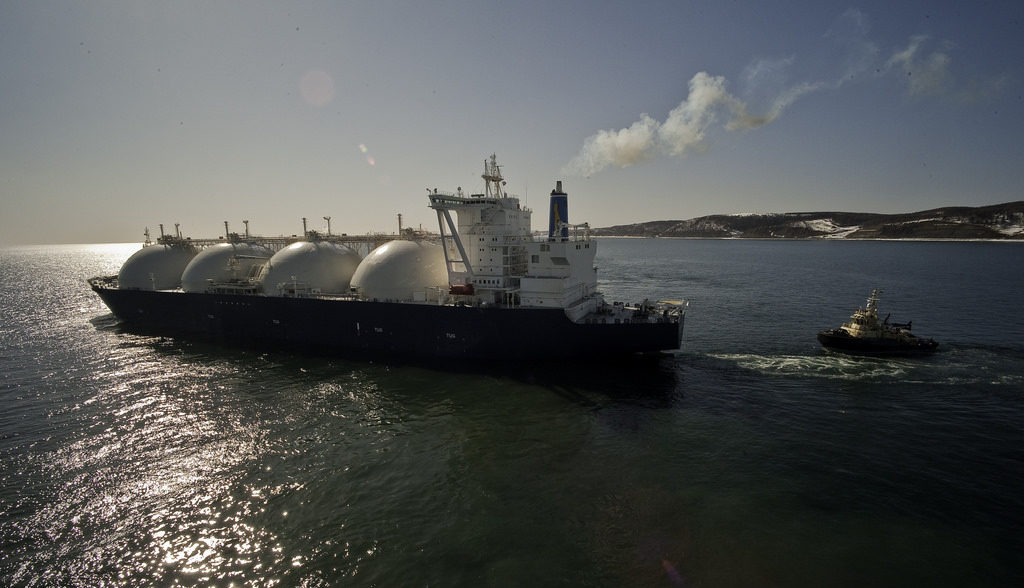
LNG export facilities liquefy methane gas, commonly referred to as “natural gas,” for transport to overseas markets. (See “What goes on at an LNG facility?”) Project boosters and the BC government claim that BC would have the world’s cleanest LNG facilities, and they emphasize the purported climate benefits of the industry. But what does that claim mean in the context of such a large number of proposals?
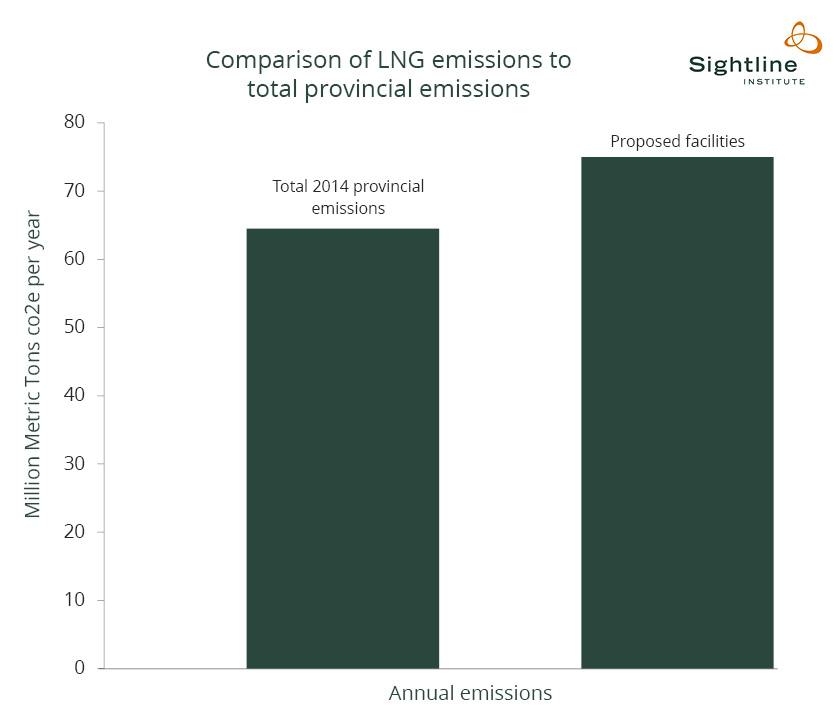
If all of BC’s proposed LNG facilities produced emissions consistent with the “best in class” technology, they would still generate 75 million metric tons of CO2e annually, or 116 percent of the province’s total 2014 emissions.
To estimate the greenhouse gas implications of LNG development, BC’s Climate Action Secretariat commissioned an emissions “benchmarking” study in 2013 to compare the greenhouse gas intensity of a grid-connected LNG facility in BC with planned and operational facilities worldwide. The study compared the “emissions intensity”—greenhouse gas emissions per unit of LNG production—of a hypothetical LNG facility powered by electricity obtained from the power grid to the average emissions of other LNG facilities around the world, where the electricity is generated on-site with methane gas–powered generators and the compressors are driven by gas-driven turbines. The study analyzed facilities that “employ the most up-to-date technologies and processes and may therefore be considered ‘best practice’ in the industry with respect to the mitigation of GHG [greenhouse gas] emissions.”
The benchmarking study became the basis of hyped news reports that BC would have “the world’s cleanest LNG facilities.” By any accounting, though, even the world’s cleanest LNG facilities would collectively have a King Kong–sized carbon footprint if the projects are both numerous and large.
To arrive at a plausible low-end emissions scenario for standard LNG production in BC, Sightline used the “best in class” figures from the facilities evaluated in the study—those that have the lowest emissions footprints. Even if BC’s LNG facilities generate emissions consistent with the least-polluting facilities observed in the government’s benchmarking study, they would more than double the province’s annual carbon dioxide emissions. The province’s most recent emissions report calculated 2014 carbon dioxide equivalent (CO2e) emissions from all sources in the province at 64.5 million metric tons. If all of BC’s proposed LNG facilities produced emissions consistent with the “best in class” technology, they would still generate 75 million metric tons of CO2e annually, or 116 percent of the province’s total 2014 emissions.
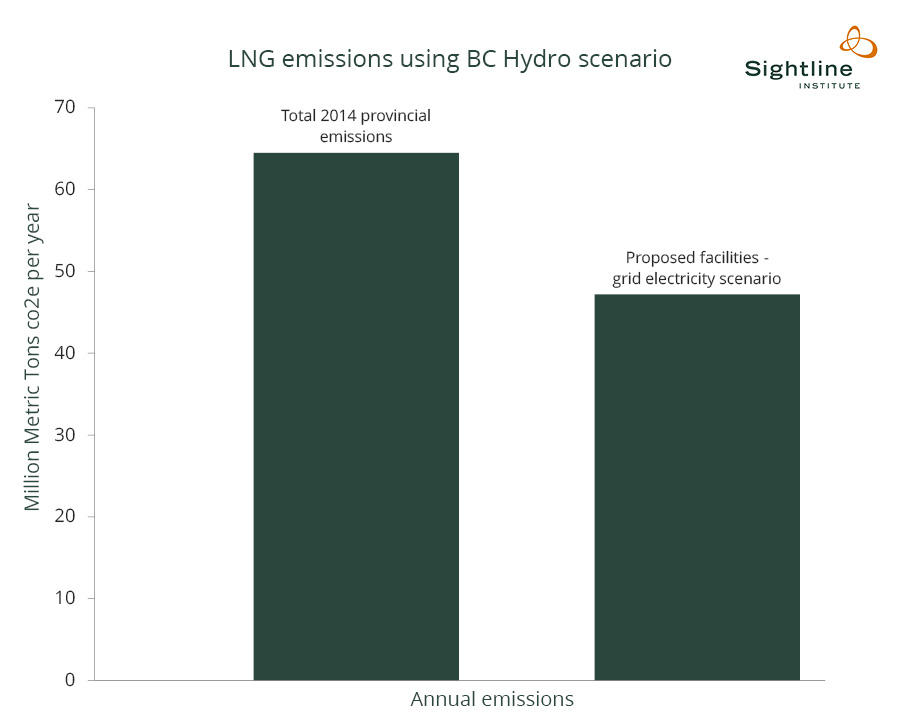
Next, we calculated LNG facility emissions based on the province’s “future technology” scenario. The BC government’s emissions report based this scenario on a hypothetical facility that, instead of powering its equipment with natural gas, uses grid electricity provided by BC Hydro. The report claimed that a grid-connected LNG facility could have a greenhouse gas intensity that was 50 percent lower than the average facility and almost 40 percent lower than the current “best in class” facilities evaluated by the study.
It’s not clear that grid-powered LNG is actually plausible in BC. According to the project description for Pacific NorthWest LNG’s proposed facility, for example, BC Hydro has indicated that it does not have enough surplus electrical energy for the number of facilities proposed in the province and, further, that it lacks existing transmission infrastructure to deliver surplus energy to the Prince Rupert area, which is home to seven proposed LNG export sites. (See page 10 of the project description.)
Even with this drastic—and unrealistic, because there isn’t enough electricity or transmission capacity available—reduction in greenhouse gas intensity, BC’s proposed LNG facilities would still produce 47.2 million metric tons of CO2. That’s over 70 percent of the emissions produced by all other sources in the province in 2014.
LNG facilities’ pollution sources
Across North America, natural gas is displacing coal as a fuel for generating electricity. The primary reason is cost (gas is cheap), but the LNG industry’s marketing rhetoric focuses on the fact that it produces less greenhouse gas pollution than coal when combusted. When compared to coal, burning natural gas also produces less particulate matter and sulfur dioxide, which are hazardous to public health.
It must be noted, though, that the pollution reduction occurs at the place where the fuel is burned. In the case of BC exports, the destination countries are in East Asia. The emissions reduction at the fuel’s final destination should not be confused with the local and regional emissions produced by LNG facilities themselves. A large-scale liquefaction facility produces substantial emissions, including methane, carbon dioxide, and other greenhouse gases.
LNG facilities produce emissions in at least five different ways:
- Fuel-fired equipment powers a facility’s gas refining and refrigeration processes by burning methane gas and produces the largest portion of a facility’s emissions.
- Venting removes surplus gases from processing equipment and disposes of waste gas. As a normal part of liquefaction and storage at an LNG facility, venting releases the greenhouse gases methane and CO2 directly into the atmosphere.
- Flaring burns waste gases, converting them into emissions of carbon dioxide and nitrogen oxide as well as other pollutants like carbon monoxide and particulate matter.
- “Fugitive emissions” of methane gas escape directly into the atmosphere from various pieces of equipment, including pipelines that feed gas to facility equipment.
- Marine emissions are released from the LNG tankers, many of which run on heavy fuel oil and emit related pollutants, including particulate matter, a significant contributor to lung and heart conditions in humans. An LNG tanker typically spends around 24 hours at port, and some facilities would likely have multiple vessel calls per week.
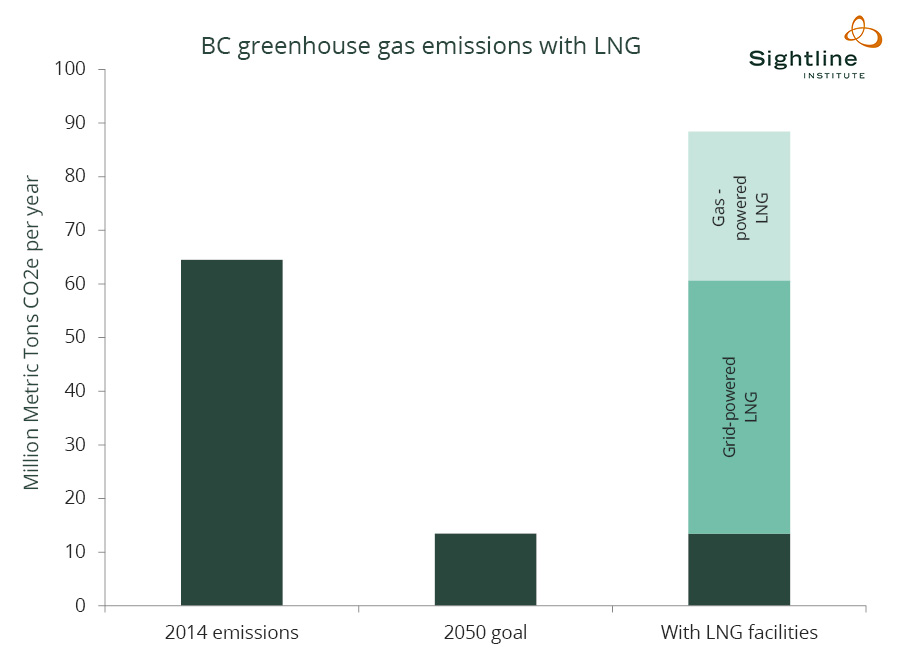
Since the fuel-fired facility processes consume the most energy and produce the lion’s share of greenhouse gas pollution, powering these processes with hydro-derived grid electricity would indeed reduce the greenhouse gas footprint of BC’s LNG facilities. But if BC aims to produce four times as much LNG as world’s largest LNG producer, it must admit that it could also become one of the world’s largest generators of greenhouse gas emissions from LNG production. While the province has pledged to reduce emissions by 80 percent, the proposed LNG facilities would actually increase the province’s emissions by between 70 and 116 percent, making it impossible to reach that goal.
BC may have pledged to have the cleanest LNG facilities in the world, but the promise is cold comfort when the province cannot deliver enough electricity to support its idealistic technology scenario. Moreover, the sheer quantity and scale of proposals that BC officials hope to greenlight are staggering. It’s not yet clear which direction the province will take after the recent election, but one issue is evident: BC must decide how serious it is about fighting climate change.
[list_signup_button button_text=”Like what you|apos;re reading? Get our latest fossil fuel research right to your inbox.” form_title=”Fighting Fossil Fuels” selected_lists='{“Fighting Fossil Fuels”:”Fighting Fossil Fuels”}’ align=”center”]
Methodology
BC’s 2013 “benchmarking” study analyzed eight facilities; four were operational, three were under construction, and one was in the proposal stage. The operational facilities were Qatargas 1 and 2, which were included as a benchmark of typical emissions intensity; Snovhit LNG, which has the lowest greenhouse gas emissions of any facility currently in operation; and Pluto LNG, a recently commissioned plant with standard new-facility performance. The under-construction facilities were three Australian facilities that will incorporate greenhouse gas mitigation measures. The proposed facility included in the study is US facility Sabine Pass, which had the lowest proposed intensity of any of the facilities surveyed. (Sabine Pass is now operational.) The study included emissions for all processes within the facilities but excluded marine emissions and end-use emissions.
These eight facilities generated or proposed to generate between 0.26 and 0.49 metric tons of carbon dioxide equivalent (CO2e) for every metric ton of LNG produced, with an average intensity of 0.34 metric tons of CO2e.
The average emissions of the three least-polluting facilities, all of which use current technology and/or carbon capture, was 0.27 metric tons of CO2e for every metric ton of LNG produced. We used this figure to calculate emissions that would be produced by BC’s proposed LNG facilities using gas-fired turbines. This number is consistent with figures used by the proposed Aurora LNG and Pacific NorthWest LNG facilities, which estimated their annual emissions using 0.28 and 0.27, respectively.
|
Facility |
Metric tons CO2e/metric ton of LNG |
| Sabine Pass (US) | 0.26 tCO2e/t LNG |
| Australia Pacific (Australia) | 0.30 tCO2e/t LNG |
| Pluto LNG (Australia) | 0.36 tCO2e/t LNG |
| Snohvit LNG (Norway) | Between 0.29 and 0.34 tCO2e/t LNG |
| Qatargas 1 (Qatar) | 0.49 tCO2e/t LNG |
| Qatargas 2 (Qatar) | 0.41 tCO2e/t LNG |
| Gorgon Gas Project (Australia) | 0.27 tCO2e/t LNG |
| Gladstone LNG (Australia) | 0.35 tCO2e/t LNG at full build-out |
To calculate the all-electric scenario for BC’s proposed LNG facilities, we used the study’s estimation of the greenhouse gas intensity of a grid-connected facility, which is 0.17 metric tons of CO2e for every metric ton of LNG produced. This includes 0.1 metric tons from grid electricity consumption and 0.07 metric tons from other power requirements: CO2 venting, methane venting, fugitive emissions, flaring, and on-site heating. Two proposed BC LNG facilities have gone lower than this benchmark in calculating their emissions, but we did not find the methods credible enough to use in this exercise because they omitted emissions-producing processes that are not remedied by using grid-based power.
|
Calculations for graphs |
|||
| Annual production—all projects* | Emissions factor | tCO2e annually |
% of 2014 provincial emissions |
| 277.6 million | 0.27 | 74,952,000 | 116 |
| 277.6 million | 0.17 | 47,192,000 | 73 |
* The Nisga’a LNG project has yet to announce its annual production, so it was not included in these calculations. The inclusion of this facility would increase annual emissions calculations.
For the 2050 emissions goal represented on our third chart, we used the province’s Climate Leadership Plan, which includes the goal of reducing BC’s 2007 emissions by 80 percent by 2050. The province’s 2007 emissions were 67.3 megatonnes of CO2e in 2007. Learn more about BC’s emissions reductions goals here.

It is an astoundingly shocking situation wherein the corporation purports to not see that they are an extreme contributor to the destabilization of the planet’s climate. If they believe they are likely to kill off the planet for their own temporary gain or choose to assert to themselves that they are innocent, they are failing the code of a moral community. They need to be isolated and rendered harmless. It will become the rest of us to have done what is necessary.
These LNG projects are insane and absolutely not necessary. The sales pitch is based on assumption what the Asian market eventually could burn. Especially China is reducing its fossil fuel footprint more than any one else on this planet.
Other Asian countries are moving in the same direction. All these countries have right now enough fossil fuel energy and don’t need more.
LNG is Cristy Clarks glass castle in the sky which she build her dictatorship on.
Site C-dam isn only planned on the assumption that all its electricity produced will go to the LNG production facilities.
LNG in itself is worse than coal as a GHG when all pollution from cradle to grave are put into the equation.
One aspect of pollution is not discussed in this paper and that is the fugitive methane at the frack sites and what is later coming to the surface over and around fracked areas.
Can anyone help out with advertising the % of energy used to convert NG into LNG.
I could only find one line in Wikipedia and it said about 40% some 3 to 4 years ago.
That means that 40% of energy coming out of the ground is used to liquefy it, and enormous amount.
Since then that line disappeared.
Only the tar-sands need more energy to extract the bituminous oil.
Tell me what is the effect on WORLD carbon emissions, NOT BC’s, if those projects go ahead. You talk about BC emissions as if it’s inside a separate enclosed air capsule within it’s own atmosphere independent of the rest of the world. The fact is, if they are not built in BC, they will be built, and ARE already being built all over the rest of the world. They are being built right now, new contracts are being signed right now, and many more are being planned for the coming days.
Get real. LNG is here to stay. It’s happening, and will happen. If it’s not in BC, it will somewhere else. I know what your real motives are. You don’t want it in BC because: you already have your safe job and don’t expect to be economically impacted or linked to the benefits that billions of dollars invested in these project will bring to the REST of Canadians, you are strong and firm to you “not in my backyard” belief regardless of any rational justifications , and/or you want it to happen in the US (as it is known that many “environmentalists” opposed to LNG in Canada are funded to do).
Stop posting nonsense online please.