[vc_row][vc_column][vc_column_text]The fossil fuel industry purports that natural gas is “clean,” but that claim fails to account for climate-damaging methane leaks along the supply chain. Poor external reporting requirements mean gas companies don’t have to share how much fugitive methane escapes into the atmosphere each year. With no one to compel more data-sharing from the industry, it can convince policymakers and the public that any uncertainty in independent research is enough reason to discredit the questions themselves.
Despite uncertainty outside the industry about how much methane is leaking, the available data make a few things clear: natural gas is most likely a climate disaster dressed as a solution, and better accounting of methane releases could help us avoid the tremendous mistake of investing in large-scale fracked gas infrastructure that will compound our climate crisis.[/vc_column_text][/vc_column][/vc_row][vc_row][vc_column][vc_column_text]
This is part of a trilogy of articles to provide depth and context to methane leaks. Read the other pieces in this series:
[/vc_column_text][/vc_column][vc_column width=”1/2″][vc_btn title=”Part 1″ color=”primary” size=”lg” align=”center” button_block=”true” link=”url:https%3A%2F%2Fwww.sightline.org%2F2019%2F02%2F12%2Fcalling-natural-gas-a-bridge-fuel-is-alarmingly-deceptive%2F||target:%20_blank|”][/vc_column][vc_column width=”1/2″][vc_btn title=”Part 2″ color=”primary” size=”lg” align=”center” button_block=”true” link=”url:https%3A%2F%2Fwww.sightline.org%2F2019%2F02%2F12%2Fmethane-climate-change-co2-on-steroids%2F||target:%20_blank|”][/vc_column][vc_column][vc_column_text] [/vc_column_text][/vc_column][/vc_row][vc_row][vc_column][vc_column_text]The Union of Concerned Scientists estimates that annual US “fugitive” methane emissions—methane unintentionally released into the atmosphere—from fracked gas infrastructure are equivalent to the heat-trapping pollution from between 35 and 314 coal-fired power plants. The range is so broad because scientists have to draw conclusions from partial data. There are relatively few rules (and weak, inconsistent ones at that) to govern the industry’s reporting of fugitive emissions, so researchers are still uncertain about exactly how much methane is leaking into the atmosphere from fossil fuel infrastructure such as pipelines, extraction sites, and processing equipment.
In our previous articles in this series, we discussed the global warming potential (GWP) of methane.
This article will take a look at how much methane is leaking into the atmosphere—what we know and what we yet need to find out. [/vc_column_text][/vc_column][/vc_row][vc_row][vc_column][vc_column_text]
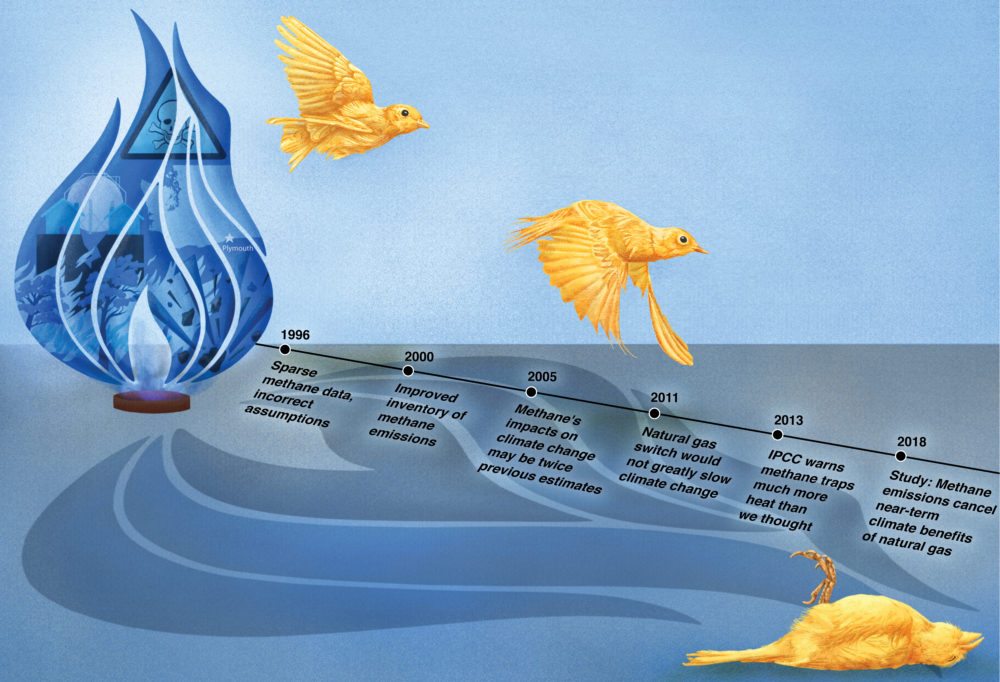
Despite debate over source, there’s no doubt US methane emissions are increasing
Atmospheric concentrations of methane are much higher than pre-industrial levels. In fact, they have more than doubled over the last two centuries largely due to human activities and man-made emissions, which account for 50 to 65 percent of the total amount of methane that enters the atmosphere each year.
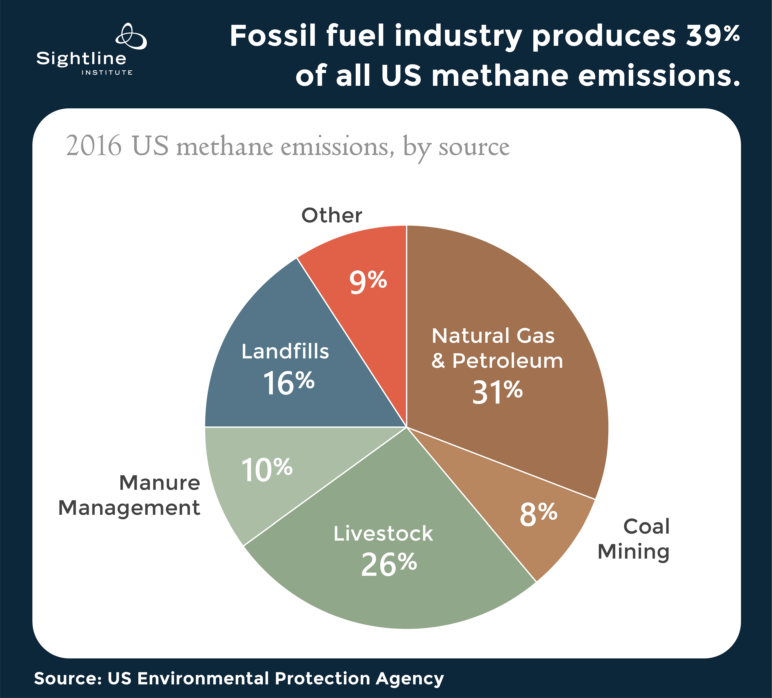
In the United States, methane emissions have increased rapidly in the 21st century, perhaps by more than 30 percent. The US Environmental Protection Agency (EPA) estimates that in 2016, the principal sources of methane released by human activities in the United States were: oil and gas production and distribution (31 percent), livestock (26 percent), landfills (16 percent), manure management (10 percent), and coal mining (8 percent). All other sources accounted for 9 percent of US methane emissions. The combined methane emissions of the fossil fuel industry (oil, gas, and coal) made up 39 percent of the US total, while the combined methane emissions of livestock (including manure) accounted for 36 percent.
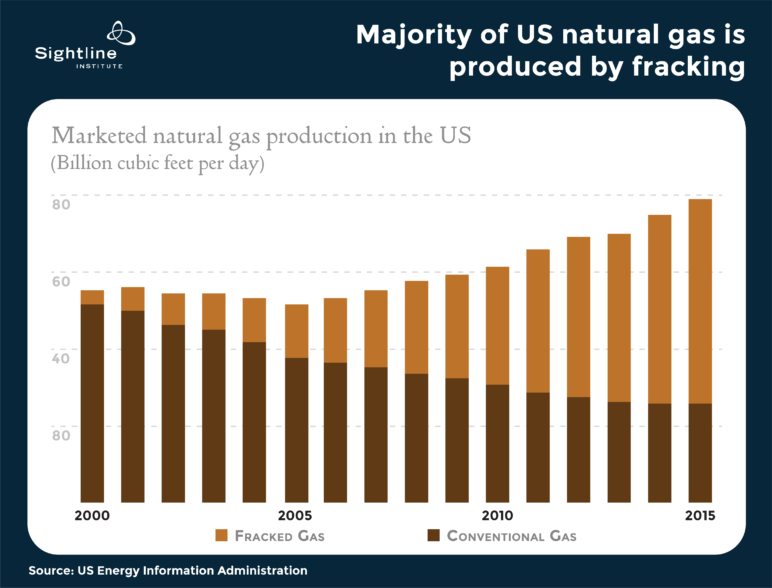
 [/vc_column_text][/vc_column][/vc_row][vc_row][vc_column][vc_column_text]The fracked gas sector is particularly worth exploring because it ushered in the rapid increase in US natural gas production. Although agricultural practices account for more than one-third of all US methane emissions and are a serious concern for climate change, the fossil fuel industry represents the largest share. Gas production from fracking more than doubled between 2005 and 2015, going from about a third of US gas production to nearly 70 percent. (Gas production from non-fracked sources actually declined during this period.)
 [/vc_column_text][/vc_column][/vc_row][vc_row][vc_column][vc_column_text]Because natural gas is composed primarily of methane, it would be easy to assume that fracking is the culprit behind rising methane emissions. That may be true in part, yet correlation is not causation. It is difficult for researchers to unambiguously identify the source of recent increases in methane emissions due to data limitations. Instead of providing clarity, studies that attempt to quantify methane emissions can lead to greater confusion. That’s because scientists use two very different methods of analysis to attempt to quantify methane leaks from the oil and gas industry: top-down studies and bottom-up studies. The method of analysis can have a big impact on a study’s outcome, leading to competing claims about how harmful the fracked gas industry is to the climate.
Bottom-up studies take measurements at select fracked gas facilities and extrapolate the results to the rest of the industry. Researchers conducting bottom-up studies measure emissions by sampling methane leaks directly from several specific sources in a region, then essentially multiplying the results by the number of similar facilities in that region. The top-down approach measures methane concentrations in the atmosphere and then tries to identify the likely emissions sources by estimating or modeling how the methane migrates once it’s in the atmosphere. [/vc_column_text][/vc_column][/vc_row][vc_row][vc_column][vc_column_text]Both methods have weaknesses. It’s difficult for top-down studies to unambiguously identify the source of the methane detected in the atmosphere—these studies can’t definitively say whether methane is from a specific fracking site or landfill or manure lagoon. Bottom-up studies notoriously lack enough measurements to capture the range in leakage from one facility to the next, often taking samples only at lowest-emitting facilities, resulting in an underestimation of methane escape. (See 1, 2, 3)
Top-down studies at least capture a more accurate picture of the quantity of methane released into the atmosphere in a given region. By contrast, bottom-up studies on local and regional scales consistently underestimate emissions. The data in bottom-up studies are usually from facilities that volunteered to participate in a study, and they aren’t representative of the range in leakage at different facilities. Many bottom-up studies do not disclose their sampling methods and some experts criticize this method for cherry-picking measurements from low-emitting pieces of infrastructure.
The fracked gas industry is plagued by “super emitter” facilities that are responsible for a disproportionately large share of regional emissions.
Sampling that accurately represents the full range of facilities is critical to methane accounting. The fracked gas industry is plagued by “super emitter” facilities that are responsible for a disproportionately large share of regional emissions. Bottom-up studies that exclude super emitters could grossly underestimate methane emissions. Many scientists recommend verifying bottom-up methane studies with top-down (or atmospheric) measurements. [/vc_column_text][/vc_column][/vc_row][vc_row][vc_column][vc_column_text]Since 1990, the EPA has published an annual report that tracks US emissions by greenhouse gas, by source, and by economic sector to try to account for climate-changing emissions from all man-made US sources. For the first 20 years of this greenhouse gas inventory (GHGI), the methane data were based on bottom-up measurements from facilities that the industry volunteered for leakage measurement. There is now widespread agreement, however, that EPA’s bottom-up greenhouse gas inventory consistently underestimated US methane emissions by a factor of 1.5 (50 percent) or more. (See 1, 2, for example.) In the South Central United States, where there are a large number of oil and gas fracking basins, the inventory appears to underestimate methane emissions by nearly a factor of five. (Note that because the source of methane emissions are often difficult to identify, the EPA’s persistent underestimation could also apply to methane from sources such as livestock and wetlands.)
The EPA’s bottom-up greenhouse gas inventory consistently underestimated US methane emissions by a factor of 1.5 (50 percent) or more.
Policymakers should understand that emissions inventories provide estimates. Before policymakers permit further construction of fracked gas facilities, like liquefied natural gas (LNG) export terminals and new pipelines, they should require much better proof that these are cleaner choices. That includes better industry reporting, studies using random sampling techniques, and verification of bottom-up studies with top-down atmospheric methane observations. [/vc_column_text][/vc_column][/vc_row][vc_row][vc_column][vc_column_text]
A life cycle analysis: fairly evaluating fracked gas projects
The standard review process for gas-based projects is failing to capture the true sources of harm from fracked gas. To accurately compare gas projects to other energy alternatives, officials should conduct a lifecycle analysis to capture a more complete picture of greenhouse gas emissions. A life cycle analysis is a calculation that takes greenhouse gas emissions throughout the supply chain into account. When applied to fracked gas, life cycle analyses factor in emissions from “upstream” processing (things like building and operating a gas extraction well, processing the gas to remove impurities, and shipping it via pipeline), processes at a fracked gas or LNG facility, shipping emissions, and combustion. This comprehensive review is important because methane is leaked or intentionally released at each of these stages in the fracked gas life cycle.
To understand why a life cycle analysis is critical to evaluating fracked gas projects, we can look at the example of an LNG export facility. A 2015 study on LNG exports found that typical emissions from processes at the facility and shipping account for less than 11 percent of the total life cycle emissions—yet these are often the only emissions that project reviewers are taking into account. In fact, sometimes even the shipping emissions are also omitted from review.
So what about the 89 percent of emissions that are being ignored? The largest share of LNG project emissions come “downstream” from the end-use combustion—the burning of the fuel at its destination. The second-largest release of greenhouse gases comes from “upstream” emissions sources, such as leaks along the transmission infrastructure that moves the gas from wellhead to facility. Using an average assumption about leakage rates, the study estimated that upstream methane emissions are nearly five times the emissions produced at the LNG facility itself. A life cycle analysis is designed to provide a more complete picture of a project’s climate impact by measuring both upstream and downstream emissions.
Life cycle analyses show that focusing on a narrow set of emissions at a gas facility is blinkered accounting. It leaves far more significant emissions in a regulatory blind spot than it counts, thereby grossly understating the actual impacts of fracked gas on climate change. 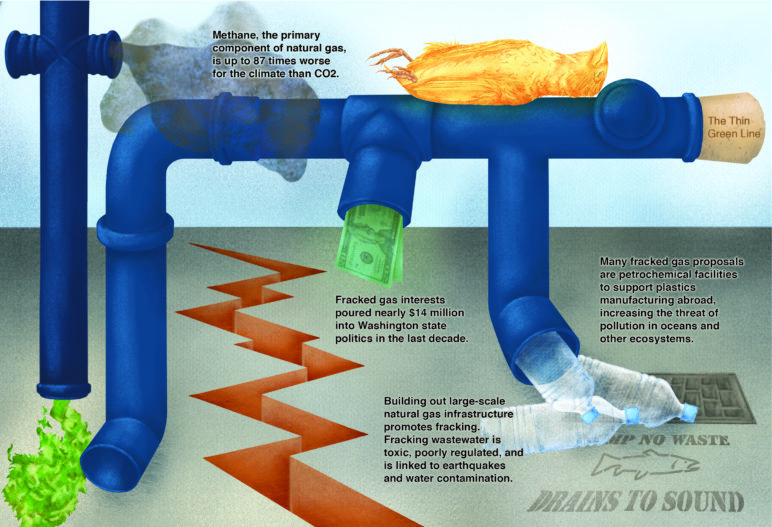 [/vc_column_text][/vc_column][/vc_row][vc_row][vc_column][vc_column_text]It’s unlikely that end-use combustion will be included in the environmental assessment of a facility, especially for an export facility where the fuel burning occurs in another country. But there is still some reason for optimism. Northwest regulators are beginning to recognize that upstream methane leakage is an important factor to consider. In 2018, for example, environmental assessments of fracked gas projects in Kalama and Tacoma, Washington, were rejected or sent back for supplemental review because they did not include important life cycle emissions components. Yet without a clear and broad understanding of what modern science says about fracked gas, uncertainty may continue to pay large dividends for the fossil fuel industry.
Thanks to Adrian Down and Marcia Baker, who contributed research to this series.[/vc_column_text][/vc_column][/vc_row][vc_row][vc_column][vc_column_text]
This is part of a trilogy of articles to provide depth and context to methane leaks. Read the other pieces in this series:
[/vc_column_text][/vc_column][vc_column width=”1/2″][vc_btn title=”Part 1″ color=”primary” size=”lg” align=”center” button_block=”true” link=”url:https%3A%2F%2Fwww.sightline.org%2F2019%2F02%2F12%2Fcalling-natural-gas-a-bridge-fuel-is-alarmingly-deceptive%2F||target:%20_blank|”][/vc_column][vc_column width=”1/2″][vc_btn title=”Part 2″ color=”primary” size=”lg” align=”center” button_block=”true” link=”url:https%3A%2F%2Fwww.sightline.org%2F2019%2F02%2F12%2Fmethane-climate-change-co2-on-steroids%2F||target:%20_blank|”][/vc_column][/vc_row]

Thanks for the excellent articles on the evils of natural gas. They underline my concern that we have are mistaken in continuing to focus on carbon and decarbonization rather than greenhouse gases since the carbon frame dramatically undervalues the global warming damage imposed by natural gas usage and actually has the potential consequence of encouraging the switching of vehicles and utilities to natural gas (CNG, propane or some variant that keeps the fracking going).
I note that the oft-promoted RGGI program in the eastern states – which targets only carbon dioxide from fossil fuel combustion – has encouraged exactly the switch mentioned above and has resulted in a rapid increase in methane emissions.
It’s rather insulting to recall that fossil fuel exporters screamed about energy independence for America for years and years. Just allow them to dig up more oil and gas to provide a “secure” energy future here. Almost 1/2 of US consumption was from imports from the Middle East and elsewhere. There was never going to be any energy independence. Meanwhile exporters were hustling the government to have the long-standing oil/gas export ban removed so they can get a piece of the lucrative Chinese market.
Obama changed the laws near the end of his reign so that gas and oil could be sold overseas. Exporters began to rake in 4 times the profit they could get here in the US.
Were it not for the flood of oil and gas from recent dangerous fracking operations, America would be running out of oil . US Oil production peaked in 2005, with horrendous price spikes to almost $150/barrel following. Many economists ascribe the 08 financial calamity to the drop in oil production and subsequent price flare up.
Exporters are wetting themselves these days trying to rush oil and gas overseas to catch the last profits before climate change reckoning comes due. They’re scrabbling for any port or gas line that can get their oil to the Orient. The “Oil Patch” consensus thinks that fracking will run its course and begin it’s inevitable decline within 2 to 4 years. Then, American imports will begin to soar – but by then, everyone else will be clawing for any oil that can be had for any price.
All that oil and gas the exporters sold for a fast buck overseas would surely come in handy when our heyday of fracking comes to a close soon.
$150/barrel prices will seem like the “good old days” when fracking tips over the edge.
Methane Clathrates anyone?
The LNG export companies claim they will help replace coal power with cleaner natural gas power. BUT the Department of Energy has determined it’s too difficult and maybe even impossible for the LNG export companies to determine the final end use of their LNG product.
“DOE halting ‘end use’ reporting policy for LNG exports,” Brian Bradley, 12-20-2018, American Shipper, https://www.americanshipper.com/magazine/doe-halting-end-use-reporting-policy-for-lng-exports?autonumber=73068&infrom=right&year=2018&month=12&page_number=6&todayedition=true
The Energy Department’s Office of Fossil Energy is discontinuing a practice adopted in 2016 of including an “end use” reporting provision in orders authorizing the export of domestically produced natural gas, including liquefied natural gas (LNG), DOE announced in a Federal Register post Wednesday.
The decision is based on “practical concerns” and a “reconsideration of the need for the requirement given those concerns,” DOE said.
The department will revert to the prior practice of requiring authorization holders to report, in relevant part, the country or countries into which the exported LNG or natural gas was actually delivered, as DOE believes this action will improve the accuracy of information provided by authorization holders and reduce administrative burdens for the U.S. LNG export market, DOE said.
DOE started adding an “end use” reporting requirement as a condition to all long-term, and some short-term, LNG export authorizations issued after Feb. 4, 2016
Per the provision, authorization holders currently are required to include the following provision in any agreement or other contract for the sale or transfer of LNG exported pursuant to its long-term LNG authorization:
“Customer or purchaser acknowledges and agrees that it will resell or transfer U.S.-sourced natural gas in the form of LNG purchased hereunder for delivery to the countries identified in … and/or to purchasers that have agreed in writing to limit their direct or indirect resale or transfer of such LNG to such countries. Customer or purchaser further commits to cause a report to be provided to [the long-term LNG export authorization holder] that identifies the country of destination (or countries) into which the exported LNG or natural gas was actually delivered and/or received for end use, and to include in any resale contract for such LNG the necessary conditions to ensure that [the long-term LNG export authorization holder] is made aware of all such actual destination countries.”
As part of monthly reporting requirements, authorization holders are required to report, for each LNG cargo, the country or countries of destination into which the exported LNG was actually delivered and/or received for end use.
DOE has defined “end use” to mean combustion or other chemical reaction conversion process. The department has included this end use provision in more than 40 export authorization orders.
But DOE has become aware that it’s impractical, if not impossible, for authorization holders to comply with the end use reporting requirement; for instance, a cargo of LNG could be offloaded and regasified in one country, and a portion of the U.S. natural gas could be re-exported via pipeline to other countries without direct knowledge or control of the parties to the initial export from the U.S., DOE said.
DOE launched the end use reporting provision after concerns arose that companies could attempt to circumvent additional requirements for public interest reviews for exports to countries with which the U.S. doesn’t have a free trade agreement, according to the Federal Register post.
The concerns arose after DOE on Feb. 5, 2016, granted applications of certain Canadian companies requesting authorization to export U.S.-sourced natural gas by pipeline to Canada, an instance wherein the companies planned to re-export the U.S. natural gas in liquid form to other countries, DOE said.
“DOE has determined that, for the reasons described herein, there is currently insufficient concern about authorization holders attempting to circumvent the public interest review process for non-FTA exports to justify an end-use reporting requirement — particularly given the compliance difficulties encountered by authorization holders,” DOE said.
Further, re-exports of all LNG cargoes represent a very small percentage of LNG trade, the department said.
DOE’s policy statement applies only to future orders, and DOE is issuing a blanket order to remove the end use provision from existing authorizations issued on or after Feb. 5, 2016, DOE said.
The department has included a list of the affected export authorizations in that blanket order.
Note: SAVE RGV from LNG is continuing its fight against Rio Grande LNG, Annova LNG, and Texas LNG operations FERC is scheduled to approve on or before 07-25-2019. Rio Grande LNG’s parent company, NextDecade, is also pushing forward a Galveston Bay LNG project and a Inisfree FSRU [one “n”] deal with the Irish Port of Cork to supply Ireland with natural gas delivered by Floating Storage and Regasification Units (ships). Check out our website at http://www.savergvfromlng.com/ and Facebook page at https://www.facebook.com/saveRGVfromLNG/.
Awesome article, from an awesome teacher and researcher. Please add paragraph makes, to make it more readable. Pull the reader in and they need open space to not be scared away. So many people apparently don’t read anymore. I hope there is a PR crew (college film people) making like 5 minute clips, or 10, summarizing this. Really, it’s hard to break through. Awesome information and it’s important that we not assume others know what we do, since it’s a real goal of the regime to confuse and lie and obfuscate. No wonder people either know nothing or what they think they know are utter lies.
Great article. Thank You.
A well crafted article. Deceptive but well crafted. It is obviously intended to induce deceptive “take-aways” in those who do not read the caveats either later in your text or in the referenced or linked background material.
I cannot speak for you but I suggest you change the title to “Coal Really Isn’t That Bad” or “Urgent Need To Reduce Methane GHG Emissions and Natural Gas Leaks”.
There are so many examples that it is hard to even start. You start with is the CO2e forcing factor 35 or 87? You like 87 because you like 20 year value. Yet later you attempt a truly simplistic projection “if a proposal for a fracked gas project has an expected life span of 60 years, the plant’s methane emissions would live in the atmosphere for approximately 72 years”. You had already explained that methane averaged a 12 year lifetime in the atmosphere. So 60+12=72? Deceptive? I would like a reference that projects upstream fugitive and flared emissions for the next 60 years please.
You obviously read the paper:
https://www.pnas.org/content/110/50/20018.abstract
“Overall, we conclude that methane emissions associated with both the animal husbandry and fossil fuel industries have larger greenhouse gas impacts than indicated by existing inventories”
This paper used 2007-2008 data and also said: “CH4 emissions from Texas, Oklahoma, and Kansas alone account for 24% of US methane emissions, or 3.7% of the total US greenhouse gas budget”.
Please present a reference that shows what % of wells in these three states were fracked in 2007-2008. I doubt very many. Bakken, yes. These 3? No.
So why do you call it fracked natural gas? Now it is. 10 yeas ago? No. Where is the reference to fracked natural gas upstream drilling and production emissions?
This isn’t a scientific paper but I challenge you to research and reference the factoids in it:
https://www.forbes.com/sites/judeclemente/2019/03/06/record-u-s-oil-and-natural-gas-falling-methane-emissions/
Your treatment of the “top-down” versus “bottom-up” is strictly your opinion as your reference does not say this. It was a statistical analysis that inferred that 50% if the CH4 emissions came from 5% of the wells. You inferred that the bad apples just do not report. Please reference a scientific paper that has data to support your thesis. Otherwise, you might consider using EPA data such as:
https://www.epa.gov/sites/production/files/2019-04/documents/us-ghg-inventory-2019-chapter-2-trends.pdf
There should be plenty of data on the Marcellus and Barnett shale fracked dry gas wells both during drilling/completion and during production/transmission.
All this fracking activity is within the last 10-15 years. Do not use 10 year old data to make your points.
It is just being deceptive.
I won’t bother going further into other examples.
I ask you to review your ‘highlighted’ factoids and assess whether these infer an accurate assessment of the facts within the text body of your article.
Methane (& other short lived) GHG emissions from enteric fermentation and manure are larger than for natural gas in the USA. Does this infer that ‘going vegan’ will save the planet? Some infer this but we still have to eat.
Conclusion: Deceptive ‘headlines’, selective use of data, use of old data and out of date data sources.