
North Carolina voters are among those in the spotlight this election as the state plays a key role in the Electoral College path to the White House. Throughout October, Sightline has been analyzing North Carolina’s absentee ballot return data. North Carolina’s data is more accessible and more detailed than most other states, providing the opportunity for in depth analysis. Our previous articles parsed the data to date by voters’ race, by party, and by county.
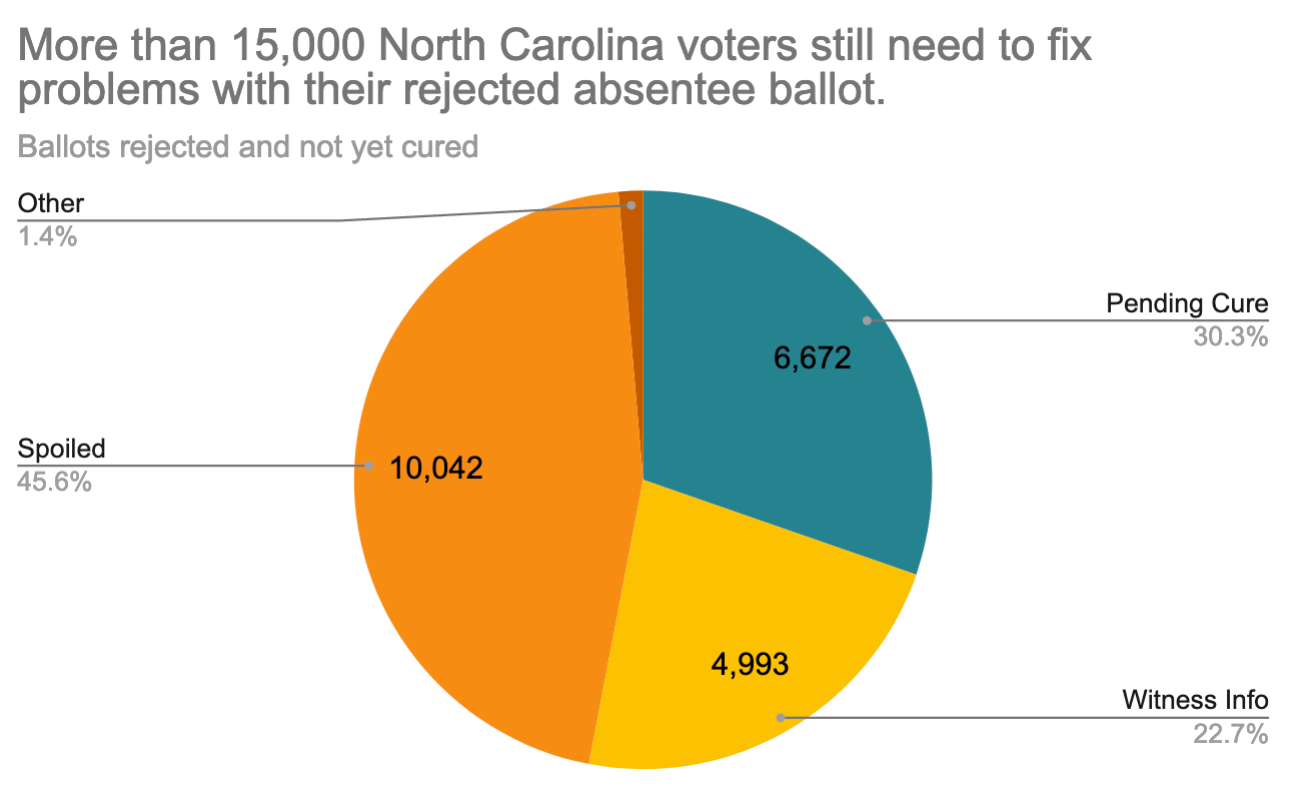
North Carolinians voted absentee in record-breaking numbers this general election. More than 920,000 absentee ballots have already been accepted to be counted. Among those, 5,000 ballots were initially rejected but voters used the cure process to fix the problems and get their vote counted. But more than 22,000 absentee ballots are currently not being counted. More than 6,000 voters have initiated the cure process to fix any problems. If successful, their votes will be counted. That still leaves 15,336 North Carolina voters who submitted their ballot but forgot to sign or to get a witness to sign (around 10,000) or forgot to write their witness’s name and address (around 5,000). Unless these voters go through the process to cure those problems by November 12, their vote won’t be counted. The margin of victory in the presidential race and US Senate race could be in the thousands, so every one of those rejected absentee votes could make a difference.
North Carolina voters who submitted an absentee ballot and want to make sure it counts can check the status of their ballot here.
Chart 1: Thousands of North Carolina absentee votes will not be counted unless voters take action.
 Rejected Ballots by Race
Black voters were less likely to vote by mail, and more likely to have their ballots rejected. Of the 22,000 ballots that are not yet accepted to be counted, more than half are from white voters and more than one-quarter are from Black voters, even though white voters made up 68 percent of all absentee ballots returned, and Black voters made up only 15 percent. Including the initially rejected but now cured ballots as accepted, Black voters absentee ballots are still being rejected at more than twice the rate of white voters: 4.5 percent for Black compared to 1.8 percent for white. If all the voters who have started the cure process (teal in the Chart 2, below) successfully get their vote counted, that would bring rejection rates down but slightly increase the racial disparity—3.1 percent of Black absentee voters would still be rejected compared to 1.3 percent of white (see Table 1).
Of the 4,567 Black absentee voters that can still cure their ballots, 64 percent live in just nine counties: Wake, Mecklenburg, Guilford, Cumberland, Forsyth, New Hanover, Durham, Pitt, and Gaston.
Chart 2: Black voter make up 15 percent of absentee voters but 28 percent of rejections
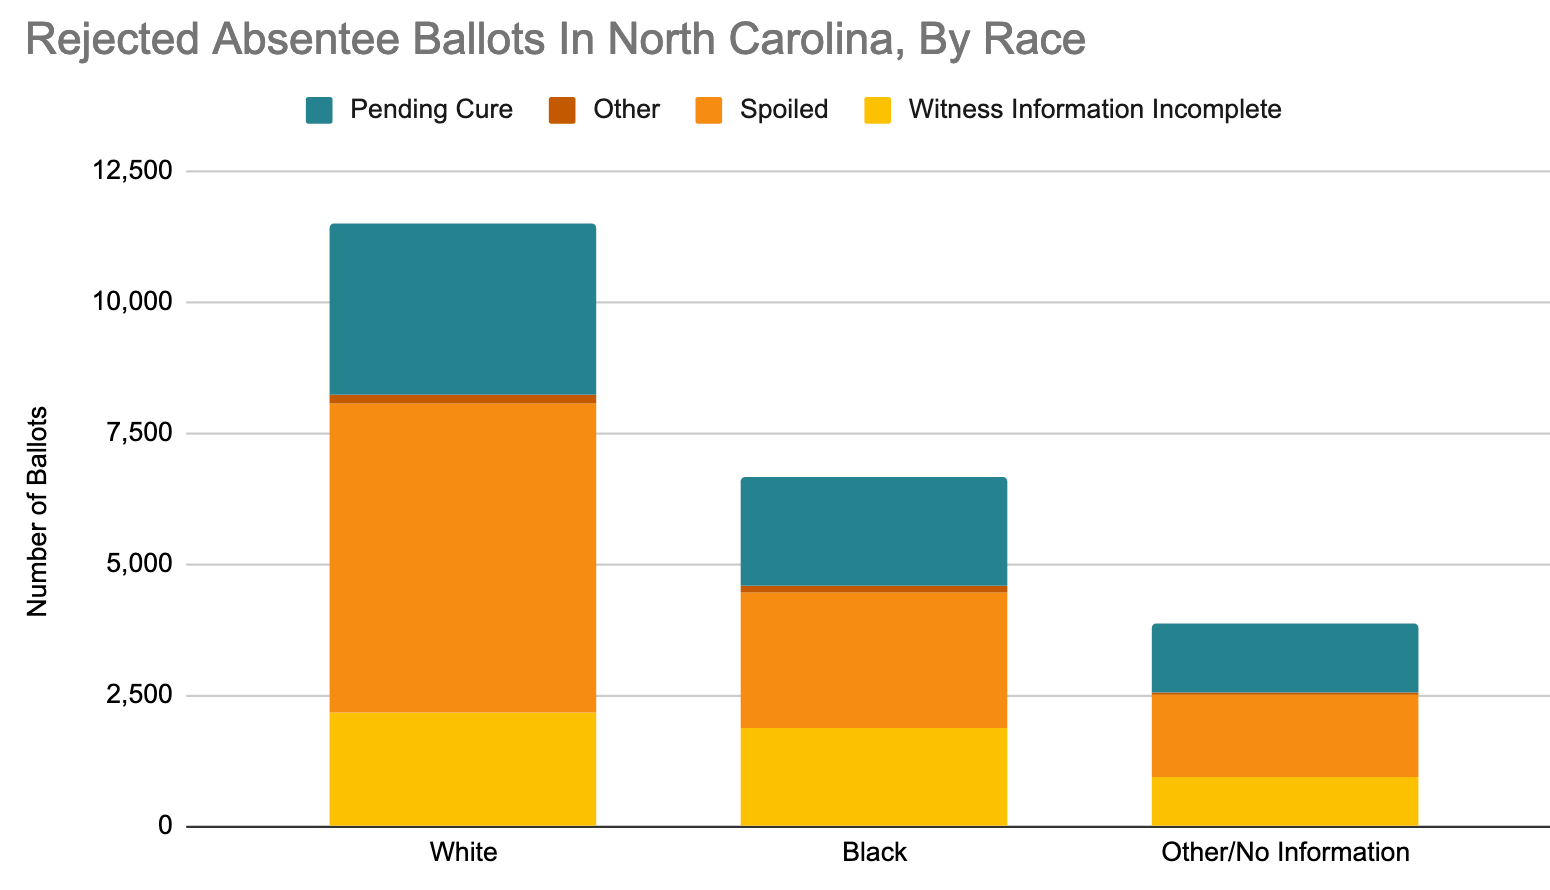 Table 1: Even after the cure process, Black voters absentee ballots are disproportionately rejected in North Carolina
| Race | Total Absentee Ballots Returned | Initially Accepted | Accepted after Cure Process | Rejected | Percent Rejected | Pending Cure | Percent rejected if all pending cure are accepted |
| White | 653,783 | 638,132 | 3,428 | 11,502 | 1.8% | 3,285 | 1.3% |
| Black | 147,095 | 139,100 | 1,098 | 6,647 | 4.5% | 2,080 | 3.1% |
| Other/No Information | 151,817 | 147,045 | 630 | 3,859 | 2.5% | 1,307 | 1.7% |
| All | 952,695 | 924,277 | 5,156 | 22,008 | 2.3% | 6,672 | 1.6% |
Rejected Ballots by Party
Democrats voted absentee in higher numbers than Republicans, so it is not surprising that there are more than 8,000 Democratic ballots still needing to be cured in order to be counted, and just 2,500 such Republican ballots. Even if all ballots in the cure queue get accepted, Democrats would still have 5,697 more rejected absentee votes than Republicans. Voters not registered with either party saw slightly lower rates of rejection: 1.9 percent for unaffiliated voters compared to 2.3 percent overall.
Chart 3: More Democratic ballots have been rejected than Republican.
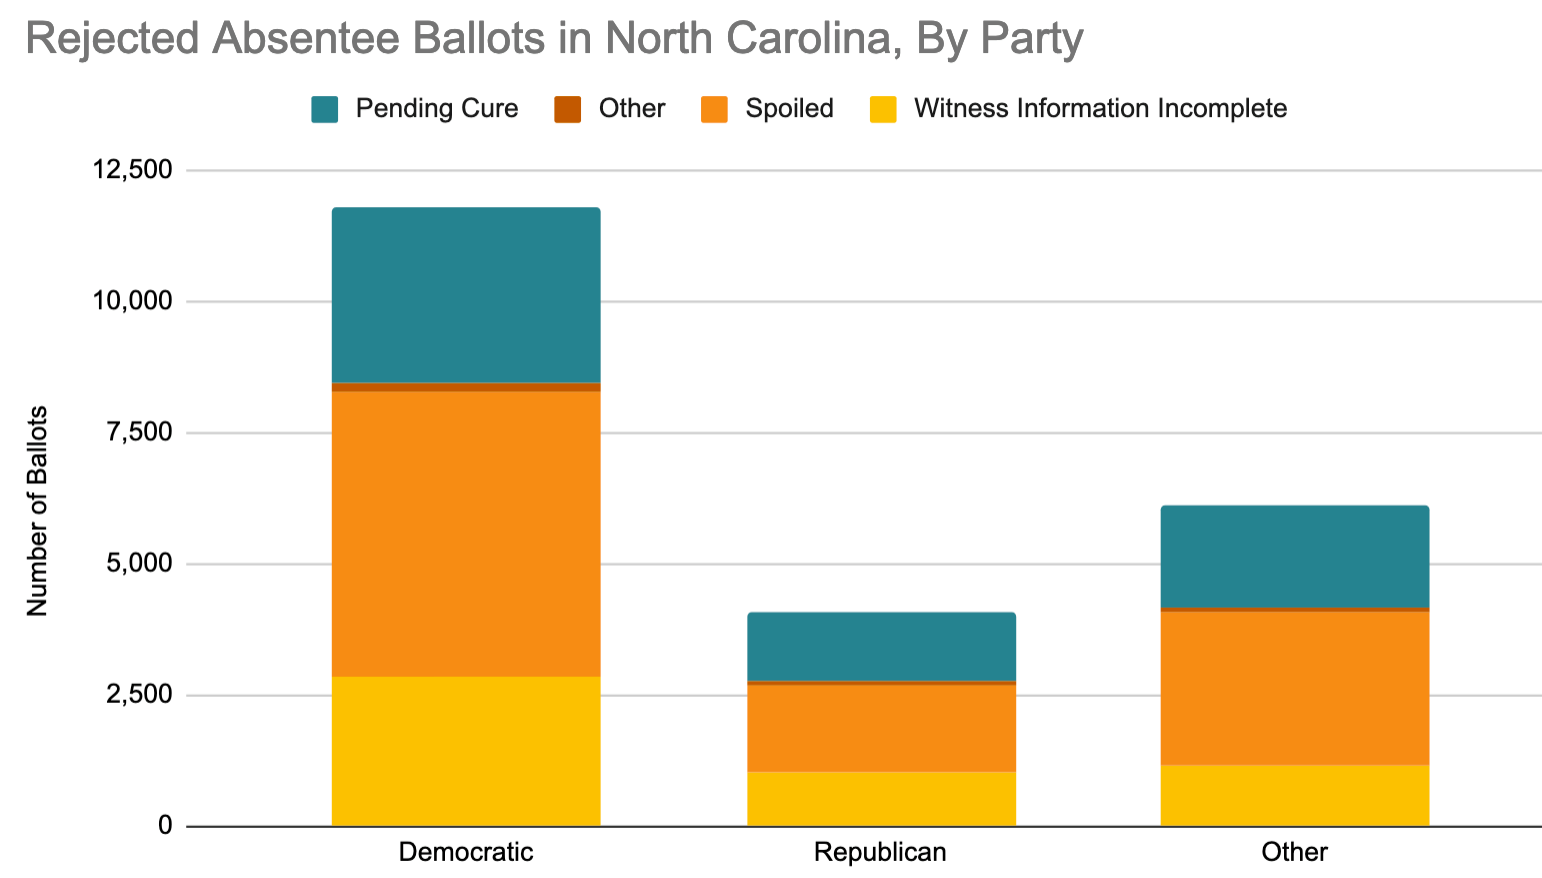 Table 2: The cure process does not alter the partisan gap in absentee ballot rejections.
| Party | Total Absentee Ballots Returned | Initially Accepted | Accepted after Cure Process | Rejected | Percent Rejected | Pending Cure | Percent rejected if all pending cure are accepted |
| Democratic | 433,353 | 418,631 | 2,354 | 11,795 | 2.7% | 3,349 | 2.0% |
| Republican | 193,821 | 188,230 | 1,281 | 4,094 | 2.1% | 1,345 | 1.4% |
| Other | 325,521 | 317,416 | 1,521 | 6,119 | 1.9% | 1,978 | 1.3% |
| All | 952,695 | 924,277 | 5,156 | 22,008 | 2.3% | 6,672 | 1.6% |
Rejected Ballots by County
Voters in some counties are determined to have their vote count. More than 90 percent of voters whose ballots were rejected in Union, Johnston, Davidson, and Nash Counties have either already gotten their ballot cured and accepted or started the process. More than half of the voters whose ballots were rejected in Guilford, Durham, Buncombe, Cabarrus, Almance, Catawba, Orange, Randolph, Brunswick, Rowan, Robeson, Wayne, Henderson, and Moore County have started the process to make sure their vote counts.
Forsyth, Onslow, and Robeson Counties are behind the ball — they haven’t accepted a single voter’s attempt to cure their rejected ballot. In Forsyth, Gaston, Onslow, Rockingham, and Burke Counties, fewer than 10 percent of rejected voters have attempted to cure their ballots. Perhaps those county election officials have not yet notified voters that their ballot was rejected but can be fixed.
Table 3: In some counties, most voters are making sure their vote is counted by pursuing the cure process.
| Pop.tion Rank | County | Total Absentee Ballots Returned | Accepted | Cured – Accepted | Rejected (including pending cure) | Percent Rejected | Pending Cure | Percent completed or in cure process |
| All | 952,695 | 924,277 | 5,156 | 22,008 | 2.3% | 6,672 | 44% | |
| 1 | WAKE | 170,437 | 165,948 | 362 | 3,789 | 2.2% | 804 | 28% |
| 2 | MECKLENBURG | 128,702 | 126,602 | 87 | 1,995 | 1.6% | 601 | 33% |
| 3 | GUILFORD | 48,114 | 45,605 | 26 | 2,327 | 4.9% | 1253 | 54% |
| 4 | FORSYTH | 41,227 | 39,863 | 0 | 1,129 | 2.8% | 98 | 9% |
| 5 | CUMBERLAND | 22,470 | 21,380 | 137 | 953 | 4.2% | 390 | 48% |
| 6 | DURHAM | 46,304 | 45,197 | 251 | 855 | 1.8% | 370 | 56% |
| 7 | BUNCOMBE | 35,367 | 34,024 | 306 | 917 | 2.6% | 455 | 62% |
| 8 | UNION | 18,804 | 18,307 | 224 | 220 | 1.2% | 195 | 94% |
| 9 | NEW HANOVER | 26,956 | 25,219 | 162 | 1,476 | 5.5% | 161 | 20% |
| 10 | GASTON | 15,843 | 15,349 | 10 | 433 | 2.7% | 11 | 5% |
| 11 | CABARRUS | 20,604 | 20,426 | 115 | 63 | 0.3% | 2 | 66% |
| 12 | JOHNSTON | 15,048 | 14,956 | 88 | 4 | 0.0% | 0 | 96% |
| 13 | ONSLOW | 8,889 | 8,747 | 0 | 142 | 1.6% | 10 | 7% |
| 14 | IREDELL | 16,566 | 16,509 | 14 | 43 | 0.3% | 0 | 25% |
| 15 | PITT | 10,723 | 10,246 | 77 | 398 | 3.7% | 62 | 29% |
| 16 | ALAMANCE | 14,262 | 14,002 | 118 | 142 | 1.0% | 17 | 52% |
| 17 | DAVIDSON | 11,115 | 10,826 | 73 | 216 | 1.9% | 193 | 92% |
| 18 | CATAWBA | 9,826 | 9,420 | 153 | 252 | 2.6% | 79 | 57% |
| 19 | ORANGE | 25,319 | 25,029 | 128 | 162 | 0.6% | 48 | 61% |
| 20 | RANDOLPH | 7,355 | 7,015 | 140 | 200 | 2.7% | 91 | 68% |
| 21 | BRUNSWICK | 18,234 | 17,271 | 312 | 651 | 3.6% | 213 | 55% |
| 22 | ROWAN | 9,876 | 9,619 | 138 | 119 | 1.2% | 21 | 62% |
| 23 | HARNETT | 8,424 | 8,141 | 49 | 221 | 2.6% | 55 | 39% |
| 24 | ROBESON | 3,452 | 3,143 | 0 | 308 | 8.9% | 217 | 70% |
| 25 | WAYNE | 6,739 | 6,449 | 115 | 170 | 2.5% | 43 | 55% |
| 26 | HENDERSON | 14,882 | 14,667 | 118 | 91 | 0.6% | 52 | 81% |
| 27 | CRAVEN | 8,885 | 8,485 | 115 | 267 | 3.0% | 49 | 43% |
| 28 | MOORE | 10,908 | 10,583 | 167 | 158 | 1.4% | 61 | 70% |
| 29 | CLEVELAND | 5,439 | 5,319 | 2 | 118 | 2.2% | 52 | 45% |
| 30 | NASH | 5,278 | 5,142 | 136 | 0 | 0.0% | 0 | 100% |
| 31 | ROCKINGHAM | 4,218 | 4,047 | 0 | 169 | 4.0% | 0 | 0% |
| 32 | BURKE | 5,089 | 4,924 | 1 | 155 | 3.1% | 0 | 1% |
| 33 | LINCOLN | 6,215 | 5,969 | 34 | 212 | 3.4% | 33 | 27% |
| 34 | CALDWELL | 4,773 | 4,557 | 78 | 129 | 2.7% | 23 | 49% |
| 35 | WILSON | 4,288 | 4,231 | 15 | 41 | 1.0% | 9 | 43% |
| 36 | CHATHAM | 12,051 | 11,930 | 18 | 103 | 0.9% | 15 | 27% |
| 37 | SURRY | 4,691 | 4,496 | 61 | 134 | 2.9% | 21 | 42% |
| 38 | FRANKLIN | 4,190 | 3,939 | 42 | 207 | 4.9% | 131 | 69% |
| 39 | CARTERET | 5,012 | 4,823 | 44 | 144 | 2.9% | 8 | 28% |
| 40 | WILKES | 4,237 | 4,100 | 94 | 43 | 1.0% | 14 | 79% |
| 41 | RUTHERFORD | 4,202 | 4,013 | 10 | 111 | 2.7% | 37 | 39% |
| 42 | SAMPSON | 1,783 | 1,780 | 0 | 3 | 0.2% | 1 | 33% |
| 43 | PENDER | 4,088 | 4,047 | 18 | 22 | 0.5% | 10 | 70% |
| 44 | STANLY | 3,461 | 3,286 | 62 | 110 | 3.2% | 31 | 54% |
| 45 | HAYWOOD | 5,990 | 5,900 | 61 | 29 | 0.5% | 15 | 84% |
| 46 | LEE | 4,006 | 3,843 | 51 | 111 | 2.8% | 41 | 57% |
| 47 | GRANVILLE | 4,083 | 3,880 | 72 | 130 | 3.2% | 59 | 65% |
| 48 | DUPLIN | 1,634 | 1,617 | 0 | 17 | 1.0% | 7 | 41% |
| 49 | WATAUGA | 5,003 | 4,853 | 11 | 139 | 2.8% | 5 | 11% |
| 50 | LENOIR | 2,997 | 2,858 | 54 | 84 | 2.8% | 51 | 76% |
| 51 | COLUMBUS | 1,892 | 1,779 | 0 | 110 | 5.8% | 41 | 37% |
| 52 | HOKE | 2,601 | 2,554 | 21 | 26 | 1.0% | 11 | 68% |
| 53 | EDGECOMBE | 2,068 | 2,066 | 0 | 2 | 0.1% | 0 | 0% |
| 54 | HALIFAX | 1,825 | 1,777 | 1 | 47 | 2.6% | 23 | 50% |
| 55 | BEAUFORT | 2,981 | 2,726 | 82 | 156 | 5.3% | 34 | 49% |
| 56 | MCDOWELL | 1,788 | 1,661 | 42 | 85 | 4.8% | 11 | 42% |
| 57 | STOKES | 2,488 | 2,419 | 36 | 33 | 1.3% | 23 | 86% |
| 58 | RICHMOND | 1,778 | 1,665 | 31 | 82 | 4.6% | 21 | 46% |
| 59 | VANCE | 2,501 | 2,300 | 64 | 137 | 5.5% | 51 | 57% |
| 60 | JACKSON | 2,848 | 2,676 | 20 | 152 | 5.3% | 12 | 19% |
| 61 | DAVIE | 3,008 | 2,939 | 23 | 46 | 1.5% | 9 | 46% |
| 62 | PASQUOTANK | 2,416 | 2,291 | 4 | 121 | 5.0% | 42 | 37% |
| 63 | PERSON | 2,275 | 2,195 | 22 | 58 | 2.5% | 14 | 45% |
| 64 | YADKIN | 2,083 | 1,984 | 45 | 54 | 2.6% | 15 | 61% |
| 65 | ALEXANDER | 1,780 | 1,685 | 31 | 64 | 3.6% | 12 | 45% |
| 66 | DARE | 3,624 | 3,570 | 13 | 41 | 1.1% | 17 | 56% |
| 67 | MACON | 1,926 | 1,924 | 1 | 0 | 0.0% | 0 | 100% |
| 68 | SCOTLAND | 1,553 | 1,467 | 37 | 49 | 3.2% | 12 | 57% |
| 69 | TRANSYLVANIA | 3,870 | 3,789 | 21 | 60 | 1.6% | 7 | 35% |
| 70 | BLADEN | 1,257 | 1,191 | 15 | 51 | 4.1% | 1 | 24% |
| 71 | CHEROKEE | 1,981 | 1,960 | 21 | 0 | 0.0% | 0 | 100% |
| 72 | CURRITUCK | 1,250 | 1,239 | 9 | 2 | 0.2% | 0 | 82% |
| 73 | ASHE | 1,932 | 1,931 | 0 | 1 | 0.1% | 0 | 0% |
| 74 | MONTGOMERY | 1,014 | 989 | 11 | 14 | 1.4% | 4 | 60% |
| 75 | ANSON | 779 | 753 | 0 | 26 | 3.3% | 0 | 0% |
| 76 | HERTFORD | 16 | 13 | 0 | 3 | 18.8% | 0 | 0% |
| 77 | CASWELL | 1,339 | 1,205 | 59 | 73 | 5.5% | 13 | 55% |
| 78 | MARTIN | 1,173 | 1,071 | 16 | 84 | 7.2% | 36 | 52% |
| 79 | MADISON | 1,680 | 1,634 | 19 | 27 | 1.6% | 9 | 61% |
| 80 | GREENE | 906 | 840 | 19 | 46 | 5.1% | 8 | 42% |
| 81 | POLK | 2,568 | 2,465 | 32 | 70 | 2.7% | 9 | 40% |
| 82 | WARREN | 1,316 | 1,268 | 10 | 34 | 2.6% | 3 | 30% |
| 83 | NORTHAMPTON | 978 | 899 | 21 | 55 | 5.6% | 18 | 51% |
| 84 | BERTIE | 776 | 694 | 1 | 81 | 10.4% | 41 | 51% |
| 85 | YANCEY | 1,555 | 1,494 | 6 | 54 | 3.5% | 18 | 40% |
| 86 | AVERY | 889 | 839 | 23 | 27 | 3.0% | 14 | 74% |
| 87 | MITCHELL | 993 | 974 | 12 | 7 | 0.7% | 5 | 89% |
| 88 | SWAIN | 341 | 336 | 2 | 3 | 0.9% | 2 | 80% |
| 89 | CHOWAN | 798 | 769 | 7 | 21 | 2.6% | 2 | 32% |
| 90 | PERQUIMANS | 533 | 533 | 0 | 0 | 0.0% | 0 | NA |
| 91 | PAMLICO | 1,044 | 1,040 | 0 | 4 | 0.4% | 3 | 75% |
| 92 | WASHINGTON | 641 | 633 | 5 | 3 | 0.5% | 0 | 63% |
| 93 | GATES | 556 | 539 | 0 | 17 | 3.1% | 1 | 6% |
| 94 | CLAY | 754 | 717 | 14 | 21 | 2.8% | 6 | 57% |
| 95 | ALLEGHANY | 727 | 710 | 6 | 11 | 1.5% | 2 | 47% |
| 96 | CAMDEN | 493 | 474 | 0 | 19 | 3.9% | 2 | 11% |
| 97 | JONES | 398 | 395 | 1 | 2 | 0.5% | 0 | 33% |
| 98 | GRAHAM | 356 | 348 | 0 | 8 | 2.2% | 2 | 25% |
| 99 | HYDE | 211 | 201 | 4 | 6 | 2.8% | 4 | 80% |
| 100 | TYRRELL | 77 | 74 | 0 | 3 | 3.9% | 0 | 0% |
