This article is part of the series Fairer Elections in Portland
Takeaways
The city’s winner-take-all elections lock certain voters out of political power.
Whiter and more Democratic areas repeatedly elect preferred candidates, while areas with racially diverse and nonaffiliated voters go underrepresented.
When voters east of 82nd Avenue support candidates that close-in neighborhoods dislike, they are almost always outvoted.
Creating districts might seem like a solution to better representation, but it is not.
As Sightline wrote in 2017, the vast majority of Portland’s councilmembers have been white men and have come from the close-in east side or west of the Willamette—areas where residents are far more likely to have a higher income and own (rather than rent) their homes. But now, in 2021, three out of five city commissioners identify as people of color (Jo Ann Hardesty, Carmen Rubio, and Mingus Mapps) and only two out of five identify as white men (Ted Wheeler and Dan Ryan). Some Portlanders may feel the lack of representation for Portlanders of color has been “solved.”
Not so fast.
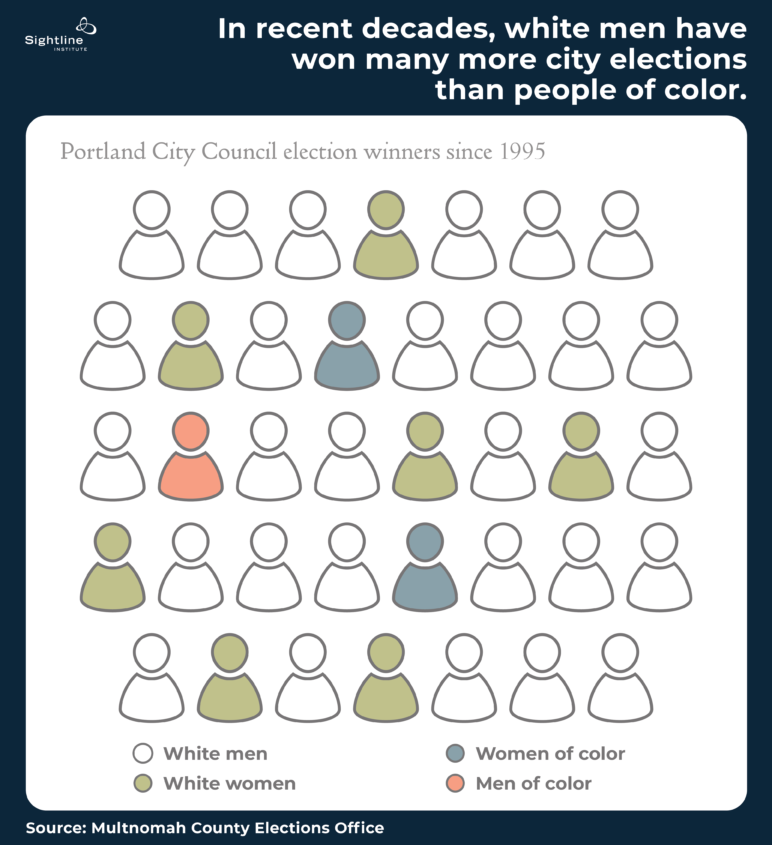
Certainly, the current racial and ethnic diversity on the council is an important improvement over the past. Black and Latinx Portlanders can now see someone who looks like them in City Hall – what political scientists call “descriptive representation” — and that boosts the council’s legitimacy because the body appears to represent Portlanders. But the system that elected just two people of color in the century from 1913 to 2013 did not get fixed overnight. We don’t have to look into ancient history to see how our system has failed to elect representative councils. Looking back just to 1995, we see that white men won more than three-quarters of council elections compared to fewer than 10 percent won by people of color.
That’s because Portland’s winner-take-all system allows 51 percent of voters to get 100 percent of the representation and Portlanders in the minority to get zero representation.
While some Portlanders of color are seeing more people who look like them on council, this doesn’t necessarily mean that all voters are able to elect their preferred candidates. Because Portland uses a winner-take-all system – one candidate wins the whole enchilada in every race – voters in any minority group (whether that be people of color, renters, young people, small business owners, etc.) cannot elect a candidate of their choice unless their favorite candidate is also acceptable to the majority group (white people, homeowners, older voters, etc.). How has this played out in reality in Portland? Data from recent elections suggest that voters in white neighborhoods often see their candidate of choice preside in city hall, but voters in communities of color usually don’t.
We can’t track individual voters across different city elections to see how many individuals succeed in electing someone, but we can look at votes at the precinct level (most precincts have between 2,000 and 7,000 voters) and analyze race and party affiliation by precinct. Some precincts are much more successful than others in consistently electing someone that most voters in that precinct prefer. In general, precincts with more voters who are white or Democratic tend to see many of their preferred candidates on council, while precincts with more voters who are people of color or nonaffiliated tend to be less enthusiastic about the occupants of city hall.
Relative preferences
In many city races, the incumbent wins by overwhelming margins, including a majority of votes in every precinct. That doesn’t necessarily tell us that a majority of voters in every precinct got the person they wanted on council, but rather that voters didn’t have a lot of options. To try to parse how successful voters in various precincts were at getting their preferred candidates elected, we compared each precinct to the city at large. If a precinct preferred the winning candidate more than the entire city, we counted it as a win for those voters, but if they preferred the winner less than the entire city, we counted it as those voters not getting their preference. For example, a precinct that voted 55 percent for Amanda Fritz in 2016 preferred her 14 percentage points less than the city as a whole, because she received 69 percent of the vote citywide.
The pattern across recent elections
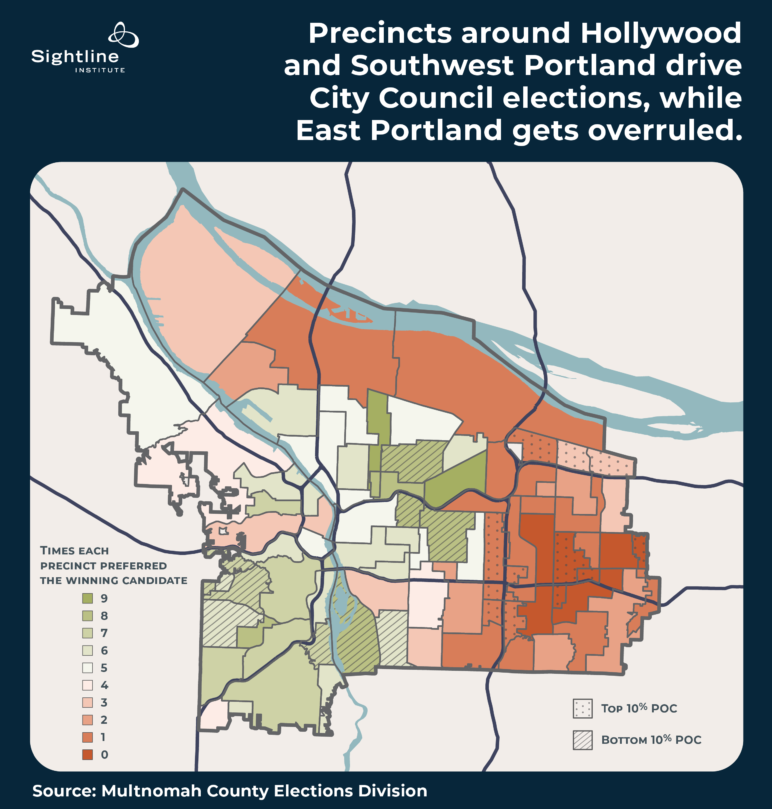
When we look at the nine City Council and mayoral elections from 2016 to 2020—those won by Amanda Fritz, Ted Wheeler, Chloe Eudaly, Nick Fish, Jo Ann Hardesty, Carmen Rubio, Dan Ryan, Mingus Mapps, and Ted Wheeler again—a clear pattern emerges. The map below adds up the recent elections and colors the precincts that got their preferred candidate 9 out of 9 times as dark green, and those that never got their preferred candidate as dark red. The dark green precincts around the Northeast neighborhoods Rose City Park, Roseway, Sabin, Vernon, and Woodlawn preferred the ultimate winner every time. But the red precincts in the further-out Southeast quadrant (around Centennial, Mill Park, and Powellhurst-Gilbert) never preferred the winner.
Note that in this and the below maps, we’ve removed Precinct 4902 due to insufficient data. This precinct is an industrial zone in far Northeast Portland between the Columbia River and the Union Pacific railroad tracks and is home to only 30 registered voters.
The pattern varies slightly for individual candidates
Of course, none of this is to say that specific candidates don’t have an impact on election results. For example, in the maps below, we see that Chloe Eudaly, generally hailed as a champion for renters, won election over incumbent Steve Novick despite being disfavored by Portlanders west of the Willamette and in the areas around Grant Park and Laurelhurst. Jo Ann Hardesty, former state representative for a North Portland district, slightly underperformed on the west side and was disliked much more east of Interstate 205.
Amanda Fritz, Ted Wheeler, Nick Fish, Carmen Rubio, and Dan Ryan hew closely to the overall pattern, winning support in Southwest and close-in Northeast neighborhoods but not in far Southeast neighborhoods. Mingus Mapps stretches the mold somewhat, receiving mixed support in far East Portland but the same core support in Southwest Portland and the east side precincts around Hollywood.
Portland City Council Election Winners


Voters of color are less likely to elect a councilor than are white voters
It’s easy to prioritize location while looking at so many election maps, but Portlanders have myriad political priorities beyond just where they live. Data categorized by precinct, however, means that we can only look at election results in terms of the physical locations of voters. Despite this limitation, we can still learn other things about voters’ behavior and success based on where they live! East Portland, for example, is home to markedly more people of color and school-age children than the area west of 82nd Avenue is.
With this in mind, we can look at data from the 2020 Census to see which precincts have more or fewer people of color (POC). The summary map above shows that the ten precincts with the most people of color are consistently underrepresented in elections, while the ten most white precincts are in electorally successful areas around Southwest Portland and Hollywood. In the graph below, each dot represents one of Portland’s 81 election precincts. The dots’ horizontal positions represent how many adults in the precinct are people of color – further to the right are more diverse precincts, while to the left are whiter areas. Their vertical positions show the precincts’ relative preferences for winning city council candidates compared to the city at large (as we detailed above), averaged across all nine recent elections.
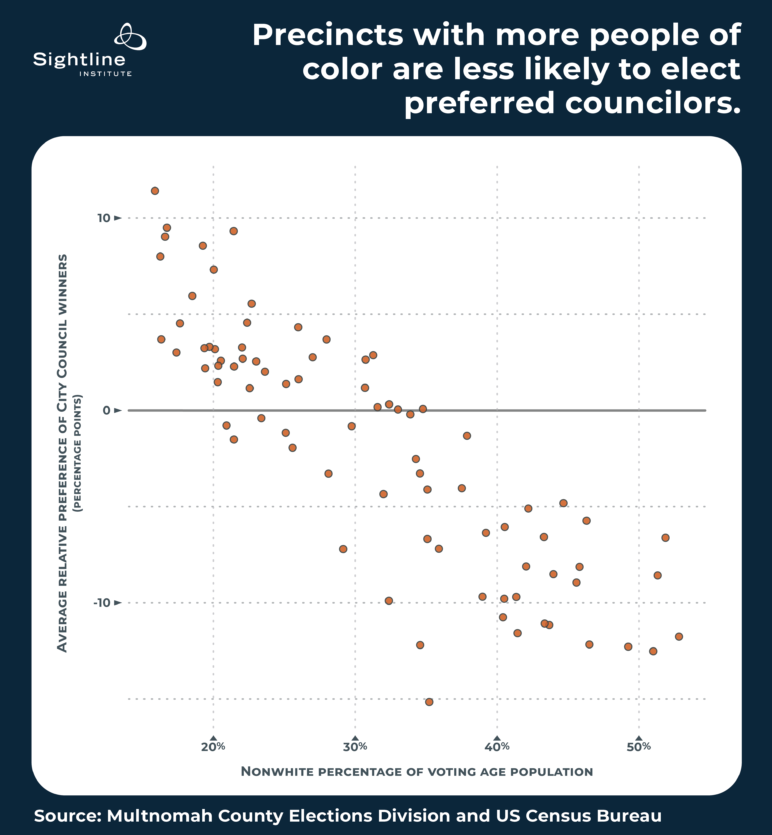
The pattern here is clear: whiter precincts are more likely to elect their preferred candidates to office, while more racially diverse precincts perennially prefer elected councilors less than the rest of the city does.
Voters affiliated with the Democratic Party are more likely to elect councilors than are unaffiliated voters
Similar to how precincts with more white adults consistently elect their preferred candidates, there is a partisan effect on voter success across the city. While Portland does have nonpartisan elections for council, the precincts with more registered Democrats are the same precincts that perennially elect favored candidates. But precincts where more voters are not affiliated with a party are most often unable to put a preferred representative onto council. Portlanders registered with the Republican Party or any minor parties are less successful at electing councilors of choice than are Democrats, but they are more successful than unaffiliated voters.
Districts aren’t the answer
It might be tempting to think we could just draw districts and solve the problem – those dark red neighborhoods will be guaranteed a district representative. Unfortunately, the geographic pattern is not so simple that geographic districts have all the answers. For example, the winning Roseway neighborhood would likely get drawn into a district with Madison South, where voters almost never get their way. Put them together, and maybe the Roseway voters continue to outvote the Madison South voters, where gobs of voters still wouldn’t see a preferred candidate ever make it on to council. Even within a single neighborhood, voters have a diverse set of opinions on which candidates are best to serve the city.
Multi-winner proportional voting
Not all cities lock minority voters out of representation the way Portland does. In many places across the United States, almost every voter has the power to put someone they prefer on their local council or board. That’s right: there are places in the United States where two-thirds or more of voters can look at their local council and see at least one person they personally voted for. These places use multi-winner proportional voting. We’ll tell their stories in our next article.
