This article is part of the series Transitioning From Puget Sound Oil Refineries
Takeaways
The five refineries make about $2 billion per year in profit. They paid between 12 and 16 percent of that in taxes from 2017–2019.
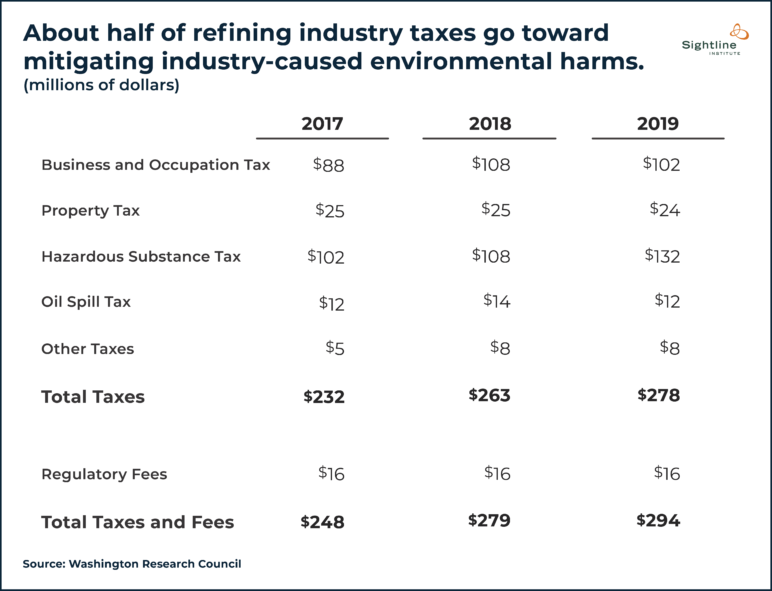
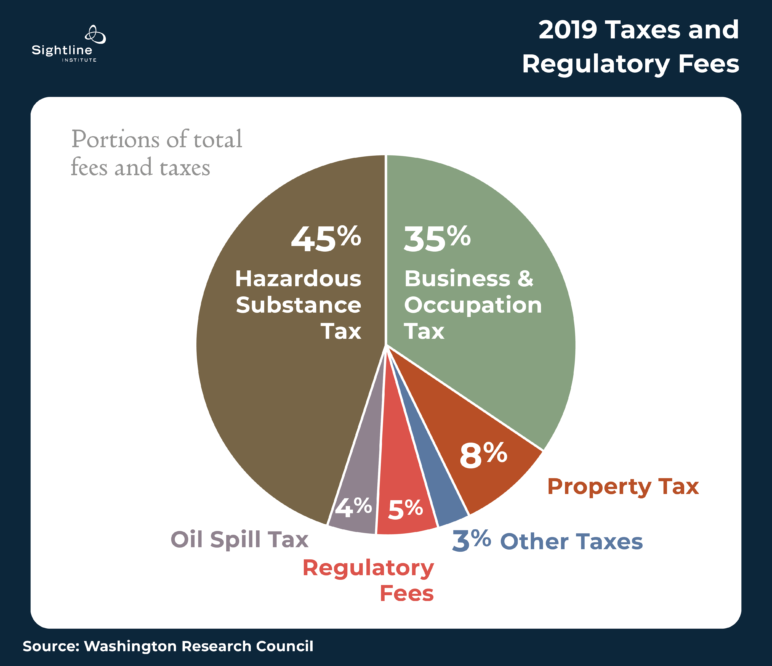
Notably, however, roughly half of refinery taxes go toward mitigation of industry-caused environmental harms, primarily via the Hazardous Substance Tax and the Oil Spill Tax.
Of 52 industries identified by the Washington Department of Commerce, refining produces the lowest number of jobs per million dollars of economic output.
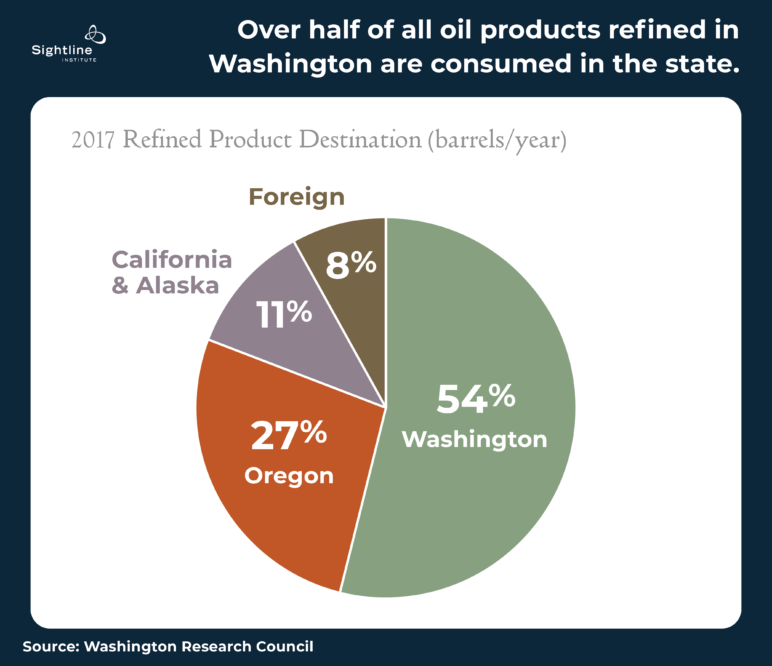
Just over 50 percent of refined products are consumed in Washington, with just under 30 percent consumed in Oregon. About 10 percent are consumed in California and Alaska, and about 10 percent are exported, mostly to Canada and Mexico.
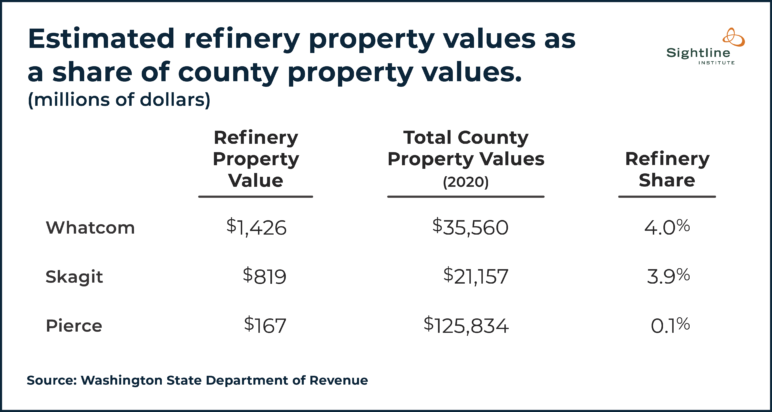
Refineries account for 4 percent of taxable property values in both Whatcom and Skagit counties, between 1 and 2 percent of total county revenue.
Depending on how you look at it, the oil refining sector is either a major contributor to the Northwest economy or a giant vortex that steals the region’s money. Historically, it has been a giant profit machine, but now may be an industry in terminal decline.
In this chapter, we will describe the major economic impacts of oil refining in Washington, along with a look at the sector’s contribution to government budgets. But first, it’s worth sharing a few brief notes on our sources and calculations.
The dollar amounts we use should be viewed as ballpark figures because revenues, expenditures, and taxes vary considerably from year to year as the price of oil rises and falls. Our analysis in this chapter relies heavily on the 2018 and 2021 economic impact reports published by the Washington Research Council. (WRC is funded in part by the oil industry, and it uses self-reported data from refiners, but the numbers can be independently verified and are rigorously sourced.) Our other primary sources include a limited number of publicly-available tax records, which we believe are accurate but not comprehensive, and these roughly corroborate WRC’s findings. Our intention with this chapter is to provide an overview, not a precise accounting.
The coming decades will bring increasingly volatile oil markets as well as promising boosts in energy efficiency, vehicle electrification, and a shift to cheaper clean energy. As demand for oil drops, Puget Sound refinery communities can plan ahead for a smooth transition—protecting workers, local economies, and the environment to build a thriving and resilient future. This article is part of a special series on the issue.
he Northwest has no crude oil, meaning the region must import all of the crude oil that it refines and uses. Supporting that oil habit is expensive. Sightline found that Cascadia spent $19.2 billion in 2006 in order to import petroleum and natural gas—$10.9 billion in Washington; $6.1 billion in Oregon; and $2.2 billion in Idaho. On a per capita basis, that worked out to an average of $1,660 (though the figure also includes spending by industry, government, and businesses, as well as household and personal spending). And while the Northwest is spending, the oil refineries are raking it in, netting as much as $2 billion in profit each year.
Industry boosters are quick to point out that oil refining operations support thousands of jobs. This is true to an extent. As we will cover in detail in our next chapter, which focuses on labor, the refining industry in Washington supports about 25,000 jobs. That’s a lot. But when Washington’s Office of Financial Management (OFM) assessed industries for their job-creation potential, oil refining ranked dead last. Of the 52 industries identified in the 2012 OFM Input-Output report, the refining industry produces the lowest number of jobs per million dollars of economic output. In other words, spending money on literally any other activity would result in more jobs in Washington than spending money on refinery products. That’s true even on the more generous accounting of “indirect” and “induced” employment multipliers: for job growth, it’s still the worst return on investment of any of the 51 other industries studied in the report.1
Those findings are similar to the findings from economists at the Political Economy Research Institute at the University of Massachusetts-Amherst. Their studies show that spending on oil and gas infrastructure returns fewer jobs than any other industry but one (nuclear power) and far less than most common-sense projects like repairing roads and bridges, building schools, or fixing water systems.
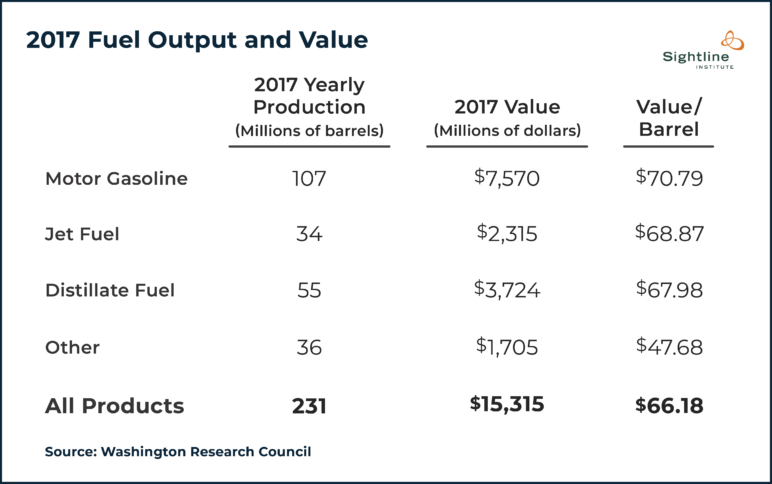
Still, the refiners themselves are making money. Although none of them are based in the Northwest—their headquarters are in places like Houston, London, and The Hague—they profit handsomely from Cascadia’s voracious appetite for petroleum fuels. In 2017, for example, the five refineries extracted a combined $2.1 billion in profit, according to the Washington Research Council.2 In that year, crude oil prices were between $50 and $60 per barrel, roughly what they are now, and the refineries brought in $15.3 billion in gross receipts on $13.2 billion in expenses (not including capital expenses).
Petroleum refined in Washington State is largely consumed in the Pacific Northwest. Sightline calculates that 54 percent is consumed in Washington, 27 percent is consumed in Oregon, 11 percent is consumed in Alaska and California, and eight percent is consumed in foreign markets, primarily Canada and Mexico. (For the details of how these figures were calculated, see the methodology section at the end of this piece.)
The refining industry clearly benefits from doing business in Washington. Yet it pays a relatively small sum in state and local taxes. At first glance, it might seem like the industry is paying an effective tax rate of between 12 and 16 percent on its billions of dollars of profit. Yet, as will be shown below, around half of those tax payments actually go toward mitigating environmental harms perpetuated by the industry. A closer analysis shows that the effective tax rate for Washington’s refining industry is between five and seven percent.
According to the Washington Research Council, the refining industry paid a total of $231 million in taxes and $16.6 million in regulatory fees in 2017 for a total of $248 million and an effective tax rate of 12 percent on $2.1 billion in profit. In 2018, the effective tax rate was 14 percent on $2 billion in profit, and in 2019 the effective tax rate was 16 percent on $1.8 billion in profit.
These numbers overstate the industry’s contribution to public coffers because much of the revenue is earmarked for specific functions and programs that are designed to clean up after the oil industry itself. One example is the Hazardous Substance Tax, which funds the Toxics Cleanup Program under the Model Toxics Control Act. Through the Toxics Cleanup Program, the Washington State Department of Ecology identifies, investigates, cleans, and monitors toxic spills and their aftermath, such as the nearly catastrophic December 2020 oil train derailment near Custer.
The Hazardous Substance Tax was amended in 2019 from a 0.7 percent tax on the wholesale value of refined products to a flat rate of $1.07 per barrel, which is expected to significantly increase the revenue collected. (The $1.07 per barrel rate is adjusted with inflation and is $1.14 as of July 1, 2021.) In 2017, Washington refineries produced 231 million barrels of refined product and paid about $100 million in Hazardous Substance Tax.3 Under the new flat rate, the refineries would pay nearly $250 million on the same amount of refined product.
Similarly, regulatory fees are used to fund programs that monitor industry. For example, Washington law requires refineries to be issued permits prior to releasing wastewater. The Department of Ecology collects fees in order to pay for monitoring and evaluating compliance with permits, conducting inspections, and supporting overhead programmatic expenses. These regulatory costs on refiners can hardly be considered a public benefit since they mostly just mitigate the industry’s harm to our shared resources.
Only the Business & Occupation (B&O) and property taxes are general fund taxes that truly benefit the public. Yet according to the WRC, these two taxes only generated about $113 million in revenue in 2017, an effective tax rate of just 5.3 percent on $2.1 billion in profit. In 2018 and 2019, the effective tax rate on B&O and property taxes was 6.6 and 7.0 percent, respectively.
However, the publicly-available data is imprecise. In a typical year like 2017, with gross receipts of $15 billion, refiners would pay at least $72 million per year in B&O taxes, because the tax in Washington is based on gross receipts and is set at 0.484% of gross receipts. Yet the WRC report states that the industry paid $87.5 million in B&O tax. Statewide, the B&O tax brought in $4.2 billion in 2018 and $4.4 billion in 2019, meaning the refining sector likely accounts for between 1.6 and 2.1 percent of total B&O tax revenue in a typical year.
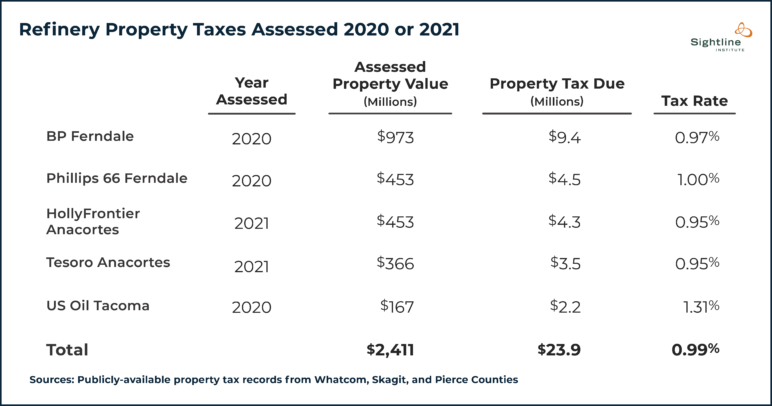
Property taxes net the public another $24.8 million, according to the Washington Research Council, and they are a primary means for local governments to raise revenue. To better understand these contributions, Sightline analyzed property records for each of the counties that is home to a refinery: Pierce, Skagit, and Whatcom Counties. Assuming they did not find tax loopholes, the refineries paid $23.9 million in property tax in 2020.4
Although refineries pay only around one percent of their assessed property value in taxes each year, those payments amount5 to about four percent of total assessed property values in Whatcom County and 3.9 percent in Skagit County. Like other properties, the refineries are located in multiple property tax districts, such as school or fire districts, and their importance for property tax collections is likely greater in some of these smaller districts. The US Oil refinery in Tacoma is much less important to overall property tax in Pierce County, accounting for only 0.1 percent of total property values countywide.
Whatcom County collected just over $30 million in property tax in 2020, accounting for a third of its $92 million of revenue.6 Assuming the Whatcom refineries pay the average rate of property tax, they would account for $1.2 million of Whatcom County’s revenue, about 1.3 percent.
Skagit County collected almost $27 million in property tax in 2020, accounting for nearly half of its $57 million of revenue.7 Assuming the Skagit refineries pay the average rate of property tax, they would account for $1.04 million of Skagit County’s revenue, about 1.8 percent.
In total, Washington State collected $25.7 billion in tax revenue in 2019. If all $278 million of the industry’s 2019 tax payments went to the state of Washington (a significant portion of the property tax went to local and county jurisdictions), the industry would account for about one percent of statewide tax revenue.
But as explained earlier, around half of that tax payment is to mitigate environmental issues caused by the industry itself. The real tax benefit to Washington State in 2019 was $125 million from the industry’s B&O tax and property tax payments. This accounts for just one half of one percent of statewide tax revenue, and it is an effective state tax rate of just seven percent on its $1.8 billion of 2019 profits. To put this in perspective, the lowest 20 percent of wage earners in Washington State pay 17.8 percent of their income in state taxes.
If the refineries go out of business, state and county coffers would lose this tax revenue. And, there is reason to think that the value of the refining properties is already declining. HollyFrontier purchased its Anacortes refinery from Shell in May 2021 for $350 million, plus the value of the refinery’s inventory of crude oil—a full $100 million below the site’s assessed value. So planning for a post-refinery future is imperative for the state and the counties that currently depend on refinery tax payments. Perhaps the value of property near the refineries will increase as the air, water, and land heal. Or perhaps new renewable energy projects, a necessary complement to refinery phaseouts, could provide an opportunity for new revenue streams.
In the next chapter, we dive into the impact of the refining industry on employment, and how the transition might impact the people who work at and live near the refineries.
This article benefited from past research by Clark Williams-Derry.
Methodology
In 2017, the refineries produced 611,900 barrels per day, about 94 percent of their combined 657,000 capacity. According to the WRC, yearly production in 2017 was 222.5 million barrels. Over half (54.4 percent or 121 million barrels) of refined products produced at Washington refineries were consumed in the state. Determining the breakdown of the remaining 45.6 percent of output requires piecing together different sources. Washington Department of Commerce estimates Washington refineries supply about 90 percent of Oregon’s petroleum needs.8 Assuming this to be true, Washington refineries delivered about 59 million barrels of Oregon’s 65.8 million barrels of consumption in 2017, about 27 percent of Washington’s total output.9 Altogether, the WRC data indicates about 19 percent (42 million barrels) of refined products from Washington end up outside Washington and Oregon. About 25 million barrels go to California and Alaska, although the WRC report does not distinguish between the two. Finally, according to the WRC, foreign markets were the destination of 17 million barrels, less than 10 percent of the volume and about 12 percent of the value of refined products made in Washington refineries in 2017. Of foreign exports in 2017, Canada accounted for around 50 percent, Mexico just under 25 percent, and all other countries made up the last 25 percent.
Product destination varies year to year. A 2015 Energy Information Administration report estimates about 15 percent of the refined product by volume was shipped outside of Washington and Oregon.10 And the WRC’s 2021 report states that in 2019 foreign markets were the destination for 7.3 percent of refined product.11 While the WRC and EIA data are not identical, they are similar. Because output, consumption, and regional demand vary from year to year, this is a reasonable estimate of how much refined petroleum from Washington goes where.
