
In early October, we analyzed absentee ballot returns in North Carolina and found that the state was rejecting nearly three times as many absentee ballots from Black voters as from white voters. This was mostly due to the state’s unnecessary witness requirement—a rule that absentee voters get a witness’s name, address, and signature on their ballot’s return envelope. In our analysis of returns as of October 26, we discovered that the gap has narrowed slightly, but North Carolina is still rejecting more than twice as many absentee ballots from Black voters as from white voters (5.5 percent compared to 2.4 percent).
Because North Carolina provides uniquely detailed data on voters, including race, party, and reasons for ballot rejection, we were able to find some interesting patterns at the county level.
The state’s absentee ballot rejection data shows that rejection rates vary significantly depending on the county handling the ballots. Some counties’ ballot rejection rates fall within an acceptable range, while many reject an unacceptably high number of legitimate voters, and most counties disenfranchise Black absentee voters at higher rates than they do white absentee voters. It’s an example of systemic racism. That is, regardless of intent, the processes have the effect of depriving more Black voters their right to vote than they do white voters. Some counties have worked to overcome systemic racial bias through massive voter education efforts to help voters navigate the barriers the state has thrown in their path.
North Carolina’s rejection rate of 2.4 percent for white voters’ absentee ballots is already well above the national average, but its rejection rate of 5.5 percent for Black voters’ ballots is alarmingly high.

North Carolina’s high absentee ballot rejection rate
Through October 26, North Carolina has rejected 3 percent of all absentee ballots. In contrast, in 2016 all states rejected just 1 percent of the 33.4 million absentee ballots. Experienced Vote By Mail states like Washington and Oregon rejected just 0.7 percent of ballots that year, and Oregon rejected just 0.1 percent in 2018.
North Carolina’s rejection rate of 2.4 percent for white voters’ absentee ballots is already well above the national average, but its rejection rate of 5.5 percent for Black voters’ ballots is alarmingly high.
Ballot rejection rates vary by county
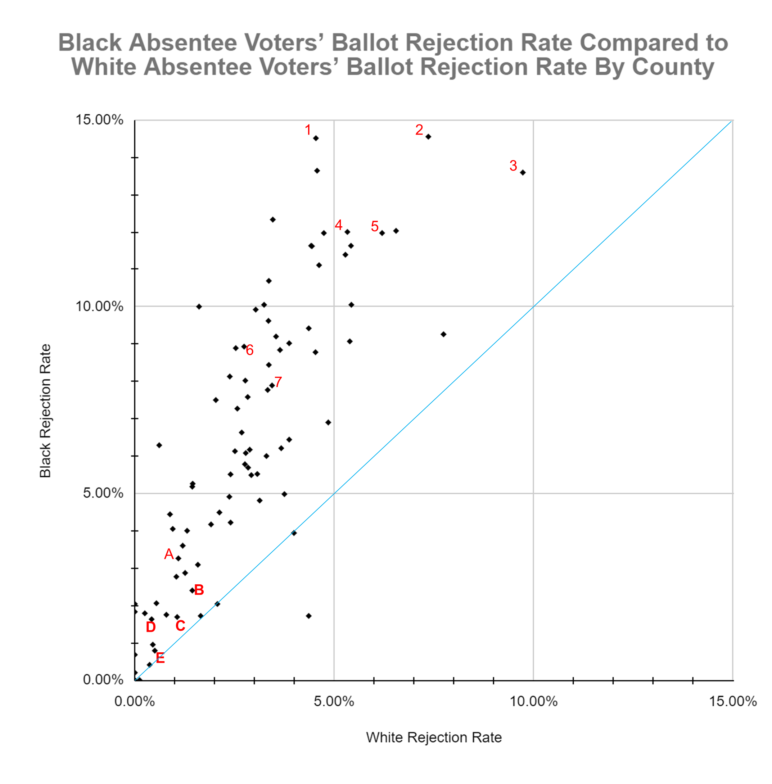
Almost all counties in North Carolina reject ballots from Black voters at higher rates than they do ballots from white voters. In the scatterplot below, each dot represents one county. The x-axis shows each county’s rejection rate for white voters’ absentee ballots, and the y-axis shows its rejection rate for Black voters’ absentee ballots. The blue line shows where counties would be if their rejection rates were exactly the same for both Black and white voters. Almost all the dots are above the blue line, meaning that almost all counties are rejecting Black voters’ ballots more often than they reject white voters’ ballots. (Note: We removed 15 counties that received ballots from fewer than 30 Black voters, since the sample size was not big enough to be included.)
While no county rejects more than 10 percent of ballots from white voters, 21 counties have rejected more than 10 percent of ballots from Black voters—notably New Hanover (12 percent), Robeson (12 percent), Franklin (11.6 percent), Beaufort (14.6 percent), Vance (11.4 percent), and Martin (14.5 percent).
Other counties have relatively low rejection rates as well as lower disparity between the rejection rates of Black voters’ ballots and those of white voters, including Mecklenburg (3.3 percent for Black voters and 1.1 percent for white voters), Union (1.7 percent and 1.1 percent), Iredell (1.6 percent and 0.4 percent), and Henderson (2.4 percent and 1.4 percent).
Only a handful of counties have racially balanced rejection rates. Wilson, Nash, Haywood, and Lincoln Counties are right on the blue line, while Polk is the only county that has rejected white voters’ absentee ballots at a higher rate than those of Black voters.
Almost all North Carolina counties reject the ballots of Black absentee voters at higher rates than those of white voters.
There are only six counties that reject less than 1 percent of ballots from both white and Black voters. Cabarrus is the largest county with such a low rejection rate. The disparity between some counties with such high ballot rejection rates for Black voters and others being a little more balanced yields some interesting results. For example, Pitt and Cabarrus Counties have received about the same number of absentee ballots from Black voters, yet Pitt has rejected nearly an order of magnitude more Black ballots (266, to Cabarrus’s 21). Mecklenburg County is twice the size of Guilford and has received more than twice as many absentee ballots from Black voters, yet Guilford has rejected more Black voters’ ballots than Mecklenburg (762 compared to 671).
Graph 1: Almost all North Carolina counties reject the ballots of Black absentee voters at higher rates than those of white voters.
Counties’ variable voter education efforts
Wake County spokesperson Stacy Beard believes that Wake County had a lower rejection rate because of its educational outreach and media presence, since most North Carolina news outlets are based in Raleigh, which is in Wake County. “We’ve spent a lot of time trying to educate the voters of Wake County on how to properly fill out an absentee ballot,” Beard said.
Voter education is key because voting by mail is new to most North Carolina voters, and particularly to Black voters, who have historically preferred to vote in person. Many voters may not be familiar with all the requirements of the absentee process. A history of voting records showed that most voters whose absentee ballots have been rejected so far voted in person in 2016.
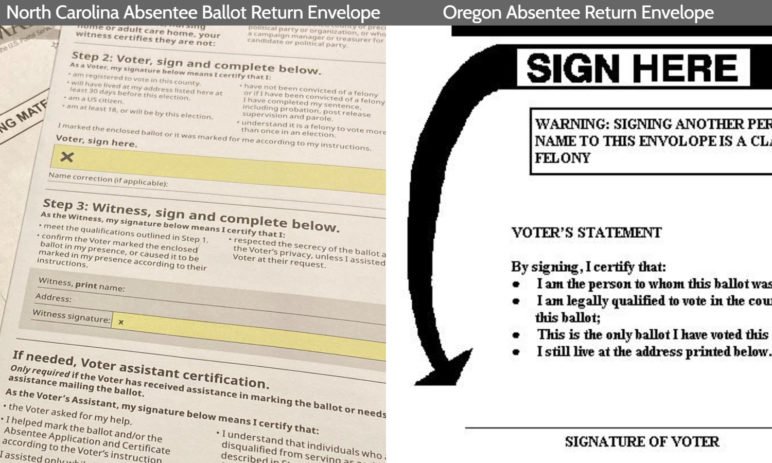
Compare North Carolina’s return envelope to Oregon’s, which only requires the voter to do one thing: sign in the clearly marked spot. Unsurprisingly, nearly 100 percent of Oregon voters have their ballots counted.
Voter education is all the more important in North Carolina because the state tacks on a superfluous witness requirement and then doesn’t give voters clear instructions about it. All North Carolina counties use the same return envelope for Vote By Mail ballots. The image shows that the place for the voter and witness signatures are clearly highlighted, but the space for the witness’s name and address is grayed out and the instructions don’t clearly state that the witness must print their name and address, making this requirement easy to overlook. Yet if the voter fails to recognize that all four fields—both highlighted and gray—must be completed, their vote will be rejected. The data are a bit ambiguous, but ballots missing witness information accounts for 18 to 56 percent of rejected ballots, including 13 to 53 percent of rejected ballots from white voters and 25 to 63 percent of rejected ballots from Black voters.
Compare North Carolina’s return envelope to Oregon’s, which only requires the voter to do one thing: sign in the clearly marked spot. Unsurprisingly, nearly 100 percent of Oregon voters have their ballots counted.
 Higher rates of voting by mail make these high rejection rates significant
In 2016 only 179,263 North Carolinians voted absentee. Officials rejected 4,861 of those ballots (2.3 percent). Even in close races that year, these rejected ballots weren’t enough to tip the scales. But in a global pandemic, more than 1.4 million North Carolinians have requested absentee ballots. If current statewide ballot rejection rates hold and everyone who requested a ballot votes, more than 43,000 voters could see their ballot rejected—including about 24,000 from white voters and 12,000 from Black voters. In 2016 just 10,000 votes decided North Carolina’s governor’s race. In 2018 a mere 6,000 votes decided the state auditor’s race. Considering how closely contested this year’s presidential and senate races are in North Carolina, the result of both those races could very well hinge on the number of rejected absentee ballots.
Reinstated absentee ballot cure process could ensure that more votes are counted
But there is some good news: on October 19, a state appellate court reinstated North Carolina’s process for allowing voters whose ballots were rejected to fix the problem so their vote can be counted.
Local election officials are now sending a “cure certification” form to voters whose absentee ballots were rejected for any of the following reasons:
- The voter didn’t sign the return envelope.
- The voter signed the envelope in the wrong place.
- The witness signed the envelope but didn’t print their name and/or address.
These voters will be able to have their ballot counted if they complete and return the cure certification form by email, fax, or mail or in person on or before Election Day at 5 PM.
Local election officials will send a new ballot to voters who made any of the following mistakes:
- The witness didn’t sign the return envelope.
- The return envelope is unsealed, torn, or opened.
- The voter indicated on the return envelope that they want a new ballot.
These ballots are marked as “spoiled,” and the voter must submit a new ballot.
Before the process was halted due to litigation, about 70 percent of voters (both Black and white) whose absentee ballot had been rejected had started the process to cure the problem. Because of the litigation, as of October 26, fewer than 40 percent of those voters have begun the cure process. Assuming that the US Supreme Court doesn’t reverse the decision and all those voters succeed in fixing the problems with their ballot before the November 12 deadline, the number of rejected ballots would decrease from 43,000 to 13,000 total Vote By Mail ballots rejected, with about 9,000 of those ballots from white voters and about 2,000 from Black voters.
County-level analysis
The statewide rejection rate for absentee ballots from Black voters is 5.5 percent. But because rejection rates vary wildly between counties, a county-level analysis is needed to identify where Black voters are most at risk of having their ballot rejected. For this analysis, Sightline identified 33 counties (the most populous 25 counties plus eight counties with the highest number of Black voters’ absentee ballots rejected) that account for 645,685 of the state’s 790,258 returned absentee ballots (82 percent) and 105,924 of the state’s 125,774 returned absentee ballots from Black voters (84 percent). This sample, despite showing only one-third of North Carolina’s counties, allows Sightline to analyze rejection rates that affect the vast majority of North Carolina’s absentee voters.
Seven North Carolina counties reject Black voters’ absentee ballots at more than three times the rate of white voters’ absentee ballots.
All of North Carolina’s 33 counties have higher rejection rates for ballots from Black voters than for those from white voters, and seven counties reject Black voters’ absentee ballots at more than three times the rate of white voters’ absentee ballots. Six counties reject more than 10 percent of absentee ballots from Black voters; eight counties reject between 8 and 10 percent of absentee ballots from Black voters. Only four counties show evidence of low racial disparity (meaning that they reject Black voters’ absentee ballots between 1 and 1.8 times as frequently as they do white voters’ absentee ballots). Even so, rejecting Black voters’ absentee ballots at a rate 80 percent higher than white voters’ absentee ballots are rejected has a racist impact on the electoral system.
Black absentee voters are heavily concentrated in just a handful of counties. The six largest counties in the state (Wake, Mecklenburg, Guilford, Forsyth, Cumberland, and Durham) account for 55 percent of North Carolina’s Black absentee voters and 50 percent of the state’s rejected ballots from Black voters.
Table 1. North Carolina counties that are either among the most populous 25 counties or among the 25 counties with the highest number of Black absentee voters’ ballots rejected, in descending order of population. (Note: Italics indicate counties not among the 25 most populous counties.)
| Low Racial Disparity | Clear Racial Disparity | Severe Racial Disparity | Severe Ballot Rejection Rate for Black Voters |
|---|---|---|---|
| Counties with absentee ballot rejection rate for Black voters at < 1.8 times the rejection rate for white | Counties with absentee ballot rejection rate for Black voters at 1.8 to 3 times the rejection rate for white | Counties with absentee ballot rejection rate for Black voters at > 3 times the rejection rate for white | Counties with absentee ballot rejection rate > 10% for Black voters |
| Union Gaston Cabarrus Randolph | Wake Mecklenburg Guilford Forsyth Cumberland Buncombe Johnston Onslow Davidson Catawba Brunswick Harnett Wayne Craven Granville Moore Pasquotank | Durham Iredell Pitt Alamance Orange Rowan Cleveland | New Hanover Robeson Vance Franklin Beaufort Martin |
Union, Gaston, Cabarrus, and Randolph Counties reject between 1.5 and 1.8 times more absentee ballots from Black voters than those from white voters. Gaston and Randolph Counties reject more than 5 percent of absentee ballots from Black voters; these counties are included in the low racial disparity category only because they also reject more than 3 percent of absentee ballots from white voters. Gaston and Randolph Counties show evidence of some racial bias and strong evidence of bias against voters of all races.
Table 2. Counties with Low Racial Disparity (Rejection Ratio: 1 < x < 1.8)
| County | Total Number of Absentee Ballots Returned | Number of Absentee Ballots from Black Voters | Number of Absentee Ballots from Black Voters Rejected | Rejection Rate for Absentee Ballots from Black Voters | Rejection Rate for Absentee Ballots from White Voters | Ratio of Rejection Rates (Black:White) |
|---|---|---|---|---|---|---|
| UNION | 14,401 | 1,660 | 28 | 1.7% | 1.1% | 1.6 : 1 |
| GASTON | 13,126 | 2,157 | 119 | 5.5% | 3.1% | 1.8 : 1 |
| CABARRUS | 15,233 | 2,642 | 21 | 0.79% | 0.5% | 1.6 : 1 |
| RANDOLPH | 5,937 | 450 | 29 | 6.4% | 3.9% | 1.7 : 1 |
Seventeen counties, including all five of North Carolina’s most populous counties, reject Black voters’ absentee ballots between 1.8 and 3 times more frequently than they reject white voters’ absentee ballots. Rejection rates in Mecklenburg and Wake Counties, which alone account for more than 20 percent of North Carolina’s population, show clear evidence of racial bias, with its rejection of Black voters’ absentee ballots at 2.1 and 3 times, respectively, the rate of white voters’ absentee ballots. Of all of North Carolina’s counties, Guilford, the state’s third largest county, has rejected the most absentee ballots from Black voters, even though it is only half the size of Wake or Mecklenburg Counties. Brunswick, Craven, Moore, Granville, and Pasquotank Counties all reject more than 8 percent of absentee ballots from Black voters.
Table 3. Counties with Clear Racial Disparity (Rejection Ratio: 1.8 < x < 3)
| County | Total Number of Absentee Ballots Returned | Number of Absentee Ballots from Black Voters | Number of Absentee Ballots from Black Voters Rejected | Rejection Rate for Absentee Ballots from Black Voters | Rejection Rate for Absentee Ballots from White Voters | Ratio of Rejection Rates (Black:White) |
|---|---|---|---|---|---|---|
| WAKE | 133,063 | 14,940 | 671 | 4.49% | 2.12% | 2.12:1 |
| MECKLENBURG | 106,990 | 22,288 | 726 | 3.26% | 1.09% | 2.98:1 |
| GUILFORD | 40,467 | 9,660 | 762 | 7.89% | 3.44% | 2.29:1 |
| FORSYTH | 35,168 | 6,807 | 374 | 5.49% | 2.92% | 1.88:1 |
| CUMBERLAND | 18,380 | 7,703 | 560 | 7.27% | 2.57% | 2.83:1 |
| BUNCOMBE | 30,159 | 1,042 | 81 | 7.77% | 3.33% | 2.34:1 |
| JOHNSTON | 10,417 | 1,795 | 17 | 0.95% | 0.45% | 2.12:1 |
| ONSLOW | 7,089 | 1,464 | 42 | 2.87% | 1.26% | 2.27:1 |
| DAVIDSON | 9,833 | 998 | 49 | 4.91% | 2.37% | 2.08:1 |
| CATAWBA | 8,308 | 594 | 45 | 7.58% | 2.83% | 2.68:1 |
| BRUNSWICK | 15,855 | 934 | 88 | 9.42% | 4.36% | 2.16:1 |
| HARNETT | 6,661 | 1,469 | 90 | 6.13% | 2.51% | 2.44:1 |
| WAYNE | 5,752 | 2,173 | 134 | 6.17% | 2.88% | 2.14:1 |
| CRAVEN | 7,728 | 1,595 | 141 | 8.84% | 3.64% | 2.43:1 |
| MOORE | 9,506 | 773 | 62 | 8.02% | 2.77% | 2.89:1 |
| GRANVILLE | 3,508 | 1,008 | 97 | 9.62% | 3.35% | 2.88:1 |
| PASQUOTANK | 1,916 | 676 | 61 | 9.02% | 3.87% | 2.33:1 |
Seven counties reject Black voters’ absentee ballots at more than three times the rate of those of white voters. Durham County, North Carolina’s sixth largest county with more than 300,000 residents, rejects more than 5 percent of absentee ballots from Black voters compared to only 1.4 percent of those from white voters. Pitt, Rowan, and Cleveland Counties reject more than 8 percent of absentee ballots from Black voters. Orange County rejects Black voters’ absentee ballots at more than five times the rate of those of white voters.
Table 4. Counties with Severe Racial Disparity (Rejection Ratio: x > 3)
| County | Total Number of Absentee Ballots Returned | Number of Absentee Ballots from Black Voters | Number of Absentee Ballots from Black Voters Rejected | Rejection Rate for Absentee Ballots from Black Voters | Rejection Rate for Absentee Ballots from White Voters | Ratio of Rejection Rates (Black:White) |
|---|---|---|---|---|---|---|
| DURHAM | 40,523 | 7,285 | 377 | 5.18% | 1.44% | 3.61:1 |
| IREDELL | 13,799 | 1,347 | 22 | 1.63% | 0.42% | 3.89:1 |
| PITT | 9,237 | 2,978 | 266 | 8.93% | 2.74% | 3.27:1 |
| ALAMANCE | 11,770 | 2,049 | 82 | 4% | 1.31% | 3.06:1 |
| ORANGE | 22,020 | 1,127 | 50 | 4.44% | 0.88% | 5.02:1 |
| ROWAN | 8,408 | 1,255 | 102 | 8.13% | 2.38% | 3.42:1 |
| CLEVELAND | 4,719 | 945 | 84 | 8.89% | 2.53% | 3.51:1 |
Lastly, six counties reject more than 10 percent of absentee ballots from Black voters. These six counties also reject ballots from white voters at rates higher than the state average, so there is evidence that they reject ballots from all voters at a higher rate. Even so, absentee ballots from Black voters are rejected between 1.9 and 3.2 times the rate of ballots from white voters. New Hanover County is the ninth largest county in North Carolina and rejects 12 percent of absentee ballots from Black voters compared to 6 percent of those from white voters.
Table 5. Counties with Severe Ballot Rejection Rate for Black Voters (Black Rejection Rate: x > 10%)
| County | Total Number of Absentee Ballots Returned | Number of Absentee Ballots from Black Voters | Number of Absentee Ballots from Black Voters Rejected | Rejection Rate for Absentee Ballots from Black Voters | Rejection Rate for Absentee Ballots from White Voters | Ratio of Rejection Rates (Black:White) |
|---|---|---|---|---|---|---|
| NEW HANOVER | 23,539 | 2,290 | 274 | 11.97% | 6.2% | 1.93:1 |
| ROBESON | 2,983 | 933 | 112 | 12% | 5.33% | 2.25:1 |
| FRANKLIN | 3,509 | 800 | 93 | 11.63% | 4.42% | 2.63:1 |
| BEAUFORT | 2,623 | 605 | 88 | 14.55% | 7.36% | 1.98:1 |
| VANCE | 2,054 | 1,027 | 117 | 11.39% | 5.28% | 2.16:1 |
| MARTIN | 1,004 | 455 | 66 | 14.51% | 4.54% | 3.2:1 |
One simple step for North Carolina to reject fewer ballots and count more votes
Simple policy changes could reduce racial bias in North Carolina’s absentee ballot rejection rates. Lawmakers could revoke the witness requirement. The Tar Heel state is an outlier in insisting on this requirement that perpetuates racial bias and does not protect against fraud. Without the witness requirement, the ballot’s return envelope design would be simple, as it is in other states, so that voters just need to sign it to have their vote counted. Because this year—and every year—each and every vote counts.
Sightline Institute is a 501(c)3 non-profit organization and does not support, endorse, or oppose any candidate or political party.
Kristin Eberhard, Director, Climate and Democracy, author of Sightline’s forthcoming book, Becoming a Democracy: How We Can Fix the Electoral College, Gerrymandering, and Our Elections, is a researcher, writer, speaker, lawyer, and policy analyst who spearheads Sightline Institute’s work on democracy reform and on climate action. She researches, writes about, and speaks about elections systems and democracy reform, with particular expertise on Vote By Mail and proportional representation. Eberhard lives in Oregon, an all-Vote By Mail state. She is available to discuss tested, safe, fair COVID-19 election practices, state by state. Find all Eberhard’s latest research here.
Zane Gustafson, research contributor, holds a master of public affairs degree, with a focus in climate policy, from the Evans School of Public Policy and Governance at the University of Washington. He also studies foreign affairs, political rhetoric, and American history.
Hayat Norimine, research contributor, is a freelance writer who grew up in Washington on the border of Idaho. She previously covered city halls and politics for The Dallas Morning News, Seattle Met magazine, and The Daily News in Longview, Washington. She has an MA in journalism from the Medill School of Journalism and a BA in English from the University of Washington. For Sightline, she researches and writes about democracy reform and elections issues and reports on fossil fuel proposals along the Thin Green Line.
Thank you to Jade Chan for editing.
For press inquiries and interview requests, please contact Anna Fahey.
