Original Sightline Institute graphic, available under our free use policy.
If you were watching TV in the US in the late 1980s, you’ll probably remember the anti-drug ads with the egg—“this is your brain”—and then the egg cracked into a sizzling hot frying pan—“this is your brain on drugs.” But if neuroscience and psychology and behavioral economics tell us anything, it’s that the human brain scrambles itself—no drugs required! Dozens of cognitive biases—all well studied—mean good old homo sapiens is not as wise—or rational or objective—as we’ve cast ourselves to be. Unconscious mental shortcuts, ingrained social survival impulses, and evolutionary glitches complicate how we evaluate new information, form opinions, gauge risk, or change our minds.
And I mean all of us. Don’t forget that rascally blind spot bias—where we tend to notice others’ flaws in reasoning far more readily than seeing them in ourselves.
As we humans seem to careen toward an epistemological precipice sped along by intense partisanship, it’s worth reviewing some of the most powerful tricks our own brains play on us.
Confirmation bias: We cherry pick “evidence” that backs up what we already “know”
Consider the news sources you trust compared to places your politically opposite uncle reads. You each think the other is spouting fake news. But both of you—consciously and unconsciously—seek out information that supports your existing beliefs and ignore or reject information that contradicts it. And it’s not just looking for proof that we are right; information we deem credible, how we interpret it, and what we remember also serve existing convictions over new ones and protect us from having to admit—even to ourselves—that we were wrong.
The backfire effect: Faced with conflicting evidence, the brain defends existing beliefs like a fortress
Think of your belief system as a house—but not just any house, this is the very structure that your identity, your worldview, your common sense, your self calls home! When new evidence threatens to destroy even one building block of our house, we build up defenses in order to keep the whole thing from falling down. When someone challenges our preconceptions we may very well dig in our heels. And this is only partly metaphor. Ask a neuroscientist and they’ll tell you that beliefs are physical, established in the very structure of our brains. “To attack them is like attacking part of a person’s anatomy.” (Do not miss The Oatmeal’s explanation of the backfire effect!)
Group-think: “When opinions are symbols of belonging, our brains work overtime to keep us believing”
That’s how Dan Kahan, Yale law and psychology researcher, describes group-think. Our affinity groups go a long way to define who we are and what we think. People around us give us confidence we’re right because we all agree. Again, our identity depends on upholding and protecting the group’s worldview. It’s the backfire effect all over again. We’d rather justify our strongly held beliefs than change our minds or fly in the face of our group’s norms. And just like confirmation bias, this is a kind of “identity-protective cognition.” Science writer Chris Mooney explains:
Our political, ideological, partisan, and religious convictions—because they are deeply held enough to comprise core parts of our personal identities, and because they link us to the groups that bulwark those identities and give us meaning—can be key drivers of motivated reasoning. They can make us virtually impervious to facts, logic, and reason.
Pro tip: If you’re trying to change people’s minds, consider messengers from within their trusted social group. (See also: In-group bias and false consensus bias.)
Availability heuristic: False conclusions based on one vivid example overpower less memorable narratives
What comes to mind most readily can shape our thinking. For example, a few high-profile murder cases stick in our mind and may drown out less flashy statistics about declining violent crime rates in our city. We tend to jump to conclusions based on the incomplete information that stands out in our minds. “The problem is that too often our beliefs support ideas or policies that are totally unjustified,” says author and researcherSteven Sloman.
Affect heuristic: Feelings trump facts
Tugging at heartstrings? Going for the gut? Commercial marketers, political campaigners, and psychologists know this one well: the tendency to make decisions based on emotion, not facts. The brain is emotional first (system one, the fast, automatic response), analytical later (system two, the slower more thoughtful process). But the systems aren’t disconnected. A network of memories, associations, and feelings “motivates” our system two reasoning, making objective judgement elusive. According to Drew Westen, psychologist, political consultant, and author of The Political Brain, the brain on politics is essentially the brain on drugs. In fact the same chemicals are in play. Positive emotions are related to dopamine (a neurotransmitter found in rewards circuits in the brain) and inhibition and avoidance are associated with norepinephrine (a close cousin of the hormone adrenaline, which can produce fear and anxiety). In his research, the brain function of partisans sought good chemicals and avoided bad ones.
All this is to say that facts aren’t a magic serum for changing minds. In fact, pouring on more facts can have the opposite effect, entrenching people’s existing beliefs. You knew that. But it’s good to review. Perhaps if we stop more often to think about how we think, we’ll be better equipped to venture out of our own echo chambers, find empathy and understanding rather than fanning the flames of polarization, and map a bit more common ground.
LNG ‘Giants of the Sea’ Headed for BC Waters
British Columbia’s Pacific Coast is home to prolific salmon runs, pristine shorelines, and a rich archaeological history. Yet amid these natural wonders, the fossil fuel industry has sited proposals for nineteen liquefied natural gas (LNG) developments that would greatly increase tanker traffic navigating remote island channels with strong currents and tides.
To make clear the scale of the provincial government’s LNG gamble, we calculated the possible cumulative increase in marine traffic: over 3,400 large LNG tankers, or more than 6,800 annual transits. Even using conservative assumptions, LNG tankers could add more than 800 large tankers to the annual vessel traffic around Vancouver Island and could increase vessel traffic along the Northwest coast by over 2,600 vessels annually.
Original Sightline Institute graphic, available under our free use policy.
LNG vessels: Giants of the sea
Transportation of methane gas, often known as “natural gas,” is limited when the fuel is in gaseous form. Pipelines are the primary means of moving the gas, which limits its delivery range. But liquefaction reduces its volume to 1/600th of its gaseous state and enables the LNG industry to ship large quantities overseas and then convert it back to a gas at its destination. The first oceangoing LNG ship, the Methane Pioneer, was a converted cargo vessel that sailed from Louisiana to the UK in 1959. By the end of 2016, there were 439 LNG tankers in the global LNG fleet, according to the International Gas Union.
A typical LNG tanker has a hull that is approximately 300 meters long—about the length of three American football fields—and fifty meters wide. The vessels are so large that Seattle’s Space Needle could be stowed in the hold. The average LNG tanker can store around 160,000 cubic meters (m3) of LNG, but the projects proposed for BC’s coast would likely see even bigger vessels. Of the nine projects that have so far provided estimates, six propose using the largest ships on the market: Q-flex and Q-max vessels. The Q-flex vessel can hold up to 217,000 m3of LNG, while the Q-max can hold up to 266,000 m3. The Q-max is about 345 meters long, or three-and-a-half football fields.
Thus far, fewer than half of the LNG proposals have provided vessel traffic estimates, and those that have done so cite an improbable vessel size. Although most of the project backers that have provided estimates refer to Q-flex and Q-max vessels, there are not nearly enough ships of this size available to manage the sheer volume of BC’s LNG proposals year-round. Q-class vessels make up only 11 percent of the global LNG fleet. By comparison, standard capacity vessels (125,000-150,000 m3) account for 49 percent of the global fleet, while vessels in the 150,000 to 180,000 m3 range account for 36 percent. Based on the actual size of ships in the global LNG fleet, it’s more likely that BC’s LNG facilities would use a combination of vessel sizes, most of them smaller than Q-class vessels. As a result, facilities would require more vessel transits per year to deliver the very large production volumes the industry has planned.
Vancouver, Kitimat, Prince Rupert, and Kitsault areas to handle hundreds more vessels each annually
Sightline estimates that LNG tankers could add over 800 ships to the annual vessel traffic around Vancouver Island and could increase vessel traffic along the Northwest coast by over 2,600 vessels annually. Since each vessel has two transits (coming and going), that’s more than 1,600 new transits around Vancouver Island and more than 5,200 new transits along the northern coast of BC.
Original Sightline Institute graphic, available under our free use policy.
Our estimates are somewhat conservative because they assume that most facilities will not achieve their maximum production volume. The average capacity utilization of LNG facilities around the globe was 84 percent between 2010 and 2016, partly due to the glut of LNG on the world market. In 2016, LNG facilities worldwide produced about 82 percent of their maximum production volume, down from 84 percent in 2015. Accordingly, we calculated three capacity utilization scenarios: 82, 90, and 95 percent, representing the actual utilization in 2016 and two capacity utilization scenarios under stronger market conditions, since the market will need to improve for the projects to feasibly advance. We then calculated a median estimate for vessel traffic to each facility based on capacity utilization and vessel sizes represented in the global LNG fleet.
Accurate vessel traffic estimates are important because they help reveal the real risks that the LNG industry poses to Canada’s Pacific Coast. Almost certainly, a large increase in tanker traffic would have negative repercussions for recreational and commercial fishers, the First Nations and tribes that rely on coastal waters for their livelihood, and other coastal communities. Until the project backers—and the government regulatory agencies tasked with reviewing the projects—provide complete and accurate information about vessel traffic, communities will be unable to make an informed decision about just how much BC’s aggressive pro-LNG exports strategy risks the province’s unique coastal resources.
Methodology
Our estimates do not count ancillary vessel trips, such as the refueling (“bunkering”) vessels that serve oceangoing cargo ships that run on diesel, nor do they count tugboats that will accompany the tankers.
One facility, Tilbury/Wespac LNG, differs from the others in that it intends to export LNG to the US rather than Asia, using vessels of 90,000 m3 capacity, and bunker LNG as fuel using vessels of 4,000 m3 capacity. For this facility, we used the numbers provided by the project backers. Another facility, Nisga’a LNG, has yet to apply for an export license, so its volume is unknown; we made no estimate for this facility.
For the remainder of the facilities, we calculated vessel traffic using assumptions of 82 percent capacity utilization, 90 percent capacity utilization, and 95 percent capacity utilization. For each utilization assumption, we calculated vessel traffic using small and large vessels, the average size of tankers in the global fleet, and the likely average vessel size that will visit each facility, given its production volumes. This yielded four vessel traffic calculations for each utilization scenario, or twelve calculations for each facility. The “low estimate” in our table represents the lowest of the twelve calculations, and the “high estimate” represents the highest of the twelve calculations. The “median” in our table is the median figure of all twelve estimates generated per facility.
To calculate small vessel estimates, we used vessel size 135,000 m3, and for large vessels we used 190,000 m3. We used 160,000 m3 for the global fleet average. Our calculations of likely vessel size per facility were based on the facility’s production volume and the current makeup of the global LNG fleet.
While most of our vessel estimates fall within the range estimated by the facility backers, there are two instances where the facility backers’ estimates fall outside of our range. The range provided by Kitimat LNG is lower than our lowest estimate, suggesting that the project backer has some degree of certainty that it will be using very large LNG tankers for all trips. The figure provided by Pacific NorthWest LNG is 350 vessels, which is greater than our highest estimate. This suggests that the project backers have some degree of certainty that they will be using vessels smaller than the conventional “small” LNG tanker size of 125,000 m3.
The $7.4 billion Kinder Morgan project would add another pipeline alongside one that already extends from Edmonton, Alberta, to the Westridge Terminal in Burnaby, near Vancouver, British Columbia. It would increase the system’s capacity from 300,000 to 890,000 barrels per day. Most of the additional oil would be tar-sands crude that would be loaded onto another 348 tankers plying the Salish Sea every year.
The San Juan Islands archipelago, as viewed from the south, with San Juan and Lopez Islands in the foreground. By H. Gary Greene, SeaDoc Society and Tahoe Images, used with permission.
In order to flow through pipelines, the viscous, tarry bitumen mined in Alberta must be diluted with light hydrocarbons like benzene or naphtha—and is thus called diluted bitumen, or “dilbit” for short. If the dilbit were to be spilled from a tanker into the Northwest’s inland sea, a portion of it might be corralled and removed by prompt action of the Canadian or US Coast Guard and other responders.
But not all of it. According to an authoritative 2015 report from the US National Academies of Sciences and Engineering, a significant fraction would likely sink to the sea floor and remain unrecoverable for decades, if not centuries, harming Dungeness crab, rockfish, sand lance, and other bottom-dwellers. It would also seriously threaten migrating salmon and the totemic, endangered Southern resident killer whales, which ultimately depend on these members of the marine food chain, especially Chinook salmon. A major dilbit spill in the Salish Sea could easily trigger an ecological catastrophe.
Something similar occurred in 2012 near Marshall, Michigan, when an Enbridge pipeline ruptured, releasing nearly a million gallons of dilbit into a tributary of the Kalamazoo River. A large portion sank, evading recovery efforts designed for floating oils, and contaminated 25 miles of river bottom. Enbridge spent over five years and $1.2 billion trying to remove the sticky residues, but a significant fraction still remains. And that spill happened in a shallow riverbed, not the deep, fast-flowing channels around the San Juan Islands.
Results of computer simulations showing how a major oil spill at the BC Ferry crossing would have spread in the summer of 2012. Adapted by Shaun Hubbard from Kinder Morgan report, used with permission.
This tar-sands threat is not confined to the Salish Sea. Many of the tankers carrying oil from an expanded Kinder Morgan pipeline would head south along the US West Coast and offload their gooey cargoes in California, where refineries are able to handle heavy oils. (More dilbit-laden barges would also pass through Puget Sound to a Tacoma refinery.) And dilbit could be shipped through Pacific Northwest waters by other routes, too. For example, the proposed Tesoro oil terminal on the Columbia River at Vancouver, Washington, could load up to a barge or tanker per day with dilbit headed for these refineries. Laden with oil, the ponderous vessels would then have to clear the treacherous Columbia Bar at the river mouth.
When dilbit enters water, it separates into its primary components—the original tar-like bitumen and volatile components such as benzene, which rapidly evaporates. This noxious gas, a carcinogen, makes dilbit spill recovery extremely difficult for early responders, who would require artificial breathing apparatuses to work near the spill, the National Academies study concluded.
The lengthy report prepared for Canada’s National Energy Board on the Kinder Morgan project completely ignored this possibility, however. It claimed that any spilled tar-sands oil could be cleaned up by conventional methods like booming, burning and skimming—but those methods only work if the oil remains on the surface. The report’s authors based this conclusion on tests (called the Gainford study) that attempted to simulate conditions in Burrard Inlet north of Burnaby, where strong winds and sediments are encountered only rarely. They then applied the results of these narrowly limited tests, which showed only small amounts of sinking oil, to all portions of the Salish Sea where the tankers would travel.
A major spill in these waters would likely result in many tons of sinking dilbit that could never be removed.
But the much more authoritative National Academies report concluded that “spills of diluted bitumen pose particular challenges when they reach water bodies. In some cases, the residues can submerge or sink to the bottom.” It also stated that dilbit spills are “highly problematic for spill response because there are few effective techniques for detection, containment, and recovery” of sinking oils. Asked about dilbit recovery by Washington Senator Maria Cantwell during a Congressional hearing, US Coast Guard Commandant Admiral Paul Zukunft candidly admitted that “once it settles to the sea floor, our technology is lacking.”
During the prior Canadian federal government under Stephen Harper, National Energy Board officials ignored the National Academies report when they reviewed the Kinder Morgan project, claiming that it had been published too late and would thus be “prejudicial” if considered. This was irresponsible. Prime Minister Trudeau might have corrected the oversight, but he instead compounded the error, ignoring what is obviously the best available science on the behavior of diluted bitumen in marine environments.
Canada’s own federal agencies had in fact reached similar conclusions in an earlier, 2013 report: that dilbit can and will sink in seawater, especially if fine sediments and wind or waves are present. Wind and waves mix the bitumen remaining after evaporation with sediments, and the resulting combination will sink if it’s denser than seawater. Other conditions can lead to sticky, floating masses and tarballs. But the energy board examiners must have ignored this official Canadian report, which was clearly available well before they began deliberations.
Kinder Morgan project based on sham science
Thus, contrary to what Prime Minister Trudeau has publicly stated, the proposed Kinder Morgan project is not based on sound science at all. It’s based on sham science. The Kinder Morgan proposal assumed that dilbit spilled from a tanker would all float and therefore be completely recoverable. It treated such an event as an ordinary oil spill, which it’s not.
Resistance continues to strengthen and grow, likely portending the birth in British Columbia of what some have dubbed “Standing Rock North.”
In truth, Canada does not have the widely claimed “world-class spill recovery system” capable of dealing with dilbit spills. Nobody does. Nor will any nation have such a system until these kinds of spills are better understood and new techniques developed to remove submerged oil from marine waters.
Here in the Salish Sea, San Juan Islanders and their counterparts in Canada’s Gulf Islands worry that distant national governments do not have the wisdom and foresight needed to recognize the Faustian bargain offered by the tar-sands crude industry. We cannot afford another dilbit disaster like the Kalamazoo spill—especially not in the rough, fast-flowing waters around these islands.
As Canada and the United States are unlikely to impose a much-needed moratorium on marine transport of diluted bitumen, the people of the Pacific Northwest are beginning to take matters into their own hands. Ecojustice has filed a lawsuit against Kinder Morgan in Canadian courts, focusing on the likely impacts of the tankers on endangered killer whales. First Nations and Native American tribes are uniting against it. And the city governments of Burnaby and Vancouver are staunchly opposed, too.
Resistance continues to strengthen and grow, likely portending the birth in British Columbia of what some have dubbed “Standing Rock North.”
Sightline Fellow Michael Riordan, a physicist and co-author of The Solar Home Book, Crystal Fire, and Tunnel Visions, writes about science, technology and public policy from his home in Eastsound, Washington.
The Roosevelt Institute (love!) just completed a study of basic income experiments—long version here and short summary here. The upshot: extra cash helps improve parenting, mental health, school attendance and test scores, and reduces substance abuse and addiction. What it doesn’t do is cause people to stop working.
As an introduction to its advice to the modern American left, this article quotes an amazing (but not oft-quoted) speech by Abraham Lincoln to the temperance society. He advised the abstemious that denouncing drinkers as “moral pestilences” was likely to make them resent temperance, not embrace it. “To have expected them not to meet denunciation with denunciation . . . was to expect a reversal of human nature.” The article goes on to quote this passage from a book about the privilege framework:
It can seem as if the desired goal is for everyone to be oppressed, rather than for all to be free from oppression. Is it a problem that white killers are captured alive by the police? That white drug addicts appear in the media as real people with a medical condition? Or is the problem that black killers and drug addicts, respectively, don’t get that treatment? It seems right to use ‘privilege’ if your point is that some people do indeed have it too easy.
That is, after all, what ‘privilege’ implies.
Which is why it’s such an odd fit for cases where the point being made is that the world is just for some and unjust for others. Calling justice “privilege” is just another way of highlighting that not all experience it. The problem is that it also implies that no one should… The privilege framing, with its focus on unearned advantage rather than unjust disadvantage, doesn’t fit with situations where even the “privileged” person is still quite screwed.
Humans are made for small-group interaction. Evolutionary biologist David Sloan Wilson is trying to learn from Korean evangelical pastor Dr. Cho how to use small groups, or cells, as a unit to achieve bigger social change.
Charles Dickens, Gabriel Garcia Marquez, and Charles Darwin all worked five hour days. What did they know that we don’t?
Alan
An old but smart article from Yale Law Professor David Schleicher explains how state and local elections are worse than national ones, because voters know little about the candidates, and parties are defined at the national level. In British Columbia, of course, many national, provincial, and municipal parties are different from one another. The center-right provincial BC Liberals are more like the federal Conservatives than the federal Liberals, for example. A center-right, free-enterprise-valuing voter in Vancouver, BC, for example, might vote for federal Conservatives, provincial Liberals, and municipal candidates from the local party that’s called (for further confusion) the Non-Partisan Alliance.
Groupthink, no matter who is engaged in it, is an enemy of progress. I’m seeing too much of it on both the right and the left these days, and I find it deeply disturbing. The latest example comes from academia, where critique of one obscure philosophy argument gave way to thought policing and a modern witch hunt.
Democracy Now! ran a recent show from Seattle, and in the process interviewed Kshama Sawant, the Socialist Seattle City Council member, covering immigration matters in Washington state and reporting on the tunnel collapse at Hanford.
Since I’ve been writing articles on pesticides, I thought I should learn more about organic food. This TED Talk dispels organic food myths, including some that I held. Spoiler alert, the major reason organics are more expensive is not higher costs to grow them.
John Abbotts is a former Sightline research consultant who occasionally submits material for Weekend Reading and other posts.
Event: Homeownership: Receding Dream or New Approaches?
“It’s pretty well-established that homeownership is the way that people actually build wealth and intergenerational wealth.” – Kathleen Hosfeld
Since at least World War II, homeownership has been one of the main paths to accumulating assets in the United States. Redlining and other lending rules welcomed white families onto this path, but excluded families of color from the mortgages and neighborhoods that allowed them to build wealth. The resulting patterns of inequality in ownership persist: the net worth of the average US homeowner is now $195,400—36 times the average renter’s $5,400 net worth.
Neighborhoods may no longer be carved up by red lines dictating who can live where, but policies such as the mortgage interest tax deduction and single-family zoning keep low-income people and people of color from building wealth through ownership. This is especially true in expensive cities such as Cascadia’s big three: Portland, Seattle, and Vancouver, BC. In Seattle, the median home price recently topped $700,000. “It’s pretty well-established that homeownership is the way that people actually build wealth and intergenerational wealth,” Homestead Community Land Trust executive director Kathleen Hosfeld says.
Hosfeld’s organization helps working-class families build wealth through community land trusts—an ownership model in which a nonprofit organization, aided by public and philanthropic funds, buys land and builds homes, then sells the homes below market rate to people with modest incomes. The homebuyers purchase the building, but lease the land beneath it from Homestead. They agree that the price of the house can only rise 1.5 percent a year. Community land trust buyers will never reap the kind of windfalls other homeowners may receive, but they are at least on the path to asset accumulation. By keeping prices low, the model “puts homeownership within reach for people who otherwise would never be able to own a home,” Hosfeld says.
Hosfeld, along with Sven Gatchev of Mercy Corps Northwest, Jaebediah Gardner of Onpoint Real Estate, and Sam Farrazaino of Equinox Studios, will discuss land trusts and other innovative avenues for building wealth—including affordable artist studios that pay tenant dividends, and a community ownership project in Portland that gives low-income residents an ownership stake in a commercial building—at “Own It: Prevent Displacement, Build Wealth,” Capitol Hill Housing’s (CHH) annual community forum. CHH spokesman Ashwin Warrior says that all the panelists “offer innovative models for accessing ownership” at a time when that goal is elusive. The forum is on Thursday, May 25, at 5:30 pm at the Summit, 420 East Pike St, in Seattle.
Speakers: Jaebadiah Gardner, Onpoint Real Estate; Sven Gatchev, Mercy Corps Northwest; Sam Farrazaino, Equinox Studios; Kathleen Hosfeld, Homestead Community Land Trust
Where: The Summit—420 East Pike Street, Seattle, WA (map)
When: Thursday, May 25, 2017, 5:30 PM
Sponsor: Capitol Hill Housing
The event is free and open to the public. RSVP here.
Want to help spread the word? You can do so on Facebook.
Sightline’s Guide to Methods for Electing Legislative Bodies
The legislature is the people’s house, the hall of a representative democracy where representatives of the people meet to craft solutions to pressing problems. It is the body that takes people’s values and puts them into action. That’s the ideal. And when it works well, it’s golden.
For example, the US Congress turned people’s growing concern about labor conditions during the Progressive Era into child labor and minimum wage laws; the Oregon state legislature’s leadership on the bottle bill enacted community values about protecting the environment; Washington’s state legislature responded to changing public sentiment by legalizing marriage equality; and British Columbia acted on people’s concerns about climate change by enacting a tax on carbon pollution.
But it doesn’t always work that way. In fact, in the United States and Canada, federal, state, and provincial legislatures often don’t reflect or act on the views and values of the people. They become mired in gridlock and political grandstanding, seeking quick fixes and catering to special interests. The media talk more about representatives’ hairstyles, emails, and personal lives than community challenges and solutions, leaving voters ill-informed about policy they could urge their representatives to enact.
What other options do Cascadians have for electing more reflective and effective legislative bodies? This article gives Sightline’s take on what is important in a method for electing a legislative body, including city and county councils, and how different election methods could achieve results that get closer—more often and more deeply—to the ideal where electeds work for the people who put them in office, rather than for special interests or narrow or extreme slices of the electorate. The theme throughout is: homogenous legislatures including only, say, white men with a narrow range of political ideologies or life experiences, produce poor results for a diverse electorate, while diverse legislatures, including people with many different life experiences and political perspectives, produce better results.
Election methods aren’t the only factor. Big money in politics and barriers to voting can prevent people from having a say in who gets elected, and structural barriers in the candidate pipeline can block diverse candidates. Elections are not a silver bullet, but improving how we vote could be a hefty piece of silver buckshot in the quest to make democracy in Cascadia and throughout the United States and Canada more representative.
In Majoritarian methods, used in the United States and Canada, all or most legislators represent majority views, while minority groups do not have fair representation. Usually, two major parties representing the social or political majority dominate the legislature.
In Proportional methods, used in most developed countries, legislators represent the diversity of voters. Usually, several parties representing a range of social and political views win seats in proportion to the votes they receive.
In Semi-proportional methods, used in local elections across the United States, minority social or political groups have a chance to win seats.
Potentially Proportional methods have not been used in any public elections, but might achieve proportional results.
Research reveals stark differences between majoritarian and proportional methods. For each of the properties we identified below as being broken about the political systems in the United States and Canada, proportional election methods offer a solution.
Semi-proportional methods are used at the local but not the national level anywhere in the world, so there is much less research on their outcomes, and the sections below only discuss majoritarian and proportional methods. The effects of semi-proportional methods tend to fall somewhere in the middle, depending on the specific circumstances in which they are implemented.
Two Potentially Proportional methods have not yet been used in any public elections but theoretically could achieve proportional results. They would likely achieve many of the benefits that semi-proportional methods yield, and possibly more.
Majoritarian methods have problems; Proportional methods have solutions
The United States and Canada primarily use majoritarian election methods—particularly single-winner, “vote for one” elections—to elect federal, state, and provincial legislatures, local councils, and school boards. These methods lead to many problems. But decades of research on countries using different election methods show a better way forward with proportional methods. Proportional electoral methods elect more representative legislatures, defang gerrymandering, empower voters, lead to long-term policy solutions, and counter the power of extractive special interests.
With majoritarian methods, each legislator must have majority, or at least plurality, support. Almost all the members of the legislature end up representing majority views, and voters in the minority don’t have fair representation in the legislature or a voice in what policies get passed. If the majority of voters prefer Democrats and Republicans, then few or no independents, Green party members, or libertarians will win seats. If the majority of voters (consciously or unconsciously) tend to favor white candidates, candidates of color may have a harder time winning seats. If most voters, all else equal, would prefer a male candidate, then few women win seats. Even if voters might vote for a woman, political parties often won’t risk running a woman as their only candidate in a majoritarian race.
The United States and Canada rank number 100 and 63 in the world, respectively, in the percentage of women who hold office in their national legislatures. Rwanda, Nicaragua, Mexico, South Africa, Namibia, and others all have more than 42 percent women legislators, compared to 19 percent in the United States and 26 percent in Canada.
North American voters are also diverse in terms of political ideology, but they aren’t well represented on that spectrum either. Despite the fact that more Americans identify as independent than as Democrat or Republican, almost all American legislators continue to be either Democrats or Republicans. Canada’s parliamentary system lends it more diversity than America’s presidential system, but even so, in 2015, more than 3 percent of Canadian voters voted for the Green Party, and it still won just 0.3 percent of seats in Parliament. The New Democratic Party won 20 percent of the vote but only 13 percent of seats.
Beyond the issue of unrepresentative bodies of government is the problem of confidence in our systems of governance. When voters see, year after year, that their views and life experiences are not well represented in their legislature, they may feel alienated from the democratic process and distrustful of the resulting government. And that’s a loss for the entire system.
Proportional election methods are designed to ensure that any group of voters above a certain numerical threshold can elect representatives. Some proportional methods even formally set the threshold. For example, in Germany and New Zealand, any party with less than 5 percent of the vote cannot win a seat. With other methods, the threshold is inherent in the district size. For example, Ireland uses Ranked-Choice Voting to elect its legislators from districts with three, four, or five members. In districts with three members, mathematically, a candidate must have at least 25 percent of the vote to win a seat, while in a five-member district she must have 17 percent.
Legislatures elected with proportional methods end up better representing the politically diverse values of the voters. For example, in Ireland, voters who believe in “People before Profit” have six legislators representing them, and independents have four legislators. In Australia, the Greens have nine representatives in the Senate, and so on.
Proportional countries elect more women. All countries in Western Europe where the number of women in Parliament exceeds 20 percent use proportional methods. Nearly 90 percent of countries that have no female legislators use a majoritarian method. Particularly illuminating are two countries which use a hybrid system, electing some legislators in majoritarian, “vote for one,” single-member districts and some through proportional methods in larger districts. In Germany and New Zealand, the majoritarian single-member districts elected 13 percent and 15 percent women respectively, while the proportional multi-member districts elected 39 and 45 percent.
Most jurisdictions in the United States and Canada guarantee one type of diversity in the legislature—geographic diversity. Single-member districts ensure that each corner of the country or province or state has a representative, but that assurance comes at a cost: it may give district contours more voting power than voters themselves have. In other words, voters’ preferences matter less than the placement of the district lines in deciding representation.
In the single-member districts of majoritarian methods, district lines can determine election outcomes. Gerrymandering—the idea that political parties draw district lines to give themselves an unfair edge in winning legislative seats—has gotten a lot of attention recently. (See videos by Washington Post, Vox, and John Oliver, and commitments from Eric Holder and Arnold Schwarzenegger.) Indeed, line-drawers can “crack” like-minded voters, parcelling them out among districts in such a way that, despite their large numbers, they aren’t able to elect a fair number of legislators (illustrated here, as scenario 3). Or they can “pack” similar voters into certain districts, causing many of their votes to be wasted on a candidate who was already guaranteed to win in that “safe” district, but leaving surrounding districts up for grabs to the other party, because opposing voters have been rounded up into a single district.
But even without nefarious pen-wielding, simple demographicchanges based on similar people choosing to live in similar places, can make district lines all-important. If a computer drew compact districts, but one district encompassed an urban area that was 71 percent Democrat, and the surrounding four suburban districts were each 51 percent Republican, the map would look well-proportioned and logical, but it would not be very “small d” democratic. Fifty-three percent of voters in the overall area would have voted for Democrats, but their legislators would be 80 percent Republican.
There is no fair way to draw single-member district lines. Single-winner districts prioritize geography above all else, assuming that their census precinct is the most important thing the voter wants represented and limiting voters’ right to elect a legislator who represents their political ideology, race or ethnicity, economic class, or life experience. No matter who does it, what the criteria are, the process used, or where the lines are ultimately drawn, some voters in each district will have less representation than others. The unfair impacts of district lines typically last for a decade, are not responsive to changing issues or changing voter preferences, and often persist during redistricting exercises.
Proportional methods use larger districts to ensure that voters, not lines, choose the winners. In this illustration from the Washington Post, using one five-member district instead of five one-member districts would ensure voters could achieve fair results no matter what. No one could “crack” or “pack” a five-member district into hugely unfair results. Any group of voters making up at least 17 percent of the population would be able to elect a representative.
For example, if 17 percent of voters preferred a Green Party candidate, and the rest were evenly split between Democrats and Republicans, the district would elect one Green, two Democrats, and two Republicans, no matter who drew the lines. This is the best way to permanently gerrymander-proof elections, far more reliably than redistricting.
With majoritarian methods, each candidate must win a majority (or a plurality, if there are more than two candidates) of the vote. The inevitable corollary is that a minority (and sometimes a majority) of voters voted for the loser(s). Only voters who agree with the majority (or at least the plurality) of other voters have any hope of voting for the winner. Voters with minority views can vote until the cows come home, never vote for a candidate who actually goes to the capitol, and consistently be “represented” by someone with an opposite agenda. In the example above with the one urban and four surrounding suburban districts, 29 percent of voters in the urban district and 49 percent of voters in the suburban districts might never vote for a candidate who wins. Here in Cascadia, progressives in Walla Walla might never send a representative to Olympia, and be told they are “represented” by a conservative who does not actually fight for anything they value. Conservatives in Portland might vote but never have someone they can call in Salem.
When electing an executive—a mayor or president—only one person can win. Even if that person is a broadly popular consensus candidate, many voters will have voted for someone who lost. That’s just math. But the same math need not apply to legislatures. In a country with 535 legislators, or a city with seven city council-members, nearly all voters should be able to cast a vote for someone they support, and have a chance of seeing that person win one of the many available seats.
But in our current system, voters in the minority can turn in their ballots year after year with no legislator to show for it. The futility of voting can frustrate voters and make them, understandably, question whether the legislature represents them. They might drop out of civic life altogether or rage against a system that seems rigged against them.
With proportional election methods, every voter who agrees with some minimum number of other voters will vote for a winner. The minimum number could be as low as a few percent of voters, especially in List Voting countries, or as many as one-quarter of voters, in a three-member district using Ranked-Choice Voting, for example. Even voters with minority views—so long as their view is shared by somewhere between a few percent and 25 percent of other voters—can elect a legislator. Almost all voters will know, as they fill out their ballot, they are voting for at least one winner.
Some may be concerned that allowing most voters to elect a representative will allow destructive extremists—for example, neo-Nazis—to infiltrate the legislature. But allowing minority voices a seat in the legislature does two things that can actually help diffuse extremist fervor. First, it ensures all voters feel heard and invested in the system, reducing the chance that disgruntled groups will undermine the institution of governance by leveling a legitimate complaint that the “democracy” does not include all voices, but instead is rigged against certain people. Malcontented attacks can erode trust in the entire government and incite support for false solutions such as tearing down the systems that protect us.
Second, it differentiates and clarifies each party’s purpose. Many Americans don’t see a great deal of difference between what the two parties stand for, and less than one-third of millennials see a great deal of difference. In contrast, while far-right parties have been gaining support across Europe, they are differentiated enough from other parties—even those on the “same side” of the political spectrum, that it is clear to voters what those parties stand for, and voters who don’t agree can keep their distance. Far-right parties can win seats in proportion to their support (if 20 percent of voters are far-right, the far-right party can win 20 percent of the seats), but they can’t pass policies without finding common ground with a majority of representatives.
In the United States, far-right positions are folded into one of the two major parties, meaning that when center-right voters vote for the one major right-leaning candidate, they can’t be sure to what extent they are enabling a far-right agenda simply because they don’t want to vote for the leftist candidate. Same on the left: center-left voters vote for the left-leaning party but aren’t sure if their policy priorities are a match overall.
Blocking everyone with a minority view—whether they be a far-right party, the Green party, or the People Before Profit party—from the legislature is not the most effective method for protecting against extremist views. A strong bill of rights and a just legal system can protect basic rights best. An electoral system that systematically excludes citizens from representation by leaders they agree with—even with minority or extremist views—might well lead to the sort of anti-establishment groundswell we’ve seen exemplified in the Brexit vote in the (majoritarian) United Kingdom and the election of Donald Trump in the (majoritarian) United States.
With majoritarian election methods, two major parties dominate the legislature. In the United States, Democrats and Republicans control 99 percent of congressional seats. Even in Canada, where the parliamentary system allows for more party diversity, the two major parties dominate, holding 83 percent of seats in parliament. One of the results of a lack of diversity is a lack of depth—as in deep understanding, focus, and energy on issues and solutions.
Party identity, rather than policy positions, defines candidates, and they tend to stick to safe and shallow slogans and soundbites aimed to appeal to as many voters as possible. They don’t dare get too specific or talk about innovative solutions, for fear of turning off some voters. They promise “no new taxes” or “build the wall” or “drill, baby, drill,” or “clean energy jobs,” but don’t go into about any details, paying for the wall (when there are no new taxes), for example or how other options compare with drilling in terms of jobs, safety, and long-term impacts, or exactly whom will get the new jobs. Each side declares it will “repeal and replace” or “defend” or “fix” the Affordable Care Act, but neither talks about the complex questions of how to measure the value of health care services and align incentives to ensure people are getting the best value.
The pandering to feel-good phrases and simplistic solutions is on full display in the discussion of crime and safety. Politicians talk about being “tough on crime,” but they don’t talk about the complex causes of crime or patterns of systemic discrimination and long-term solutions, such as prevention, criminal justice system reform, mental health services, rehabilitation, and restorative justice. Locking up nearly 5 percent of the population and paying to keep them imprisoned is not a sustainable situation. The (majoritarian) United States imprisons far more people than any other country in the world. On average, majoritarian countries imprison 60 more people per 100,000 than do proportional countries.
In majoritarian elections, the safest strategy of all, unfortunately, is to talk about candidates’ personal characteristics—their fashion choices, their personal fitness for office, their perceived health or age, sexual proclivities, musical talents, and so on. Media coverage of the 2016 American presidential campaign was strikingly skewed towards personal scandal with shockingly little discussion of policy issues. American voters were highly informed about Hillary Clinton’s email server and Donald Trump’s Access Hollywood video, but knew very little, beyond a few shallow slogans, about what either one would do about the economy, the environment, healthcare, mass incarceration, immigration, or most other pressing issues.
This isn’t just because the media are obsessed with scandal and clicky headlines; it is what it takes to win with majoritarian methods. Candidates spent most of their ad time talking about character, not policy, and that has been true in the United States and Canada for a long time.
With proportional election methods, smaller parties win seats and therefore win a share of the megaphone during campaigns and during legislative negotiations. Party diversity brings competition in the “marketplace of ideas,” forcing even the big powerful parties to deepen their positions and discuss them.
New Zealand switched from a majoritarian to a proportional method in the 1990s, and much changed:
Media coverage of candidates’ personal characteristics dropped by one-third;
Coverage of all substantive issues more than tripled;
Coverage of environmental issues more than tripled, while coverage of social issues such as immigration, race relations, and children and families doubled;
The major parties, which had previously been fewer than 9 points apart on a 200-point political index, shifted to 45 points apart, making it easier for voters to differentiate their policies. Minor parties staked out even more diverse positions, exposing voters to more than double the range of policy options.
Candidate and party statements about policy issues evolved from a few bland slogans (for example, “education is working” and “there will be no new taxes”), to deeper discussions of specific policy solutions—for example, highlighting the effects that tax cuts would have on student fees, the benefits of national testing, voucher programs, free pre-school, scholarships, apprenticeships, and potential impacts of no-interest student loans.
The United Kingdom offers a similar natural experiment for comparing majoritarian and proportional methods. Like the United States and Canada, England uses a majoritarian method to elect its national legislature. But like all European countries, its European Parliament representatives (until it exits the EU) are elected through a proportional method. For its EU representatives, Great Britain is divided into 11 districts, each electing between three and ten members from party lists. Comparing the results of these elections with those of the England’s national elections, notably from the same time period, with the same voters, and in the same place, confirms that voters hear more about policy and about a greater variety of policy options in proportional elections than in majoritarian ones.
Greater attention to policy in proportional countries leads to more innovative policy solutions. By giving minor parties the opportunity to bring up sensitive, non-mainstream, and more detailed policy proposals, proportional countries grapple with the implications of different policy paths. Because more issues and more possibilities get discussed, proportional countries move more quickly to adopt new solutions. For example, majoritarian countries have taken more than twice as long to adopt civil union or marriage equality laws, compared with proportional countries.
Proportionally elected legislatures also create more durable policy than legislatures elected with majoritarian methods. Researchers have characterized majoritarian governments as operating with a strong but unsteady hand: the party in charge can decisively pass policy, even if it has not been fully vetted or is opposed by major sectors of the society. Majoritarian political systems with single-member districts are prone to “pork-barrelling”—passing policies that benefit the home districts of the ruling party, even at the expense of the country as a whole. The groups left out or ignored become enraged and seek to wrest control away from the ruling group and reverse the policy. As the country seesaws between ruling parties, policies are constantly being relitigated and reversed.
Proportional governments’ grasp is gentler, but steady. During the campaign and policy-making process, minor groups are able to bring up dissenting points, ensuring that policies are well thought out. The governing coalition must include as many groups as possible in the decision-making process. Policies that pass are unlikely to disservice large swaths of the population or to be overturned because most voters’ representatives had a role in shaping the policy.
Sometimes private interests are aligned with the greater interests of the society. But sometimes industries reap profit at the expense of workers and citizens. For example, companies can boost profit by marketing sugary foods to children at the expense of those children’s health and wellbeing and of other people’s wallets, too, because everyone pays spiraling healthcare costs from the resulting obesity epidemic. Fossil fuel corporations benefit by foisting the costs of their pollution on communities and limiting competition from clean sources of energy, but everyone suffers from the resulting pollution.
A well-functioning democracy generates broad benefits for its members. To do that, it must ensure that special interests don’t drown out everyday people’s voices. Ideally, elected representatives make sure that companies are able to prosper and create products and jobs, but that the jobs are good jobs, the products are safe products, and competition drives innovation that helps the community prosper. In the current system, extractive private interests often wield so much power and influence that their priorities come before those of workers and families.
Majoritarian political systems have many small groups working hard to represent different aspects of the concerns of workers, families, and communities. But as they are each fighting to get traction for their issues, the more powerful and concentrated voices of corporate special interests often drown them out. The big money interests may dominate the major political parties, splintering and pushing aside the smaller groups.
Proportional political systems tend to have a few strong, coordinated interest groups, each of which has an important seat at the negotiating table. Business, labor, and government come to comprehensive agreements based on an “ideology of social partnership.” If extractive corporate interests capture one or both of the major political parties, smaller parties that make a point of objecting to disproportionate corporate influence will gain power.
The results of these different negotiations can be measured in several concrete ways:
Majoritarian countries have higher income inequality than proportional countries. The average majoritarian country has a Gini index more than 9 points (out of a possible 100) higher than the average proportional country. In other words, in majoritarian countries, more of the wealth flows to those at the top. This is in part a result of corporations and elite economic interests manipulating tax policy to their benefit in majoritarian systems but being restrained by the consensual negotiations more common in proportional jurisdictions.
Proportional representation countries have half the rates of obesity that majoritarian countries do, partly a result of regulations on marketing to children.
Proportional countries use more than twice as much renewable energy as do majoritarian countries, largely due to policies promoting renewable energy use.
Proportional countries have slowed their carbon dioxide emissions more than four times as quickly as majoritarian countries, largely due to policies aimed at slowing global climate change.
The best election reform options for Cascadia
Clearly, proportional election methods win. But which proportional method should reformers in Cascadia push for? Sightline’s view is that advocates should prioritize the election methods that work best and are most likely be used in other cities, counties, states, and provinces across Cascadia, in order to make sure that the effort required to win each reform builds momentum for future wins. In other words, the best systems in Cascadia are those that provide diverse representation, can do so at multiple levels of government so that Cascadian cities, counties, state and provinces can try them out, and preferably, have a track record that can help voters be willing to give reform a try.
Multi-winner Ranked-Choice Voting, a.k.a. Single Transferable Vote, can be used in local or nonpartisan elections, which could help introduce Cascadian voters to the concept and build momentum for reform up the chain. Multi-winner RCV, which is only currently used in three elections in the United States, requires multi-member districts. Many cities in Oregon and British Columbia already use multi-member districts and Bloc Voting, and could just switch to ranked ballots with no other changes and have proportional representation—voila! But other cities and counties as well as states, provinces, and the federal government would need to change the way they think about districts—and that’s an undoubtedly heavy lift. But with that change, cities, counties, states, and provinces in Cascadia could adopt multi-winner RCV and build momentum for sweeping reforms at the national level.
Voters are often reluctant to make big changes to electoral methods, but they may be more willing to adopt reforms that have a track record close to home. For example, Maine voters who adopted Ranked-Choice Voting for state and federal elections may have been reassured that voters in Portland, Maine had used ranked-choice voting and found it to produce more civil campaigns with broader voter outreach. Here in Cascadia, voters may be interested to hear that Benton County, Oregon, passed a Ranked-Choice Voting initiative in 2016 and even more interested to know how the first election goes in 2018. On the other hand, Cascadian voters who hear that Pierce County tried Instant Runoff Voting and repealed it may be anxious to understand why, and reassured that thirteen US cities and counties already use Ranked-Choice Voting, with proven enhancements to the tone of races and voters’ ability to express an opinion about more than one candidate.
Mixed-Member Proportional Voting could be a great solution for federal, state, and provincial elections. Because it retains some single-member districts, it might be an easier transition for American and Canadian voters. Indeed, voters in one Canadian province recently decided to adopt Mixed Member Proportional. New Zealand transitioned from majoritarian to proportional representation by adopting Mixed Member Proportional, with its mix of single-member districts and larger, party-based districts. Because it is party-based, Mixed Member Proportional could not be used in local nonpartisan elections, so it would need to go straight to a win at the state or national level, without testing in local jurisdictions first.
Cascadian cities and counties could use Cumulative Voting in multi-member districts to achieve fairer representation. Cumulative Voting already has a track record in dozens of American jurisdictions, and would involve a relatively simple change to ballots. However, it might not achieve all the benefits of proportional representation described above.
Cities and counties could introduce Reweighted Range Voting or Multi-Winner Score Runoff Voting and potentially achieve proportional representation. However, the pitch to voters would be more challenging since neither these methods, nor any form of score ballot has been used in any public elections anywhere in the world.
Party List Voting is the most proportional of election methods. Because list methods use large districts and party-based voting, they could not be used in local or nonpartisan elections. American voters would likely balk at Closed List Voting, which only allows voters to choose a party and not a candidate. Open List Voting, which allows voters to choose their favorite candidate from party lists, could be more palatable in North America, with its tradition of candidate-focused, rather than party-focused, elections.
Conclusion
Prime Minister Trudeau’s 2015 campaign promises of electoral reform indicated Canadians’ growing impatience with first-past-the-post voting, and many Americans are also feeling that elections leave much to be desired. Proportional election methods lead to better representation, more voters with more power to elect officials that represent them, less or no risk of gerrymandering, healthy competition among parties presenting policy ideas, and innovative laws that take more voices into account in crafting durable solutions.
Sightline would like to see Cascadian cities, provinces, and states adopt proportional Ranked-Choice Voting or possibly Mixed-Member Proportional Voting for states and provinces. Doing so would improve governance across the region while showing the way for better national methods as well.
Glossary of Methods for Electing Legislative Bodies
Editor’s note: We added three “made-in-Canada” Proportional Representation methods below: rural-urban, local, and dual member. Because of the Trudeau administration’s promise to move off of first-past-the-post voting, and BC’s impending referendum on electoral reform, Canada has been a hot bed of thinking around how to customize the benefits of Proportional Representation to the specifics of North American elections.
The legislative branch is the branch of government meant to “be dependent on the people alone.” All voters should feel they have a representative to voice their concerns in the federal, state, or provincial legislature, as well as on the county council, city council, and school boards. Yet in North America, these bodies often reflect only the largest group of voters, leaving other groups without a voice.
What other options do we have for electing a legislative body more representative of their diverse constituencies? This glossary summarizes how different election methods work for electing multiple people to serve in a legislature, their strengths and weaknesses, and how they have played out in real life.
This document doesn’t describe all the possible election methods, nor does it detail all of the quirks of each method. Rather, it is meant as a quick reference guide to give readers a sense of each method. This Glossary and the accompanying Guide to Methods for Electing Legislative Bodies are specifically about electing legislative bodies of government—that is, where more than one person serves in the same body at the same time. For example, state legislatures, provincial parliaments, and city councils are all multi-member legislative bodies. (For a discussion of election methods for electing executive offices where only one person serves at a time, see our Glossary and Guide to Methods for Electing an Executive Officer.)
Legislative election methods generally fall into two families:
With Majoritarian methods, used in the United States and Canada, all or most legislators represent majority views while minority groups do not have fair representation. Usually, two major parties representing the social or political majority dominate the legislature.
With Proportional methods, used in most developed countries, legislators more fairly represent the diversity of voters. Usually, several parties representing a diversity of social and political views win seats in proportion to the votes they receive.
This document also describes two systems in each of the following two categories:
With Semi-proportional methods, used in local elections across the United States, minority social or political groups have a chance to win seats.
Potentially Proportional methods have not been used in any public elections, but might achieve proportional results.
The advantages and disadvantages of each category apply to all methods in that family, and each method has some unique advantages and disadvantages.
Also called “plurality,” “majority,” or “Westminster model” methods.
With “majoritarian” methods, voters in the major social or political group are able to elect all or most of the legislators. Voters with views in the minority have few or no seats. Minor parties may win some seats, but not proportionally to their numbers of voters, and two major parties usually dominate the legislature.
Many majoritarian methods use single-winner races, which includes both single-member districts and at-large posted seats where the legislator in each race must win either a plurality (more votes than any other candidate, but not necessarily a majority) or a majority (more than half) of the votes in that district. In each of these races, a candidate representing majority views is most likely to be the one winner, so someone representing minority views rarely wins a seat.
All majoritarian election methods share the following advantages and disadvantages, but each has its own specific advantages and disadvantages.
Advantages
Ballots are simple.
Voters have a clear choice between two “big tent” parties. Political choices are not fragmented into many minor parties.
One big tent party is in control of the legislature and can enact cohesive policies. The opposing party can check the other party’s power and give voters a coherent alternative policy view.
It may be hard for extreme candidates to win legislative seats (except when party primaries and “safe” districts let them in).
Disadvantages
Minority groups, whether political, religious, racial, ethnic, or other, are excluded from fair representation.
Many voters feel they waste their votes, because they almost never have the experience of voting for a candidate who actually wins. This pattern can alienate and discourage voters and mobilize movements against the whole system.
Majoritarian countries have lower voter turnout than proportional countries.
Candidates in majoritarian methods are more likely to promise quick fixes than to seek long-term solutions to complex problems.
At first glance, majoritarian systems seem to promote “majority rule,” but in reality a majority of legislators, each representing a majority of voters in their districts, can pass legislation that does not represent the majority of voters in the country (because the minority of voters in their districts, and arguably all of the voters in the districts of the legislators who did not vote for it, had no say).
Legislators can be elected through single-winner races—a race where only one candidate will win a seat, as opposed to multi-winner races where candidates run in a pool for several available seats—using any of the election methods described in the Glossary of Methods for Electing Executive Officers. Single-winner legislative races can occur in single-member districts (or “ridings,” in Canada), numbered seats within a district (like Washington’s state representatives), or at-large numbered seats (like Portland’s city council).
Electing legislators with single-winner races, even with ranked-choice or score voting, leads to majoritarian results, where the social or political majority wins almost all the seats and, usually, two major parties divide most of the power. Parliamentary systems like Canada’s yield slightly more diversity of party representation than Presidential systems like the United States’, and Duverger’s Hypothesis predicts that Top-Two Runoff makes it easier for third parties to win sometimes (though the evidence indicates this is not necessarily true), but single-winner elections for legislative seats always yield less-than-proportional results.
In a single-member district, voters in a geographic district have a direct link to their representative. They know who their local representative is and can call her to voice concerns, or refuse to vote for her again if she doesn’t represent them well. (Some proponents of single-winner districts say it is easier to for voters to “throw the bums out,” but in reality, in the United States, incumbents almost always win re-election.)
The legislature represents the geographic diversity of the city, state, province, or nation.
Voters can vote for an individual candidate (and if the jurisdiction allows full fusion voting, voters can also indicate a preference for a party).
Disadvantages
Single-member districts are vulnerable to gerrymandering. With slight changes to the district lines, a district can shift from being safe for one major party to being safe for the other major party, allowing the line-drawers, not the voters, to determine how many seats a party can win.
Even without intentional gerrymandering, one party can win control of the legislative branch even though another party won more votes. For example, in 2012, Republican candidates won just 47.6 percent of the vote (compared to Democrat’s 48.8 percent), yet Republicans then controlled the US House of Representatives.
Voters in the minority cannot hold their representative accountable. A Democratic representative won’t feel very accountable to a Republican voter in her district because she knows he didn’t vote for her, and it doesn’t matter if he doesn’t vote for her again.
The legislature does not represent the ideological diversity of the city, state, province, or nation.
Single-member districts may force candidates to raise more money to be successful.
In nonpartisan races, voters cannot indicate a preference for any party, and in partisan races without full fusion voting, voters may not be able to indicate their preference for a minor party.
Original Sightline Institute graphic, available under our free use policy.
In bloc voting, candidates run in a common pool for multiple available seats. The pool could be for the entire jurisdiction (city-wide or country-wide) or for a multi-member district. Voters can cast as many votes as there are seats available, and the top vote-getters win the seats.
If voters with a majority view cast their votes for a slate of candidates with majority views, that slate will sweep the entire election, even if voters with minority views cast all their votes for candidates with minority views.
However, Bloc Voting has been proven to elect more women than single-winner races. Parties may be more inclined to include a woman in a list of candidates running for a pool of seats than they would be to run a woman in a single-winner races. And voters are more inclined to include a vote for a woman candidate when they can, for example, “Vote for Five,” rather than when they have only one vote.
For example, New Hampshire uses a mix of single-member and multi-winner districts to elect the state legislature. Generally, one party dominates each district and wins all of the seats. However, in 2012, Republicans lost six seats in districts they otherwise dominated. All six seats went to Democratic women candidates. The Republican party hadn’t included enough women in its list of candidates, and it appears that voters were willing to cross party lines to elect a woman when given a chance to choose more than one.
More than one hundred cities in Oregon use this method for their respective city councils. For example, Lake Oswego voters can “Vote for Three” candidates from a pool, and the top three vote-getters win seats on the city council. Vancouver, BC, and many other Canadian cities use Bloc Voting to elect city councils.
Advantages
Bloc Voting elects more women than single-member districts or at-large numbered seats.
Compared to single-member districts, multi-member districts may allow candidates to run less expensive, successful campaigns, in part because they may run in a slate and share costswith other candidates.
Bloc Voting may result in even more disproportionate results than single-winner districts because it may allow the prevailing social majority (for example, the majority racial or religious group in the district) or the dominant major party to win all or most of the seats on the ballot, leaving minority voices with little or no representation. For example, New Hampshire uses Bloc Voting to elect members of its state house of representatives from districts with between two and twelve representatives each. In 2016, in 77 percent of those districts, one party won all the seats. Even in districts with 10, 11, and 12 representatives where 40 percent of the voters wanted representatives from the other party and, proportionately, should have won four or five of the seats, those voters got zero representation.
Also called “fair representation” or “consensual” methods.
With proportional methods, the legislature reflects the social and political diversity of the voters. When societies have ethnic, religious, or other cultural or political divisions, each group has the chance to elect representatives they support to the legislature. If 40 percent of voters prefer one political party, that party wins 40 percent of the seats. Or if 20 percent of the voters want representatives of color, people of color win 20 percent of the seats. Although some countries or political parties also make use of quotas or reserved seats for women or for ethnic minorities, the methods below can achieve proportional representation of ideological diversity and often elect more women and people of color though individual votes, not quotas.
Voting experts sometimes call these “consensual” systems because legislators must work together to craft broadly acceptable solutions. Most advanced democracies, and all countries electing members of the European Parliament, use some form of proportional representation.
Advantages
All voters, no matter their political party, religion, race, ethnicity, or gender, can achieve fair representation. The legislature represents the diversity of the city, state, province, or nation.
Proportional methods mitigate the power of gerrymandering, because parties can only win more seats by winning more votes, not by drawing district boundaries.
They reduce “regional fiefdoms” where one party controls all the seats in a region.
Proportional methods lead to greater continuity and stability of policy. Policy often takes longer to pass, but is more stable over time because many different groups helped shape it, so it is not thrown out as soon as a different party wins more seats.
More people participate in elections and vote.
Decisions are more transparent and inclusive because they are carried out publicly between multiple parties rather than behind closed doors within a party.
Disadvantages
If thresholds for participation are too low, proportional methods may lead to extreme multi-party fragmentation. (Some theorists suggest there is a tradeoff between policy stability and government stability: in other words, countries with proportional parliamentary systems will shift coalitions frequently but maintain steady policies, whereas countries with majoritarian presidential systems will have stable parties but many policy flip-flops.)
Candidates with extreme views can win seats in the legislature.
The Speaker of the House or President of the Senate will be a member of a party that likely won less than half the votes. (However, she will be the head of a coalition that likely won much more than half the votes.)
If districts are too large, legislators may lose their geographic link to voters. (However, if geography is important to voters, in most proportional systems they can vote for a local candidate or party and elect that person. In List systems, the parties usually take geographical diversity into account when creating their lists.)
Voters may not be able to throw a centrist party out of the ruling coalition, so long as that party is able to come to agreement with the other parties.
Many proportional ballots are more complex than “vote for one” ballots.
Original Sightline Institute graphic, available under our free use policy.
Single Transferable Vote (STV) is a multi-winner form of Ranked-Choice Voting (RCV). Multiple candidates run in a common pool in a multi-member district, so several of them will win office. Ideally, districts each elect five members, though three and seven also work well. Voters rank their candidates in order of preference, and if a candidate reaches the winning threshold, she wins a seat. All votes for candidates who received too few first-place votes, plus fractions of all votes above the threshold for a candidates who already won a seat, are transferred to voters’ next-choice candidates who are still in the running. Counting and transferring continues until enough candidates have reached the winning threshold. (Two videos explain, using jungle animals and post-it notes.)
As in the single-winner form of Ranked-Choice Voting, known as Instant Runoff Voting, voters get just one vote per round, and a candidate must have sufficient votes in a given round to make it to the next round.
Let’s take a hypothetical case for a Northwest legislative body. If Oregon were to elect its 60-member house of representatives using multi-winner Ranked-Choice Voting, it could, as one option, divide the state into 12 districts (each a bit more than twice as big as current state senate districts) and elect five members from each district. Voters would elect their five representatives by ranking candidates on a ballot like the one above.
Single Transferable Voting is used in Cambridge, Massachusetts, Ireland, Australia, local elections in Scotland and New Zealand, and for Academy Awards nominees. More than a dozen US cities used multi-winner ranked-choice voting in the early 20th century. STV cities elected diverse councils, including people of color and minor-party representatives, leading to successful repeal efforts. In 2004, a British Columbia citizens assembly (two people randomly selected from each electoral district) studied election methods and recommended STV, a.k.a. multi-winner Ranked-Choice Voting. A 2005 referendum to use STV in BC elections won 58 percent of the popular vote, but needed 60 percent to go into effect.
Advantages
Voters can vote for individual candidates, not just for a party.
As long as districts are not too large, or voters vote for local candidates, legislators retain a geographical link and accountability to voters.
Voters can hold representatives accountable. Each voter will almost always have at least one representative for whom they voted, and they can call that representative up or refuse to vote for them again.
Voters don’t need to be organized to achieve fair representation—they can just vote their preferences.
Voters can vote for the candidates they like best to represent their region, their ideological views, and their life experiences, without worrying that ranking a less preferred candidate could cause their favorite candidate to lose and with few concerns about choosing the “lesser of two evils.”
Because it is not party-based, it can be used in local or non-partisan races.
Disadvantages
The ballot is more complicated than “vote for one,” and the counting is complicated.
If the number of representatives for a multi-member district is too small, results will not be highly proportional. For example, in a two-member district, candidates with support from less than one-third of the voters won’t be able to win a seat.
A candidate without enough top rankings will get eliminated, even though she had more subsequent rankings than other candidates and so would have won a seat had she remained in the contest. (Over the years, electoral tinkerers have attempted to “fix” this, for example by adding eliminated candidates back in in future rounds, but such fixes could suppress voters from ranking additional candidates, for fear that those additional rankings will cause their more-preferred candidates to lose. If candidates don’t rank additional candidates, the method might not achieve proportional results.) (However, this can also be considered an advantage, because it is part of what allows this method to achieve proportional, not majoritarian, representation.)
Original Sightline Institute graphic, available under our free use policy.
Mixed Member Proportional (MMP), also called the “additional member system,” is a hybrid, electing some representatives in single-member districts and some from multi-member regional or nationwide districts. Voters get two votes: one for your local district representative and one for a regional or national party. Regional or national seats are assigned to ensure each party’s share of the total legislative seats is proportional to its share of the vote, and the party chooses which candidates fill its seats. (Videos explain here and here.)
As an example, if Washington were to elect its 98-member state house of representatives using Mixed Member Proportional, it could, for example, establish 48 local districts, each about the same size as the state’s current 49 legislative districts, and with one representative each whom voters would elect in the same way they do now. The other 50 members could come from 10 regional districts, each the same size as a federal congressional district, and with 5 representatives from party lists. Voters would elect these members by voting for a party, as in the ballot above. Voters would have one local representative and also five regional representatives in the house.
Germany, New Zealand, Scotland, Wales, and several other countries use Mixed Member Proportional voting to elect their national legislatures. Most of the gains for women and people of color come from the multi-member districts, not the single-member districts. Prince Edward Island, a province on the east coast of Canada, voted in 2016 to adopt Mixed Member Proportional Voting to elect its provincial legislature.
Advantages
Under Mixed Member Proportional Voting, local representatives retain a geographic link to their voters.
Voting for one candidate in a single-winner district would be familiar to American and Canadian voters.
Ballots are relatively simple.
Because voters retain a local representative, the regional districts could be larger, allowing for more proportional results than STV.
Disadvantages
With MMP, the local districts still use single-member districts and so are vulnerable to gerrymandering.
Because the regional list is party-based, it can’t be used in local nonpartisan races.
In rare cases, it could lead to a party strategically telling voters to vote for a different candidate in order to keep its national seat(s).
List Voting, which comes in both Open and Closed forms, is the most common form of proportional representation. Candidates run in large multi-member districts or sometimes statewide, provincewide, or nationwide, depending on the jurisdiction of the legislature. The ballot lists candidates by party.
In Open List Voting, voters can vote for their favorite candidate within a party list, and their vote will count for both the candidate and the party. The party wins seats in proportion to the number of voters who chose any candidate on their list, and the candidates who won the most votes fill the seats. Open List Voting gives the party the power to choose who appears on its list, but gives voters the power to express which candidate they like the best.
For example, if all Republican Party candidates collectively won 60 percent of the vote in a three-member district, Republicans would win two of the three seats. If Rex Rural and Rachel Right were the top two Republican vote-getters, they would get the seats. Voters who chose Henry Hawk would not get their favorite candidate, but they would contribute to electing two Republicans in their district.
Original Sightline Institute graphic, available under our free use policy.
If Oregon were to elect its 60-member house of representatives using Open List Voting, it could, for example, divide the state into 12 districts, each a bit more than twice as big as current state senate districts, and with five members from each one. Voters would vote for their one favorite candidate, listed by party on a ballot like the one above, and the top five would represent that district.
In Closed List Voting, voters cast one vote for a party, and the party assigns candidates to seats in the order listed on the ballot or on the party’s list. Closed List Voting gives parties the power to order the list, and voters must accept that order.
For example, if one-third of the voters in a three-member district chose the Independent Party, the party would win one of the three seats, and the seat would go to Elijah End Corruption, the candidate listed first on the ballot.
Original Sightline Institute graphic, available under our free use policy.
Because this method usually elects dozens of members per district, List Voting achieves highly proportional results; people making up even just a few percent of the population can win representation.
Disadvantages
Because voters don’t have a say, with Closed List methods, in which individual candidates are elected, the link between legislators and constituents can be tenuous.
The parties have a lot of power, especially with Closed List methods. Americans may not be comfortable with strong party power.
Especially in parliamentary systems where several parties must form a coalition government, small parties may hold larger parties to ransom in coalition negotiations.
Because it is party-based, it cannot be used in local nonpartisan elections.
Rural-Urban Proportional Representation (R-U PR), a “made-in-Canada” solution, uses Single Transferable Vote in urban and suburban areas and Mixed member Proportional in rural areas. Rural districts can retain their local representation with single rural districts, but the overall legislature will be fairly proportional. Only about 10-15 percent of the seats need to be used for top-up purposes in R-U PR, as compared with 35 to 50 percent of seats with MMP.
Local single-winner districts in sparsely populated rural areas. The ballot could be ranked or “vote for one” plurality.
Suburban and urban voters would see a multi-winner ranked ballot electing two to six representatives per district.
Rural voters might see a Mixed Member Proportional ballot where they could choose their favorite local representation and their favorite party. Or, they could see a traditional First Past the Post ballot and regional top-up winners would be the strongest remaining candidates from the local elections.
Here’s a hypothetical example of how it might work in British Columbia’s provincial elections. BC has 87 Members of the Legislative Assembly (MLAs), each elected from a single-winner district. Rural-Urban PR might:
Elect 75 local MLAs:
8 from rural districts—1 from each of eight single-winner rural districts
12 from suburban districts—three each from four multi-winner districts
55 from more urban districts—five each from eleven multi-winner districts
Elect 12 top-up regional MLAs—the strongest additional candidate from each of twelve regional districts encompassing several smaller local districts
Advantages
Highly proportional.
Local representatives retain a close geographic link to their voters.
Voting for one candidate in a rural single-winner district would be familiar to American and Canadian voters.
Few top-up seats are needed, and they can come from natural regions of moderate size, not just the province at-large.
Local Proportional Representation keeps existing ridings or districts, but allows voters to vote for candidates across a larger region. It combines four to seven existing local ridings into a region and lists candidates based on the local riding they are from and their political party. All voters in the region can rank as many candidates as they wish, regardless of riding or party. One candidate from each riding wins a seat.
Votes are counted in rounds, with first-choice votes counted first. If no candidate reaches the quota with first-choice votes, the candidates with the fewest votes is eliminated and his or her votes are redistributed to the next-ranked candidates still in the running. When a candidate reaches the quota, she or he wins a seat and all other candidates from that riding are eliminated. In the next round, all candidates are in the running again, except for those in the riding that was already decided. Excess ballots for the candidate elected in that riding are fractionally distributed, as in STV, while ballots for eliminated candidates (all other candidates from the riding where one candidate won) are distributed to the next-ranked candidate. Counting continues until one candidate in each riding wins.
Local PR evolved from a proposal submitted to the federal Electoral Reform committee by Byron Weber Becker and Antony Hodgson (Fair Voting BC) in response to an invitation to produce a voting system design similar in concept to the Rural-Urban PR model (see above) that could be implemented without changing existing riding boundaries. The advocacy group, Democracy Guelph, extended and refined this idea and lobbied for it under the name Local PR. Below is a sample ballot with ridings in Guelph, Ontario.
Original Sightline Institute graphic, available under our free use policy.
Advantages
Retains the same number of ridings and the same number of representatives currently in place.
Guarantees geographic diversity of elected representatives.
Local representatives retain a close geographic link to their voters.
Matrix-style ballot will initially be unfamiliar to voters.
Like the current system of single-winner ridings, Local PR could result in uneven quality of candidates if some ridings have a strong field and others have a weaker field of candidates.
In some ridings, the candidate who wins the seat may not have won the most first-choice votes from voters in the riding.
Dual Member PR (DMP), also known as Dual-member Mixed Proportional, is a made-in-Canada variant of MMP. DMP elects half the legislature from local districts and, like MMP, elects the rest to achieve party proportionately based on each party’s share of the overall regional vote. But where New Zealand-style MMP uses two separate ballot items (one for your favorite local representative, and one for your favorite party), DMP uses one simple, familiar, “vote for one” ballot, but with up to two candidates and their party on each ballot line.
The total number of representatives stays the same, but the number of districts is halved, so each riding (or district) has twice the number of voters as now and elects two representatives. In Washington, where each state legislative district already elects two representatives each, the number of districts could stay the same with DMP.
Voters would see a ballot like the one below, where each party gets to list up to two candidates per riding. The party picks which candidate is listed first and which second. Voters fill one bubble that counts for both candidates and their party. Alternatively, each candidate could have their own line, so voters could choose the candidate they prefer. In each riding, the candidate with the most votes wins the local seat. Then election officials would determine what share of the overall votes each party received, how many seats that party already won in the local races, and how many more seats it needs to achieve proportionality. It then fills those seats with the candidates from the appropriate parties who received the most votes in a riding. The first local winners are selected by plurality, just like now. Each riding has two representatives, and the legislature overall represents the party preferences of the voters.
The group DMP for Canada has used actual votes from provincial and federal elections in Canada to simulate how the election would have turned out with DMP.
Original Sightline Institute graphic, available under our free use policy.
Advantages
Simple, familiar ballot.
Proportional results (based on party affiliations).
Disadvantages
In the variant pictured above, voters have only one mark on the ballot, meaning they can’t indicate support for the second party candidate over the one the party listed first, nor for a party other than the one their favorite candidate is a member of, nor for additional candidates beyond their favorite.
About 65 percent of voters would have an MLA they specifically voted for. This is still much better than the 50 percent with single-winner districts and first-past-the-post voting, but not as good as the 90 percent or more with Rural Urban, Local PR, STV, and Open Party Lists.
The two methods below can achieve proportional results but are not guaranteed to do so. If voters in a political, racial, or social minority all vote in a cohesive bloc for their preferred candidate and no one else, they can attain representation. However, if voters in a minority split between two similar candidates then their candidate could lose. Overall, these methods would likely yield more diverse legislatures than majoritarian methods but not quite as diverse as proportional methods.
Many voting expertsclassify Limited Voting as a majoritarian method. The national reform organization FairVote categorizes STV, MMP, Limited, and Cumulative methods under the umbrella moniker “Fair Representation Voting Methods.”
Advantages
Semi-proportional methods can achieve more representative results than purely majoritarian methods.
Disadvantages
Semi-proportional methods can only achieve representative results if voters in a minority are organized and vote cohesively.
Original Sightline Institute graphic, available under our free use policy.
Voters can cast as many votes as there are seats available, and they can choose to allocate more than one vote per candidate. For example, in a three-member district, voters can give all three votes to their favorite candidate, or two votes to their favorite and one vote to their second favorite, or one vote each to three different candidates. In “Equal & Even Cumulative Voting,” if voters fill in just one bubble, all three of their votes go to that candidate. If they fill in two bubbles, each of the two candidates receives 1.5 of their three votes.
Civil rights attorney Lani Guinier championed Cumulative Voting as a more equitable way to achieve diverse racial representation than trying to draw majority-minority single-member districts. US federal courts sometimes order jurisdictions in violation of section 2 the Voting Rights Act to switch from “vote for one” majoritarian voting to multi-member districts with Cumulative or Limited Voting (Limited Voting is described below) because racial minorities who could not win representation under “vote for one” single-member districts or “vote for one” at-large numbered seats can win representation in multi-member districts with Cumulative or Limited Voting.
Original Sightline Institute graphic, available under our free use policy.
More than 100 local jurisdictions in the United States use Cumulative or Limited Voting, and several dozen of these use Cumulative Voting specifically. Corporate stockholders, homeowners’ associations, and boards in some US localities use it to help elect more members from minority groups.
Advantages
Ballots are easy to count under Cumulative Voting.
This system can achieve representation for minority groups.
It can be used in local, nonpartisan races.
It allows voters to vote for more than one candidate.
Disadvantages
Voters must be organized to achieve fair representation under Cumulative Voting. If voters in the minority split their vote, their favorite candidates will not win a seat.
Original Sightline Institute graphic, available under our free use policy.
In Limited Voting, voters may cast their votes for a given number of candidates that is smaller than the number of seats available. For example, in a five-member district, voters might be permitted to cast two votes, enabling minority voters making up about two-fifths of the population to elect two out of five seats. Or in a three-member district, voters might have just one vote each.
If voters using a Limited Voting method are permitted to cast only one vote, it is called Single Non-Transferable Vote. Afghanistan, Pitcairn Islands, Vanuatu, and Indonesia use Single Non-Transferable Vote.
Advantages
Ballots are relatively easy to understand and to count under Limited Voting.
With proper coordination, Limited Voting can achieve representation for minority groups.
It can be used in local, nonpartisan races.
It can encourage parties to organize and reach out to voters.
Disadvantages
Limited Voting can lead to disproportional results where one group receives a majority of the seats with just a plurality (rather than a majority) of the votes.
Parties must be strategic in considering how many candidates to run, and voters must strategically spread their votes between candidates to achieve fair results. If parties and voters are not sufficiently strategic, they could waste a lot of votes—many voters cast their votes for candidates who never win or who would have won by a lot anyway so they lost the opportunity to elect someone else they liked. The sense that the strategy, not the voters’ preferences, determine the winners could harm voter morale.
The two methods below might achieve proportional representation, though they have not been used in any public elections, so it is hard to be sure. Some thought experiments suggest they might operate more like Cumulative Voting: if members of a minority group all give a maximum score to their favorite candidate and no scores to any others, then they can achieve fair representation. But if they give a score to a majority-view candidate they support, their minority-view candidate might not win a seat. Overall, these methods would yield more diverse legislatures than majoritarian methods, but maybe not as diverse as proportional methods.
In this multi-winner form of Score Voting, voters give each candidate a score, for example, from zero (or unscored) to 9. The candidate with the highest total score wins a seat. All the voters who scored that candidate have their remaining ballot weight reduced proportionally to their score for the winner. Reweighting makes it more likely to achieve proportional results. Reweighted ballots are counted, and the candidate with the highest score wins a seat. Adding and reweighting continues until all seats are filled. (A video explains, here.)
Original Sightline Institute graphic, available under our free use policy.
Just as in the single-winner form of Score Voting, Reweighted Range Voting incentivizes voters to only use the extreme ends of the available score range—that is, to give the maximum score to all candidates aligned with a voter’s views and give all other candidates a minimum or no score. So long as voters like all the aligned candidates, there is no penalty to giving them all a maximum score. If a party or group or faction has five candidates running and a good chance to elect three winners, aligned voters can safely give all five candidates a maximum score, and likely three of them will win. But differentiating between candidates could cause your group to get short-changed on fair representation. If, for example on a scale of 0 through 9, you give the five candidates a 9, 8, 7, 6, and 5, but voters with an opposing view give all their candidates maximum scores, your group might only elect two winners.
Another example: a minority group—say, the Green Party—has enough voters to elect one winner in a five-member district. If voters give a maximum score to the Green Party candidate(s) and zero to all others, they will elect one legislator. But Green voters aren’t sure if the Green candidate can win a seat and they still want to have a say in the election, or even if the Green can win they want to have a say in electing more than one of the representatives from the district, they will be tempted to also give middling scores to one or more of the major-party candidates they find acceptable. Meanwhile, the Democratic and Republican voters give maximum scores to multiple candidates from their parties, confident that they will elect several representatives with whom they are well-aligned, they may give no or a very low score to the Green Party candidate with whom they are less-aligned. The net result would be that the district sends five major-party legislators to the capital, even though one-fifth of voters wanted the Green Party candidate—a majoritarian, not proportional, result. With Reweighted Range Voting, It is not enough for voters in the minority to have the numbers to elect one-quarter of the legislature and for them to all turn out to vote and give their favorite a maximum score; they may also need to withhold scores from other candidates or else risk losing their representation.
Reweighted Range Voting could be used in nonpartisan races.
It might achieve more proportional representation than majoritarian methods.
It ensures that voters’ scores for all candidates are counted and that a candidate with weak but broad support (lots of medium or low scores) is not prematurely eliminated.
Disadvantages
The ballot and counting are complicated in Reweighted Range Voting.
It has never been used in a governmental election.
Voters in a minority group might not be able to elect their share of winners unless they withhold support from other candidates.
In some circumstances, voters have to choose between getting the maximum amount of representation for their group of like-minded voters, or being able to choose which of several similar candidates would best represent them.
Proportional Score Runoff Voting (SRV-PR) is the newly invented multi-winner form of Score Runoff Voting. It is a variation on Reweighted Range Voting, with a runoff in each round.
As with Reweighted Range Voting, if you gave a score to a candidate who wins a seat, your voting power for subsequent rounds is reduced—the higher your score, the bigger the reduction in your subsequent voting power. In each round, the two candidates with the highest total scores enter a runoff, and your reweighted vote goes to whichever of the two candidates, if any, you scored higher. Rounds and instant runoffs continue until all seats are filled.
As in Reweighted Range Voting, voters are incentivized to give high scores to all candidates they align well with and minimum or no scores to all others. Giving middling scores to candidates they are partially aligned with could cause their more-preferred candidates to lose. However, as in the single-winner form of Score Runoff Voting, the runoff encourages voters to take the risk of losing a seat for one of their aligned candidates by asserting their ability to differentiate between their preferred candidates if they run off against each other.
As with the single-winner form, voters will have to weigh the risk of causing their favorite candidate to lose against the risk of not having a vote in the runoff.
Most proportional methods only allow voters to vote for a candidate or party, so voters in the majority are not able to exclude candidates representing a minority view from winning a fair number of seats. For example, if a majority of voters in a proportional election wanted to strengthen anti-immigration laws, they could elect a majority of the legislature that shared that view, but they could not prevent a minority of pro-immigration voters from winning a minority of seats. With Score Runoff Voting, voters might be able to block the minority from winning seats. Supporters explain that the runoff “helps eliminate small but passionate minorities.” (Note that this link repeats the myth that proportional representation helped the Nazis rise to power in 1930s Germany. Amidst the economic devastation (33 percent unemployment) and social turmoil (many Germans disdained the post-war government created when they lost WWI) of the post-war era, Nazis gained power quickly, becoming the most popular party and winning 37 percent of the vote in 1932. In a majoritarian system, they would have won a majority of the seats and taken control of the government. Though the Weimar system was flawed in other ways, it did constrain the Nazis to their proportional share of seats in the government, blocking Hitler from taking control. Instead, he was forced to declare a state of emergency and seize power through non-democratic means.)
With Multi-winner Score Runoff Voting, voters could eliminate the minority from the legislature by giving no score to any of the pro-immigration candidates and giving a low score (for example, a one) to all other candidates, so their reweighted votes would retain as much power as possible, and they would be able to vote against the pro-immigration candidates in every runoff.
Original Sightline Institute graphic, available under our free use policy.
Advantages
Multi-Winner Score Runoff Voting could be used in nonpartisan races.
It might achieve more proportional representation than majoritarian methods.
SRV-PR encourages voters to give different scores to candidates to ensure they have a vote in each runoff.
Disadvantages
The ballot and counting are complicated for SRV-PR.
It has never been used in a governmental election.
Voters must be organized and well informed to achieve fair representation. If voters differentiate their scores, their favorite might not win a seat. Then again, if they express no support, they might forego having a vote in one of the automatic runoffs.
The majority of voters can potentially block voters with minority views from winning seats in the legislature, possibly leading to more majoritarian, not proportional, results.
How Many Voters Could Automatic Voter Registration Add to the Voter Rolls in Washington State?
UPDATE, June 2, 2017: Illinois became the first state to pass Automatic Voter Registration using agencies other than the Department of Motor Vehicles. Designated agencies in Ilinois include the Department of Healthcare and Family Services and the Department of Employment Security. The bill, passed with strong bipartisan support, could serve as a model for Washington to take a similar multi-agency approach.
More than 1 million eligible voters aren’t registered
The number of voting-age Washingtonians who are not registered to vote has grown steadily in the past few decades. Although more voters registered in 2016, nearly 1.3 million voting-age adults in Washington remain unregistered. Adding them to voter rolls once they prove their citizenship would ensure they receive mail-in ballots and can vote in future elections. Most registered voters cast ballots only some of the time, which is their choice. When Oregon introduced its automatic registration system this year, about a quarter of the automatically registered newcomers to the rolls cast ballots in November’s US election.
Original Sightline Institute graphic, available under our free use policy.
Options for automatically registering voters in Washington
Oregon and other states with automatic voter registration are registering citizens who document their citizenship to receive a driver license or ID card. Washington is unusual among states. Itdoes not require documentation of legal presence in the United States to get a standard driver license or ID card, although it does offer an enhanced driver license and ID. To get those, which residents will need starting in early 2018 to take domestic flights (unless they want to carry passports to the airport every time they fly), residents have to prove citizenship. Because only a small share of licensed drivers have chosen to get enhanced licenses and IDs, advocates and legislators have considered using other agencies that verify citizenship, such as the the Economic Services Administration and the Health Benefit Exchange, to automatically register people to vote.
How many unregistered citizens could each of these agencies register, if a state Automatic Voter Registration law cleared the legislature or won approval at the ballot?
Economic Services Administration
In 2016, the Economic Services Administration (ESA) served 797,521 adult clients whose citizenship the agency verified. If these citizens are registered to vote at the average rate in Washington—77 percent of voting-age Washingtonians are registered—then ESA could automatically register 183,500 people to vote. If ESA citizen clients are registered to vote at less than average rates—say, the same rate as Washingtonians without a high school education, or 59 percent—the agency could automatically register 327,000 people, or about one-quarter of all unregistered but eligible voters in the state.
Health Care Authority
Currently, 800,000 adults are enrolled in Washington Apple Health (Medicaid). According to the Health Care Authority, 82 percent of enrollees are citizens. If these 660,000 enrolled citizens are registered to vote at the average rate, the Authority could automatically register more than 150,000 people to vote. However, some Apple Care enrollees are also ESA clients and Apple Health enrollees, so the potential number of enrollees can’t be simply added together.
Health Benefit Exchange
In 2017, some 182,000 Washingtonians enrolled in Qualified Health Plans through the Washington Health Benefit Exchange (the Affordable Care Act marketplace). More than 150,000 are adult citizens. If these are registered to vote at average rates, the Exchange could automatically register 35,000 people to vote.
Department of Licensing
More than 5.5 million Washingtonians have standard licenses or IDs, and as of March 2017, 609,000 Washingtonians had opted to pay $54 more to receive an enhanced ID card or driver license. (The extra price will drop to $24 this year, because of new legislation just approved.) The Department of Licensing could only automatically register to vote those people with an enhanced license or ID, because they are the only ones who have verified their citizenship. If they are registered at the average rate, the Department of Licensing would automatically register 140,000 people to vote. Again, there may be overlap with the other agencies.
However, many more Washington citizens will probably start choosing enhanced IDs, because standard licenses and IDs do not comply with the federal REAL ID Act. Secure federal facilities no longer accept standard Washington licenses and IDs as identification and, starting on January 22, 2018, Washingtonians will not be allowed to use standard licenses or IDs to board domestic flights. Starting in 2018, the Department of Licensing will begin marking standard licenses and IDs with language—maybe “Federal Limitations Apply”—to indicate they don’t comply with the federal law.
Let’s say an additional 200,000 Washingtonians get enhanced licenses and IDs by the end of 2018, for a total of 809,000, and those citizens are registered to vote at average rates (77 percent). The Department would automatically register 186,000 voters by the end of 2018. Let’s say that, as new licensees choose the enhanced option, or as standard licenses come up for renewal, or as they figure out their standard licenses don’t work at the airport, almost one-third of the 1.4 million Washingtonians getting a new or renewed license or ID each year, or an additional 500,000 people, get enhanced licenses or IDs each year for the next eight years. Using the same assumptions as above, the Department would automatically register an additional 115,000 people each year.
Putting it all together
What if Washington approved an Automatic Voter Registration law that took effect in 2018 and ordered the three agencies above to automatically register citizens to vote? If we conservatively assume that, including overlapping registrations, ESA and the Health Authority together register 180,000 citizens, the Health Benefit Exchange registers an additional 35,000, and Department of Licensing an additional 185,000, altogether 400,000 voters would be added to the rolls in 2018. If the Department of Licensing continued registering an additional 115,000 people each year, even assuming the state’s population grows at a rate of one percent per year, by the end of 2025, 90 percent of eligible voters would be registered to vote, up from 77 percent today.
Put another way, AVR would add more than 1.2 million voters to the rolls over the course of eight years. The chart below shows this hypothetical case.
Original Sightline Institute graphic, available under our free use policy.
The above is just one possible path. It could be that Washingtonians will stampede to adopt enhanced licenses and IDs faster, or it could be that the additional $24 for a six-year license will dampen uptake and slow the rate of voter registration.
Conclusion
The Washington legislature could expand its track record of honoring citizens’ right to vote. By passing an Automatic Voter Registration Law requiring the Department of Licensing to automatically register to vote all documented citizens, Washington could clear an unnecessary obstacle from the paths of some of the more than one million Washingtonians who are eligible to vote.
Thanks very much to Dave Kershner for tenaciously researching the numbers for this article.
One Tool for Dismantling Structural School Segregation in Seattle: Better Zoning
View Ridge Elementary is one of Seattle’s highest-rated public elementary schools. Eighty-five percent of View Ridge students demonstrate or exceed grade-level proficiency on math and English standardized tests, well above the state average of 55 percent. But despite being a public school, it tends to be expensive to attend View Ridge—prohibitively so. There’s a structural reason for this: the city has zoned 93 percent of the school’s attendance area single-family zoning. Unless a family is wealthy enough to afford a house in the neighborhood, where home prices average $850,000, or lucky enough to find an affordable rental (only a quarter of dwellings in the surrounding census tract are renter-occupied, and rents average $3,000 per month), the chances of attending this school rest on the whim of the district lottery via the open enrollment process. This school year (2016-2017) just four out-of-area students won admission to View Ridge, and all of them already had siblings attending the school.
View Ridge Elementary School, image from Google Maps.
The story of View Ridge is not uncommon in Cascadia’s largest city, nor in other cities across the region. Though Seattle boasts many high-performing public elementaries, most of them sit in the city’s most expensive and restrictive residential neighborhoods—places where zoning regulations prohibit nearly any housing that isn’t a single-family, detached structure. On average, single-family zoning covers 72 percent of land in attendance areas of Seattle’s 13 top-rated, non-option, public elementaries. (The city has 16 schools that received a perfect 10 score on the GreatSchools rating system. Three of these schools are option schools, which don’t have typical attendance areas, and so these are excluded from this calculation.)
When communities impose this kind of restrictive zoning pattern, it results in only a small slice of the city’s families being able to afford homes within most of the top schools’ attendance zones. Housing prices average over 20 percent more in neighborhoods surrounding the city’s top 16 elementary schools—all those that received a 10, the highest score possible, on the GreatSchools rating system—than in the city as a whole. In addition, these neighborhoods offer a lower proportion of rental units than the city average. And, in many cases, this cycle reinforces itself: wealthier neighborhoods pour private funding into their public schools via PTAs and other fundraising, paying for things like added tutors, smaller class sizes, and after-school enrichment programs. These private dollars likely boost school performance and in turn, the presence of a top-ranked school further boosts real estate prices in the vicinity.
Families are so limited in their housing choices surrounding Seattle’s top public elementaries that for some who can afford the tuition, it may actually be cheaper to pay for 13 years of education at a parochial school than to buy into these increasingly exclusive enclaves. Families unable to look outside the public school system are left with a school district that is increasingly segregated along both economic and racial lines, a result partly fueled by zoning decisions that determine what kinds of housing are allowed in what parts of the city. (The racial resegregation of Seattle public schools is powerfully illustrated in this article.)
Improving schools across the district, in every neighborhood, is necessary to achieve equitable education access. This article does not address best practices in education policy for Seattle. Instead, I focus here on an often overlooked structural factor contributing to school segregation: exclusive zoning regulations that continue to exacerbate and perpetuate existing inequities for students in Seattle schools. Making city zoning more flexible and dynamic is one key part of the suite of policy changes the city and school district can implement to ensure opportunity and access for all Seattle students.
The city’s Housing Affordability and Livability Agenda recommends expanding the range of housing types in single-family zones to include more small duplexes and triplexes, modest rowhouses, and stacked flats, along with mother-in-law apartments and backyard cottages—all within the existing building size allowed for single-family houses. By legalizing a broader spectrum of housing options in single-family zones, and therefore a range of price points, more students with diverse economic backgrounds could attend Seattle’s top public schools.
The map layer reveals that ADUs and ‘plexes add nearly 2,500 additional homes within a half mile of the district’s high-performing elementaries.
In December, Sightline published a map showing all multi-family homes in Seattle’s single-family zones, including ‘plexes, townhomes, and accessory dwelling units (ADUs—a.k.a. mother-in-laws or granny flats). In this article, we are introducing an additional layer on this map showing all 71 of Seattle’s public elementaries, including its kindergarten-to-eighth-grade (K-8) schools. Each school icon is color-coded according to its rating on the GreatSchools index, a rating system based on average student performance on standardized tests that has been widely used in research related to primary education. While student performance on standardized tests is by no means a perfect or complete method of evaluating schools, we use this metric in this report as a way to compare schools across a common measure. Schools that perform above the state average receive a rating between 8 and 10; schools scoring below the state average rate at 3 or lower.The map layer reveals that ADUs and ‘plexes add nearly 2,500 additional homes within a half-mile of the district’s high-performing elementaries—those rated 8 or higher. These varied housing options give us a taste of how Seattle can create a wider range of home price points in all of its neighborhoods to open the city’s highest-rated public schools to a more diverse student body.
Let’s look again at View Ridge Elementary. Current zoning allows almost exclusively single-family housing within the school’s attendance zone. But there are in fact 22 duplexes, 1 quadplex, and at least 19 permitted accessory dwelling units within this attendance zone. Together, these units create 67 unique homes that are smaller and typically less expensive than the area’s detached, single-family homes. These additional home options create the potential for families that can’t afford the neighborhood’s average home prices to live there and benefit from this school, which earned the highest possible score, a ten, on the GreatSchools index.
In this screenshot from the Sightline map, View Ridge Elementary is represented by the green schoolhouse, indicating its top performance on standardized tests. The light red outline shows View Ridge’s attendance zone. Orange dots represent ADUs, green polygons represent duplexes, and yellow rectangles represent 4-plexes. The light gray map background indicates single-family zoning and the dark gray indicates low-rise zoning.
In this article, I’ll delve into the data on the housing price gap between Seattle’s highest- and lowest-performing public elementaries, and unpack how a more flexible zoning code could be one important tool in reversing segregation among Seattle’s public schools. I’ve also included an appendix at the end of this article that explains how to navigate this new map layer.
Homogenous housing makes for homogenous neighbors: The story of View Ridge Elementary
Housing in the View Ridge neighborhood is as expensive as it is homogenous. As mentioned, the city has zoned 93 percent of the land within View Ridge Elementary’s attendance area as single-family. Home values in the area are 36 percent higher than the Seattle average. Rentals are hard to find, with only a quarter of the area’s housing units occupied by renters, far fewer than the rest of the city where more than half of housing units are renter-occupied. And rent is high, averaging $500 per month more than typical Seattle rent. The neighborhood’s high price tag results in part from the lack of diversity in housing types.
One result of homogenous housing options is a homogenous neighborhood. View Ridge’s expensive housing scene means that many families living on average or modest budgets don’t even look at the neighborhood when they’re looking for a place to live. In fact, the average household income in the View Ridge census tract is $124,000, more than 25 percent higher than the average Seattle household income.
How the school housing gap is fueling a segregated school district
The View Ridge story is reflective of the housing gap and growing segregation across the Seattle Public School district. Though the district as a whole boasts many strong schools, most of them sit in an east-west strip north of downtown and south of 85th Street, as shown in the map below. Another small cluster is in the northern half of West Seattle. Both of these areas are also sites of much of the city’s most expensive residential real estate, restricted by single-family zoning.
This screenshot of the map shows the public elementary school divide across Seattle. The school icons are color coded by their GreatSchools rating, ranging from 1-10, with 10-rated schools being the highest performing. Seattle’s most highly-rated public elementaries are shown in green and concentrated north of downtown. Lower rated schools, shown in red, sit primarily to the east and south of downtown. Yellow schools rate in between. The two schools with gray icons were not rated by GreatSchools.
Original Sightline Institute graphic, available under our free use policy.
Zoning decisions shape more than building types; they decide who lives where. Restrictive zoning results in less diversity in the housing stock near these schools: more than two-thirds of the dwellings in census tracts surrounding the city’s 16 10-rated schools are single-family homes. In comparison, about half of the city’s overall housing stock is single-family homes. And home values in these schools’ neighborhoods reflect this crunch, averaging 20 percent more than the estimated value of the typical Seattle home. For example, the figure below shows that the average home price in the neighborhood surrounding Montlake Elementary surpasses $1 million. For families that can’t afford to buy a home, it’s also particularly difficult to find and afford a rental near the city’s top schools. On average, census tracts surrounding 10-rated schools have 11 percentage points fewer renter-occupied units than average in the city, and rent is $334 more per month near those schools.
Original Sightline Institute graphic, available under our free use policy.
As a result of this zoning—which makes it illegal to build more affordable kinds of homes in certain places—wealthier families that can afford entrance into these expensive single-family neighborhoods have greater access to the top schools (and, in turn, have more resources to invest via PTAs and other contributions to the health and success of those schools—private funding from families that isn’t necessarily available or as ample in other school zones). The average household income near one of Seattle’s 10-rated schools is more than $20,000 above the city average. For example, the figure shows the average household income in the census tract that includes Montlake Elementary is $172,000, while the citywide average is $98,000. Meanwhile the many families living on tighter budgets routinely find themselves in the attendance zones of the district’s mid- and low-rated schools—in part because that’s where they can find housing that is somewhat more affordable.
Original Sightline Institute graphic, available under our free use policy.
In fact, by way of illustration, a private school education could even be cheaper than buying into a neighborhood surrounding one of the city’s top public elementaries. For example, with the annual savings a family could accrue from renting an average home in the Dunlap neighborhood rather than in Montlake, near 10-rated Montlake Elementary, they could cover tuition for one child at the Seattle Waldorf School with some change leftover. Renting in Roxhill or Highland Park rather than in North Queen Anne, near 10-rated school Frantz Coe, amounts to savings worth the tuition at a parochial school such as Our Lady of Guadalupe, Hope Lutheran, or Fairview Christian.
Of course, private school is not an option for many families. In any case, housing—and more particularly the city’s choices about zoning—is one factor that yields a school district that is increasingly segregated by income and race. A few facts from the district’s latest school reports illustrate this point.
Original Sightline Institute graphic, available under our free use policy.
How broader housing options could help combat school segregation
Research from Tennessee to Chicago to Harlem links high-quality early education with lifelong benefits: higher adult salary and education level, greater likelihood of owning a home, having a 401(k) and saving for retirement, as well as lower likelihood of teenage pregnancy, incarceration, tobacco use, and depression. Unfortunately in Seattle, the benefits of a top-notch elementary education are disproportionately available to children from white, English-speaking families with high incomes. For decades, most public policy efforts to redress this inequity have focused on transporting some children daily to integrate schools, and such approaches may deserve fresh attention in Seattle. Zoning is just one piece of a complex puzzle, but a modest additional contribution to school desegregation by race and class could come from allowing more duplexes, cottages, and other housing choices in the single-family zones that surround many top schools.
Zoning is just one piece of a complex puzzle, but a modest additional contribution to school desegregation by race and class could come from allowing more duplexes, cottages, and other housing choices in the single-family zones that surround many top schools.
Multi-family homes in Seattle’s single-family zones create nearly 2,500 additional homes within easy walking distance, a half-mile, of Seattle’s 37 high-performing public elementary schools—those that hold a rating of 8 or higher on the GreatSchools index for performing above the state average on standardized tests. More than 2,000 of these homes are duplexes, triplexes, and townhomes and are the result of Seattle’s historically more flexible zoning code(inotherwords, they wouldnotbelegaltobuildtoday). The remainder of these units are ADUs—backyard cottages or mother-in-law apartments within a house. These data comes from Sightline’s map of all multi-family housing units in single-family zones. (For a primer on how to read the base map see this previous article; for more information about how to navigate our added schools layer, read the appendix below.)
Each of these multi-family units in single-family zones surrounding the Emerald City’s top public elementary schools represents much-needed diversity in the housing stock. Accessory dwelling units and many of the ‘plexes are rental options in rent-parched neighborhoods. They create housing options for families not able to purchase a home at the city’s high asking prices. The townhouses and rowhouses may be owner-occupied and often come with a lower price tag than a typical detached single-family home. Allowing more of these kinds of homes in single-family zones could create a greater range of housing prices, potentially welcoming more families to rent or own homes near top-notch schools.
Increasing the diversity of housing options in the vicinity of high-performing schools and therefore boosting the number of kids who live in these schools’ attendance zones might seem like a recipe for crowding the schools. While this analysis does not include an assessment of space for additional students in each building, nor options for expanding that space through things such as the portable classrooms that Seattle used extensively during the baby boom, it’s relevant to examine the number of children in the neighborhoods in question. This figure below shows the population over time of children under the age of 18 living in the census tracts that hold today’s highest-rated Seattle elementary schools.
Original Sightline Institute graphic, available under our free use policy.
Though the overall populations of children in most top schools’ neighborhoods have bounced back from their lows in the 1990s, they remain far below their levels in the baby boom years of the 1960s. Opening up more housing options in these neighborhoods could provide an opportunity for a more diverse group of children to gain access to these top educational opportunities—without adding more children than these neighborhoods have accommodated comfortably in past decades.
Diversifying housing options in single-family zones near public elementary schools across Seattle would make a difference for one of the city’s most vulnerable, and precious, populations: its kids.
Currently housing diversity found on most land surrounding the top schools is either a fluke of zoning codes past or a result of ADUs that were built by owners willing and able to surmount steep regulatory barriers. Different choices—and attitudes—about zoning are one key for the city to open up its best schools to more children. Current regulations excessively limit and slow ADU construction. Removing these policy barriers could provide more housing options in more neighborhoods. In addition, the proposal in the city’s Housing Affordability and Livability Agenda to permit a greater range of housing options in single-family zones, including small ‘plexes and townhomes, could create housing that fits a range of family sizes, styles, and needs.
Seattle has the opportunity to foster more welcoming neighborhoods and in doing so help dismantle a structural factor in the resegregation of its schools. Diversifying housing options in single-family zones near public elementary schools across Seattle would make a difference for one of the city’s most vulnerable, and precious, populations: its kids.
Thanks to map maker Jeffrey Linn of Spatialities for his tireless work to make this map as accurate as possible; to CartoDB for providing Sightline with a grant to use its map hosting services; and to the Brookings Institution. The institution’s 2012 report Housing Costs, Zoning, and Access to High-Scoring Schools provided inspiration for this article. Finally, thank you to Dr. Natasha Rivers, Seattle Public School District’s demographer, and Dr. Jonathan Rothwell, senior economist at Gallup, for their thoughtful feedback on a draft of this article.
Appendix I: Residential zoning in attendance areas of Seattle’s public elementary schools
Original Sightline Institute graphic, available under our free use policy.
Appendix II: Navigating the schools map layer
The new schools layer on Sightline’s map of multi-family homes in Seattle’s single-family zones tracks multi-family housing surrounding each of the city’s 71 public elementary and K-8 schools. (For a primer on how to navigate and understand the base layers of the map refer to this introductory article.)
The map shows a schoolhouse icon at the site of each of these schools. Icons are color coded according to GreatSchools ratings. The GreatSchools rating system rates schools on a scale of 1 to 10 based on student performance on standardized math and English exams. On our map green icons indicate that the school is rated 8-10, meaning that students performed above the state average on standardized exams. Yellow icons indicate a rating of 4-7, indicating performance consistent with the state average, and red icons indicate a rating of 1-3, indicating below state average performance on those same exams. Hovering your mouse over a schoolhouse icon will trigger a pop up box including the school’s name, GreatSchools rating, and percent of both single-family and multi-family zoning within the school’s attendance area. Clicking on the schoolhouse icons reveals a pop up box with a little more information including the school name, status (whether the school is an option school or standard school), GreatSchools rating, and website. Below this the pop-up box shows the percentage of single- and multi-family zoning in the attendance area. For example, in the screenshot below the hover pop up box for McGilvra Elementary, in Madison Park, shows that the school holds a rating of nine on the GreatSchools system. Eighty-one percent of the land in the school attendance area is zoned single-family and 10 percent is zoned multi-family. The multi-family zoning category includes several zoning types: lowrise, neighborhood commercial, residential commercial, master planned community, and downtown.
The map includes the 14 option elementary and K-8 schools in the Seattle Public School district. The pop up boxes indicate whether a school is an option school under the status section. These schools don’t have defined attendance zones and students from across the city attend them. We’ve included these schools in our analysis in this article as geography is a factor in admission decisions. Since the option schools do not have defined attendance zones their pop up boxes show null values for percentage of land of each zoned type and our analysis of percent of zoning type by school attendance zone does not include option schools.
The orange lines on the map show the school attendance zones for each school. You can use these lines to get an idea of how many multi-family housing units exist within each school’s attendance zone.
On the top left of the map there is a map legend with check boxes near each component of the map. Checking or unchecking these boxes allows you to select which types of information the map displays. For example, by checking the School Buffers box you can view the quarter and half mile buffer areas around each school. When this box is checked two light red concentric circles surround each school. These circles indicate a quarter-mile and half-mile radius from each school and reveal how many multi-family housing units exist within the single-family zoning surrounding each school. City planners often use a half-mile as a benchmark for accessible walking distance, so students living within a half-mile of a school likely can walk to that school.
The screenshot below of Catharine Blaine K-8 in Magnolia shows two orange dots within the first red circle, indicating that there are two ADUs within a quarter mile of the school. Farther out, there are four green polygons and seven additional orange dots. These represent duplexes and ADUs, respectively, that are more than a quarter-mile but less than a half-mile from the school. Together these units represent the potential for thirteen additional families to live within easy walking distance of this top-notch school.
Finally, we’ve included three widgets with this map layer, visible to the right of the map. The widgets allow you to filter information on the map based on criteria that interest you. The first widget (top right) allows you to search for a particular school by name. The second widget (middle right) allows you to filter schools by their GreatSchools ratings. You can select the rating you are interested in by using the sliding bars on the histogram. In the example below, the map is displaying only those schools rated 1 to 3.
The third widget is also a histogram and allows you to filter schools by the percentage single-family zoning in the attendance area. By moving the sliding bars you can narrow or expand the range of single-family zoning you are interested in.
By exploring the map, you can learn more about multi-family housing options near Seattle’s public elementary schools.
Notes on Methods:
This report examines impacts of restrictive zoning on attendance at Seattle Public School district’s 71 elementary and K-8 schools.
We calculated the percentage of land of each zoning type in school attendance areas using GIS to layer school attendance area maps on top of a map of city zoning. Attendance areas for each school come from the Seattle Public School district website and can be downloaded here. We used the city’s zoning maps which include public (non-residential) lands, such as parks and schools, in both single-family and multi-family zones. This may somewhat inflate the percentage of land zoned single-family, though this effect is partially offset by the similar public lands included in areas zoned multi-family.
All data for average rents and home prices by neighborhood in this article come from the Zillow Home Value Index for February 2017. Data are available on the Zillow website here. Data regarding household income comes from the 2015 American Community Survey data five-year estimates at the census tract level. Census tracts and Zillow-defined neighborhoods do not follow school attendance zones; they are used as a proxies in this article.
The Great Schools system assigns schools ratings based on school performance on statewide standardized tests in mathematics and English language arts. Schools in which the majority of students test at or above grade-level proficiency receive scores of 8 and higher. Schools in which students test within the range of average performance on these standardized tests score between four and seven. Schools in which students score below statewide average score between one and three on the scale. Performance on standardized tests is only one metric of school strength and other metrics could reveal somewhat different results. We chose to use the GreatSchools index as it’s a commonly used index across the United States, and it has been used in other similar studies examining links between zoning and school access, such as this national report published by the Brookings Institution. School ratings in this article are as of March 2017. School ratings are periodically updated and so may differ slightly from the data cited here.
Fourteen of the schools on this map are option schools, meaning that attendance is by application only. Admission decisions to these schools give preference to geographic proximity to the school, and so we are including them in this analysis. Many of these option schools are high-rated on the GreatSchools rating system—three have a rating of 10, and nine received a GreatSchools rating of 8 or higher—and attract high-achieving students from across the district. They are located in neighborhoods with lower average home prices and household incomes. Had we excluded these schools from our study we would have likely found attendance at Seattle’s top-rated elementary schools to be even more homogenous and exclusive to white, English-speaking students from households with high incomes. Option schools are clearly marked on the map under the status section of each school’s pop up box. Because attendance at option school is not restricted to any attendance zone we are not including option schools in our calculation of percentage of single-family zoning surrounding top-rated schools.
As noted in other articles in this series, the map only shows about 70 percent of Seattle’s ADUs since addresses of ADUs permitted prior to 2005 are not in the public record. As a result, there are likely some additional ADUs not represented on this map near top-rated schools.
Stormwater Management: Lessons from Our Forests
Take a moment to recall your last hike through a Pacific Northwest forest. Maybe close your eyes, listen for the quiet of such lush flora around you, and breathe in the evergreen scent.
If you’re really imaginative, and if your hike was recent, you might also recall the rain. Perhaps you see drops suspended from pine needles, or you feel the buoyancy of the leaf litter below your feet. What you don’t remember, likely, is seeing gushers of stormwater runoff, like you might in a city.
That’s because Earth’s biosphere has about 3.8 billion years of design experience at managing its rainfall. Compared with the typically impervious urban environment, where about 80 percent of rainfall becomes runoff, in a healthy Northwest forest, just 0.2 percent of rainfall does.
A new report from the Urban Greenprint project looks to capitalize on that natural expertise, employing principles of biomimicry to improve how we build our cities. “Seedkit: Design Concepts Learned from Pacific Northwest Forests” identifies properties of forests that cities and towns can imitate to manage the massive quantities of rainfall for which western Cascadia is known.
Here, we summarize the report’s nine components, including the purposes they serve in the forest and the potential to mimic those functions—and their feel—in our built environment. The full report has more, such as questions about materials and product development and images of design concepts.
If you think back to that hike, chances are you imagined a mix of taller and shorter trees, tiers of leaves and flowers, lichen and ferns and moss, and fallen wood, fungi, and other matter underfoot. Together, these make up a multi-layered canopy that, when it rains, helps to break up, slow, and hold water, as well as shield sunlight. From these dispersed drops and small pools, the water has a better chance of evaporating before it even hits the ground, reducing the absorption load of the earth by 10-20 percent in a typical Northwest forest.
How could we mimic that in the urban environment, so that less rain even reaches the pavement? A series of angled rain- and sun-screens is one idea to slow the flow of rainwater down the surfaces of our buildings. They could include mesh materials that separate and hold the rain in more evaporation-prone droplets. Below these, landscaping like planters and bioswales could catch the remaining trickle.
A design concept of rain-/sun-screens, by Jennifer Barnes. Used with permission.
Rain- and sun-screens could take a number of attractive forms, using materials that enhance the natural look and feel of the building while serving to slow and capture rainfall. Image courtesy of Jeff Lynch, used with permission.
2. The sponge service of textured flora
The vegetation of a Cascadian forest works as a living sponge. From the canopy to the forest floor, different surface textures hold water in greater and lesser quantities, again facilitating evaporation.
Designers could incorporate such texturing into their buildings in many ways, some playful, some sleek. Living walls, meandering downspouts, and sculpted or vegetated gutters slow or even make use of stormwater running down a building—and they look beautiful to boot.
A meandering downspout accommodates several self-watering planters and adds some green character to a residential building’s otherwise non-descript brick wall. Image courtesy of Alexandra Ramsden, used with permission.
3. Evergreen needles’ drop-by-drop interceptions
There’s magic to the way a conifer looks after a rainstorm, each needle suspending at its tip an ornamental drop. Of course, this splitting, splashing, and holding is yet another means for the forest to intercept and evaporate more rainfall.
How might an urban space mimic this intricate arrangement? Wire sculptures, awnings, and screens hold a variety of answers and can adorn buildings from rooftop to ground.
No Northwest forest picture is complete without pine cones. To release their seeds at the best time, conifer cones respond to moisture levels in the air, closing when wet and opening when dry. (Fun fact: Pine cones can serve as an indicator of forest fire potential. If the cones on a forest floor are all open, it means fire danger is high.)
Some buildings already incorporate similarly dynamic elements, such as sunlight-responsive facades and wind-responsive canopies. Could they also get smart to water and humidity in the environment, helping to slow or capture rainfall when it is present?
Transpiration—did that word just send you back to a middle school science class? As a refresher, transpiration is the process of water movement through a plant: in through the roots and out through other plant parts. Ninety-five percent of transpiration occurs through the pore-like stomata on plants’ leaves or needles.
What might transpiration look like in the built environment? It could be as simple as flapping fabric: banners, flags, canopies, or fabric-wrapped walls. An absorbent and loosely attached bolt of fabric could divert gallons upon gallons of water from drainage systems, returning that moisture to the air once wind and sun return post-shower.
The nooks and crannies of tree bark, grown and fissured over decades or centuries, provide countless spaces to slow or store rainwater and increase evaporation. Though building facades can’t actively grow, they could feature some bark-like texturing in their material: stamped metal or ceramic panels, textured cladding, and poplar bark are all available to builders already, and designers could develop new “bark” options.
A Pacific Northwest resident likely would not be surprised to learn that there are over 12,000 species of moss. Moss’s water content typically matches that of its surrounding atmosphere, and its leaves are concave to collect and hold water. Moss lacks “true roots,” so it can grow nearly anywhere. And the undersides of moss repel water so they can be used for photosynthesis.
Porous building materials, living walls, wood rain-screens, and newer synthetic materials could serve as absorbent rain-screens, to soak up and hold rainwater. Replaceable, breathable, and attached directly to buildings, such materials release moisture through evaporation after the clouds blow away.
Mycorrhizae are the symbiotic webs connecting fungi and plants. They serve as a sort of natural internet to collect and pass along information and to distribute nutrients among organisms.
While many cities already employ smart systems to manage energy or monitor water leaks or usage levels, they could step up their game. Imagine dynamic systems that, say, monitored and responded to changing weather systems, opening valves to redirect stormwater or rescheduling irrigation based on a rain forecast. A smart, connected water management system would disburse resources exactly as needed.
Diagram: Smart Cities Saving Water. Image courtesy of ioBridge.
9. The forest’s holistic success
The specific Northwest forest elements listed above, in combination with countless others, weave a balanced water cycle because they operate together in a holistic system. If designers approached buildings with the same model in mind, they could blend multiple strategies to emulate natural processes.
The Watershed office building going up in Seattle’s Fremont neighborhood has in fact done just that, anticipating it will reuse or treat fully a half-million gallons of rainwater annually on its corner, just under the Aurora Bridge and mere blocks from Lake Union. Firms Rushing and 55-5 Consulting worked with Weber Thompson designers to explore several of the strategies listed above. For example, the team looked at whether the façade could include multiple downspouts, evaporative porous fins, absorptive moss beds, and percolating gutters. (This exercise also led to a competition submission as well with Eleven Magazine. The winner has yet to be selected, but the team is hopeful.) Although not all of the strategies explored were integrated into the final design, this project has been an example of a dramatically altered design process which could be carried through the industry to further improve the way water is handled by the build environment of Seattle.
The Watershed office building in Seattle’s Fremont neighborhood. Image courtesy of Weber Thompson.
“Building as forest: Evaporation strategies,” courtesy of Todd Bronk.
A sylvan city future
Urban dwellers across Cascadia are debating what they want their changing cities to look and feel like, how they will manage worsening housing shortages, and how these urban centers will remain thriving and diverse centers of culture and opportunity.
If we looked to our much lauded natural surroundings for inspiration, Cascadians could learn a great deal about how to build better cities. Biomimicry holds promising techniques to inform how we manage everything from stormwater to energy use, improving overall performance and efficiency—and perhaps even aesthetic, giving the urban street scene a little more of that special feeling Cascadians treasure when out amidst our region’s rich and complex forests.
Alexandra Ramsden and Jennifer Barnes are guest contributors to Sightline Institute. They will be presenting this week as part of the 11th annual Living Future unConference. Learn more here.
This website uses cookies so that we can provide you with the best user experience possible. Cookie information is stored in your browser and performs functions such as recognizing you when you return to our website and helping our team to understand which sections of the website you find most interesting and useful.
Strictly Necessary Cookies
Strictly Necessary Cookie should be enabled at all times so that we can save your preferences for cookie settings.
If you disable this cookie, we will not be able to save your preferences. This means that every time you visit this website you will need to enable or disable cookies again.
3rd Party Cookies
This website uses Google Analytics to collect anonymous information such as the number of visitors to the site, and the most popular pages.
Keeping this cookie enabled helps us to improve our website.
Please enable Strictly Necessary Cookies first so that we can save your preferences!
Additional Cookies
This website uses social media to collect anonymous information such as which platform are our users coming from.
Keeping this cookie enabled helps us better reach our audiences.
Please enable Strictly Necessary Cookies first so that we can save your preferences!
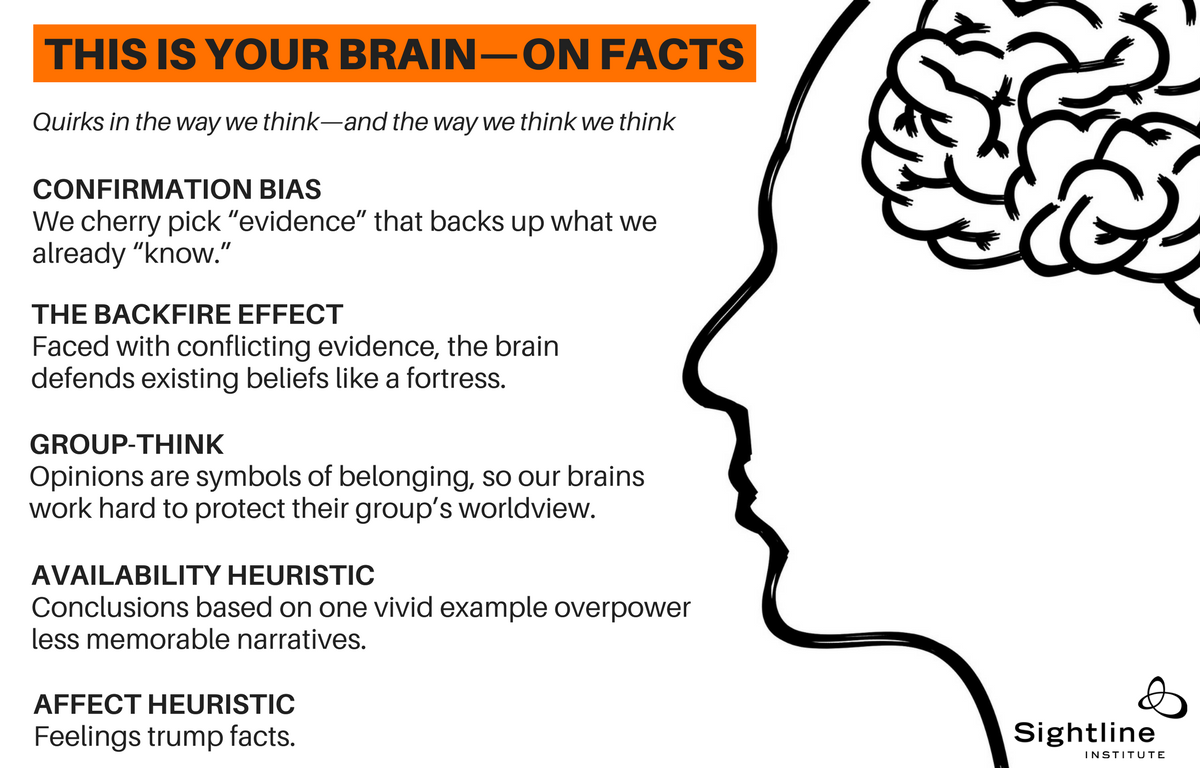
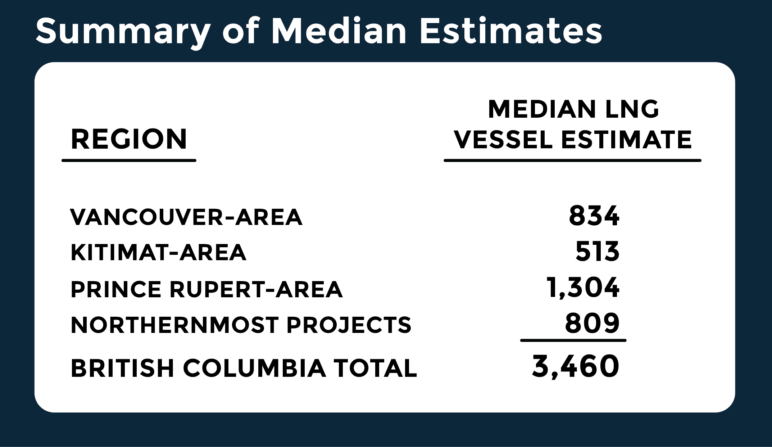


")
")

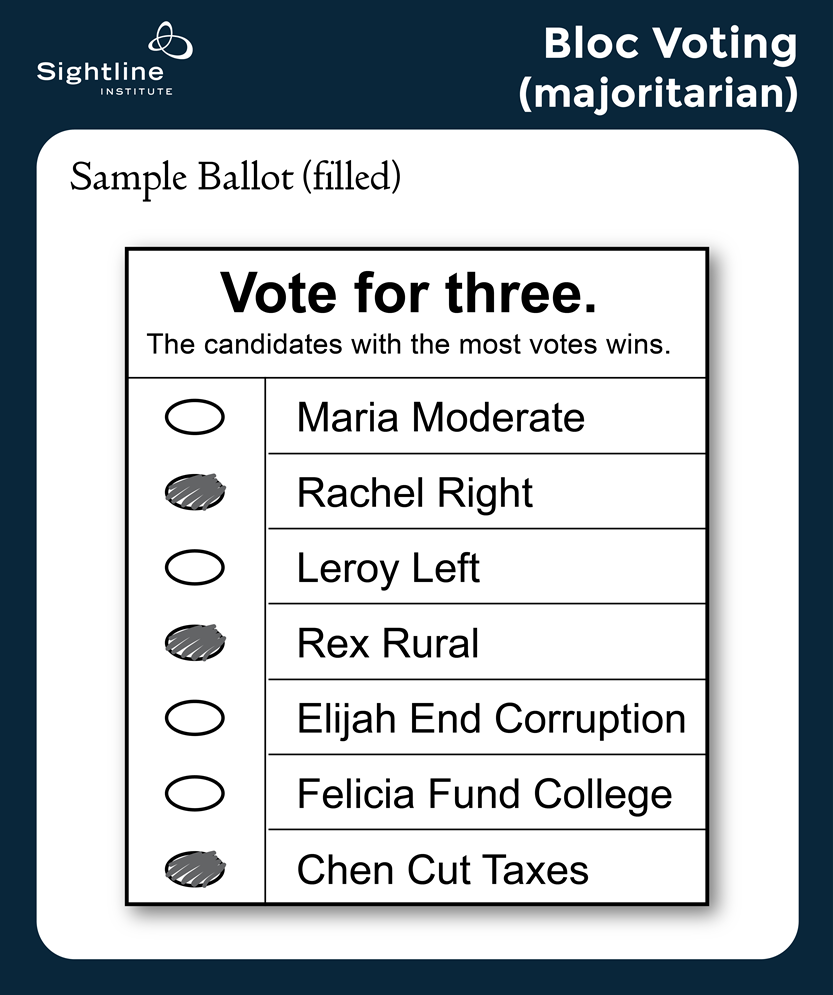
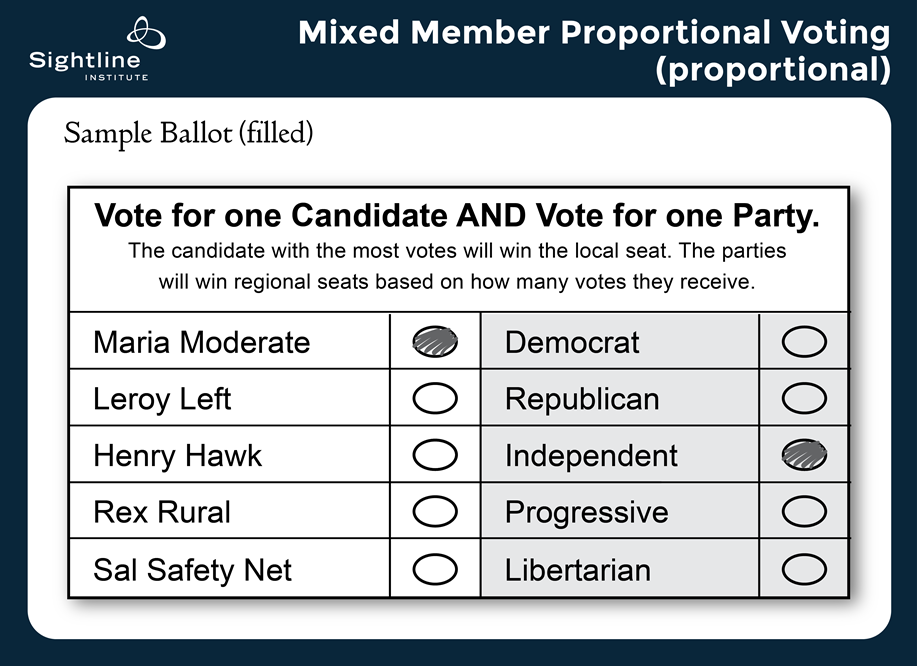
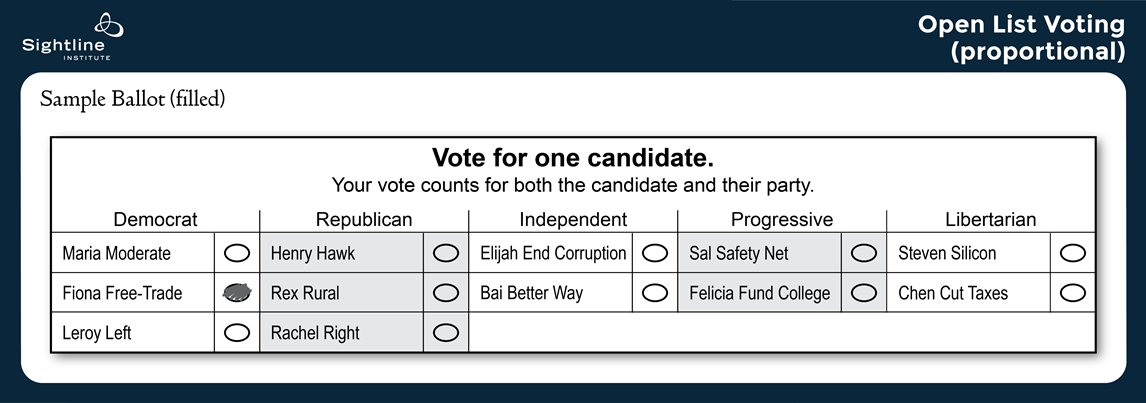
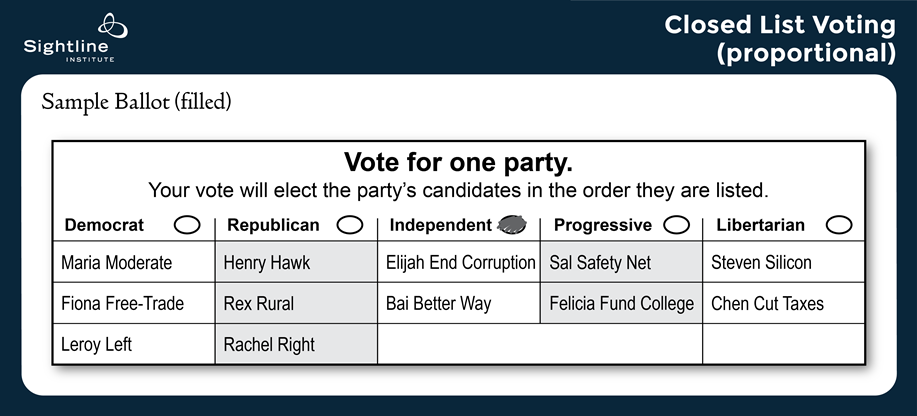
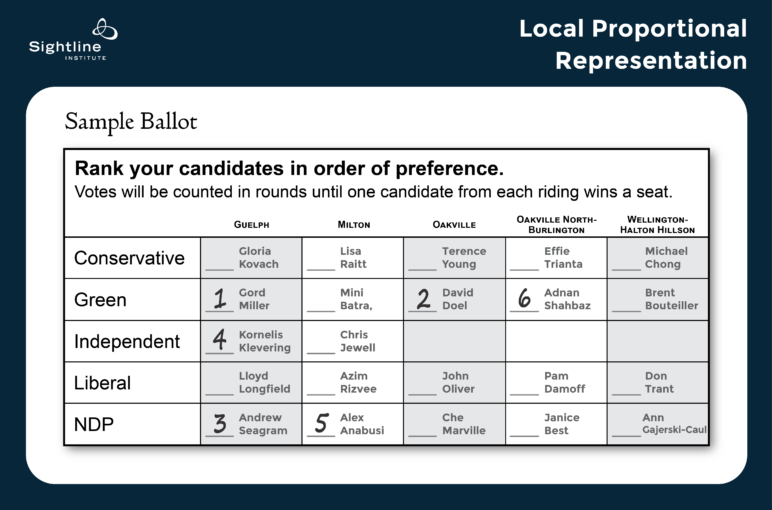

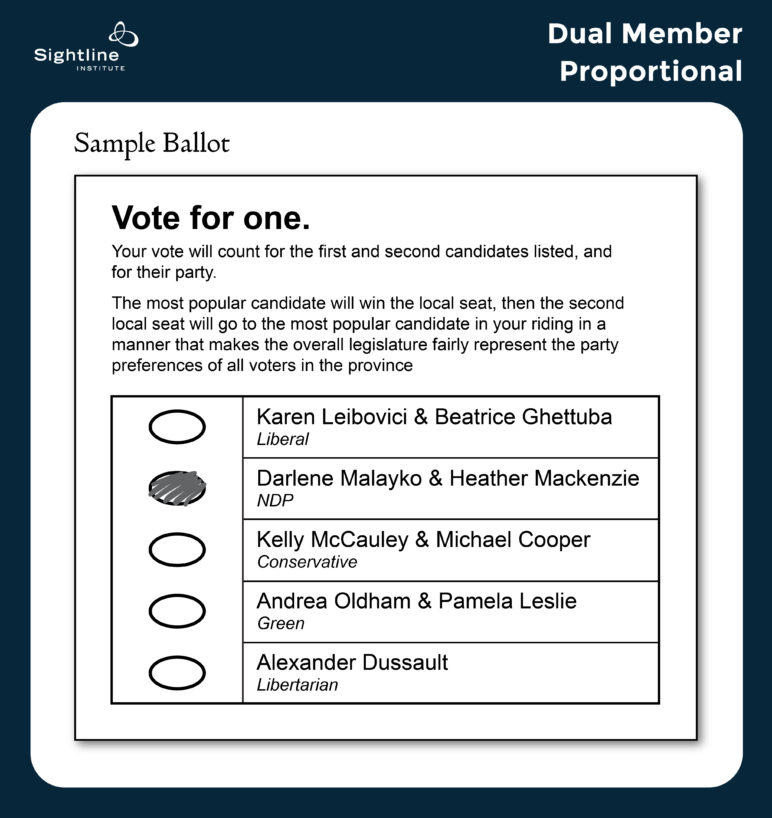

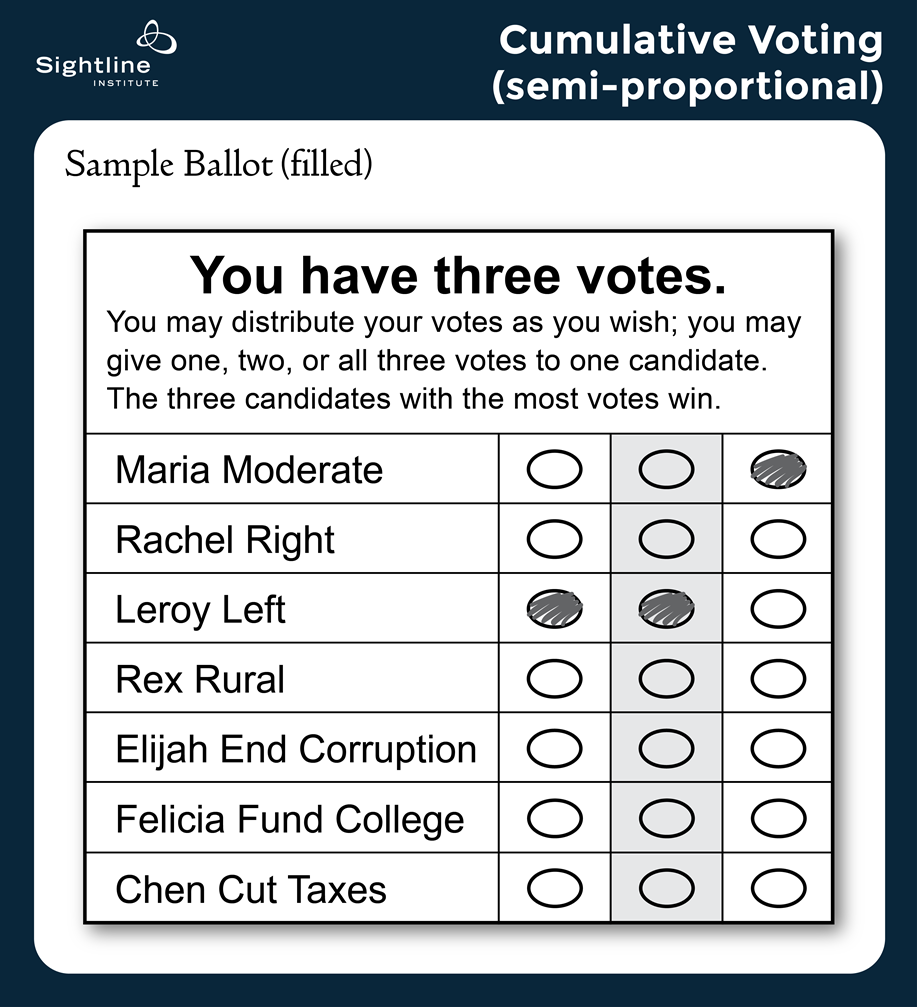
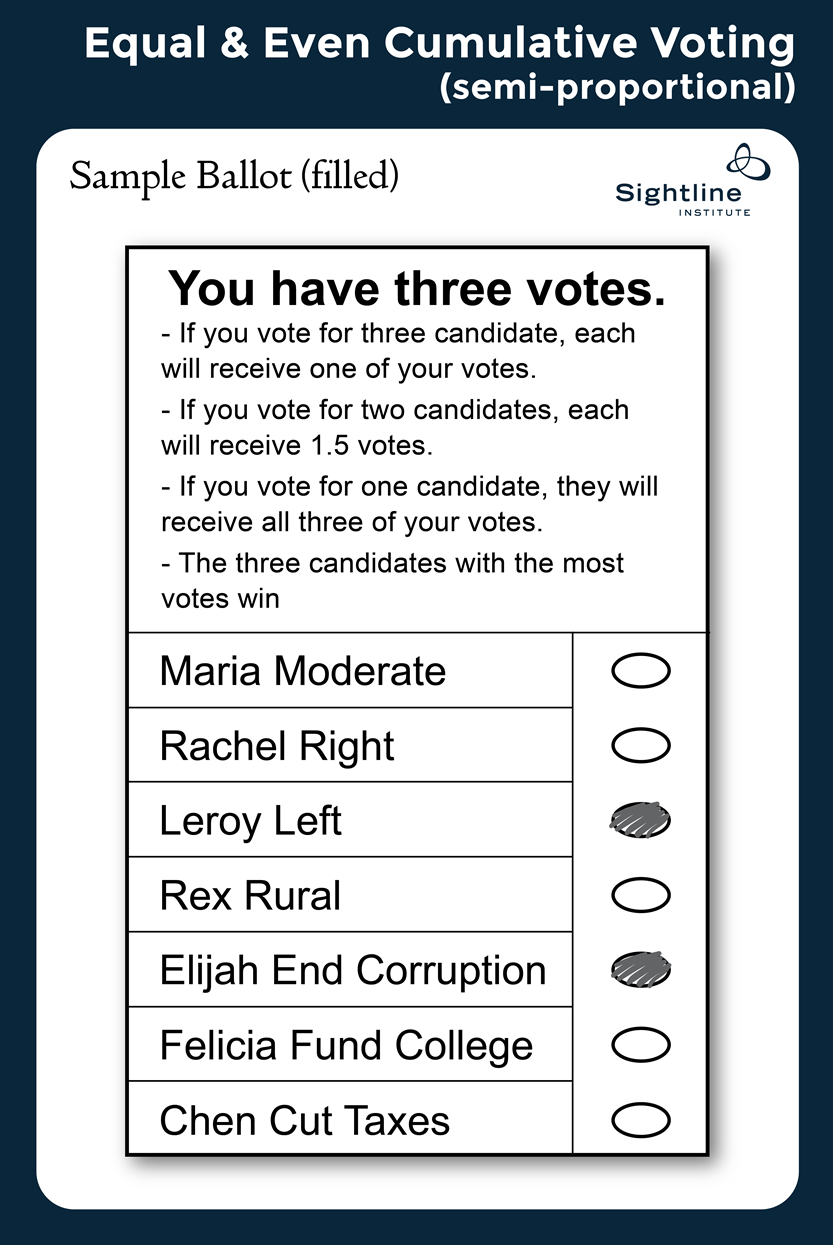
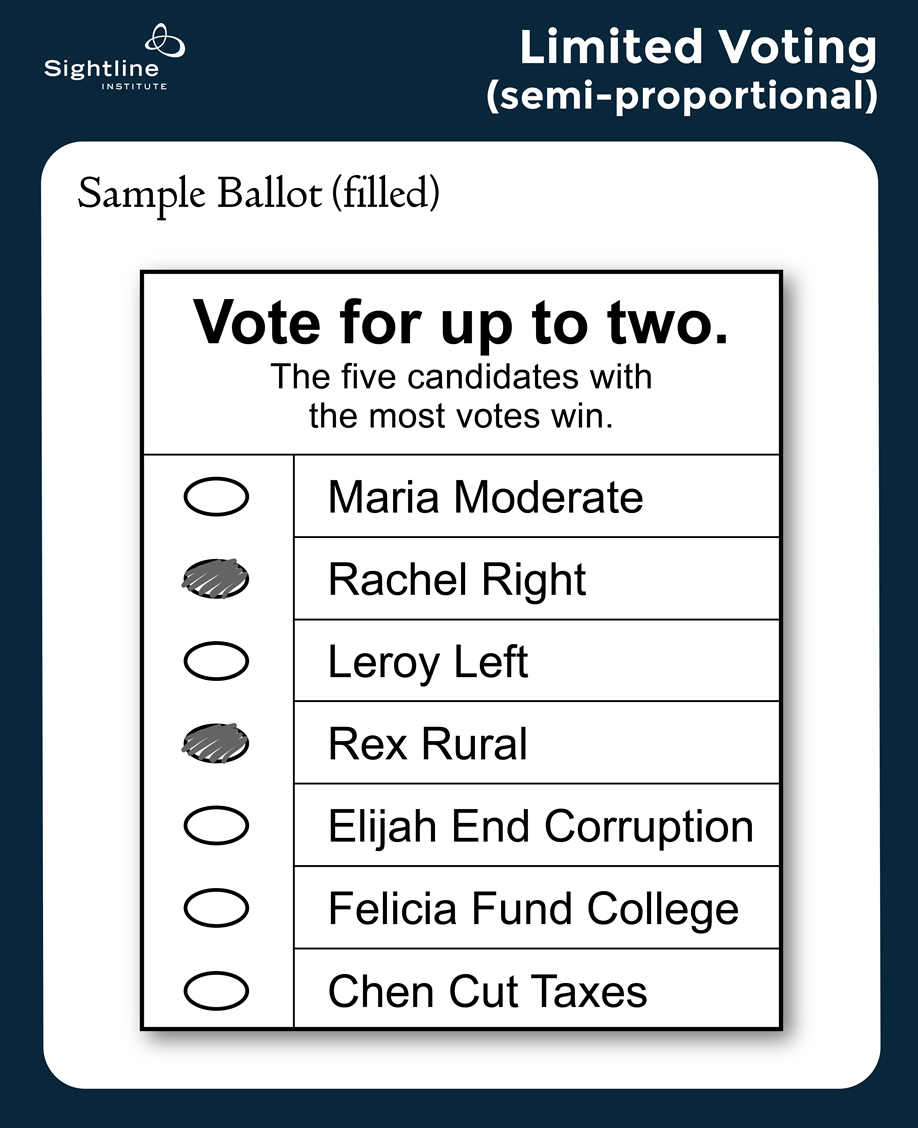
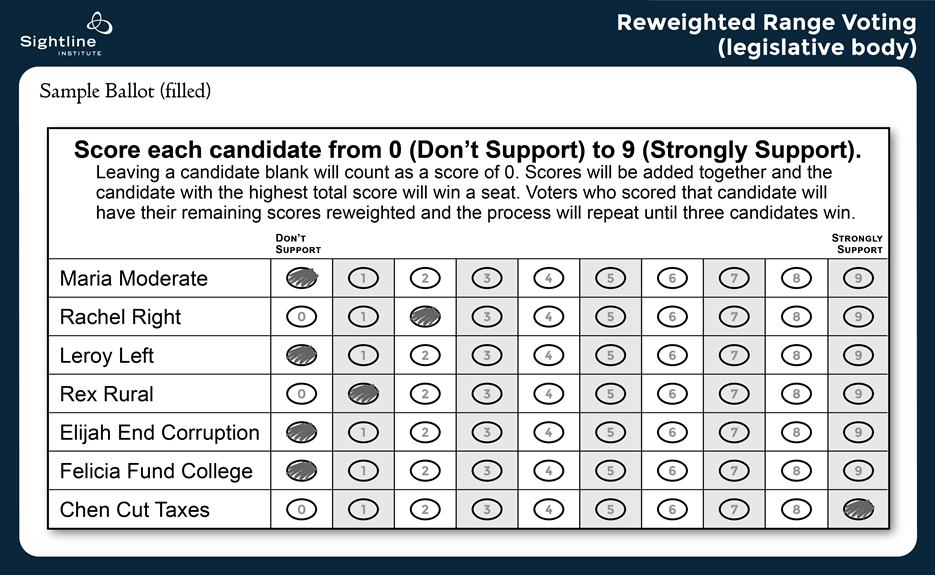

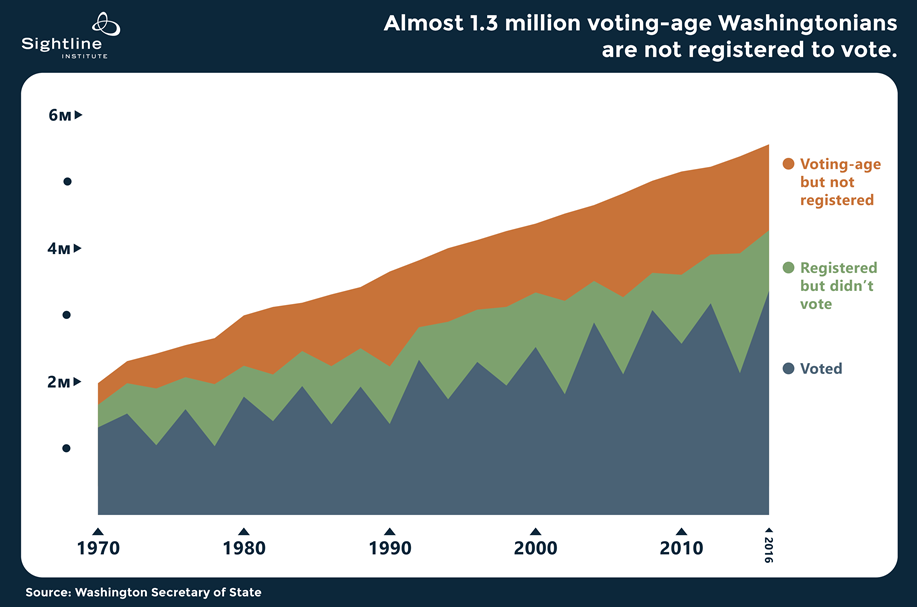
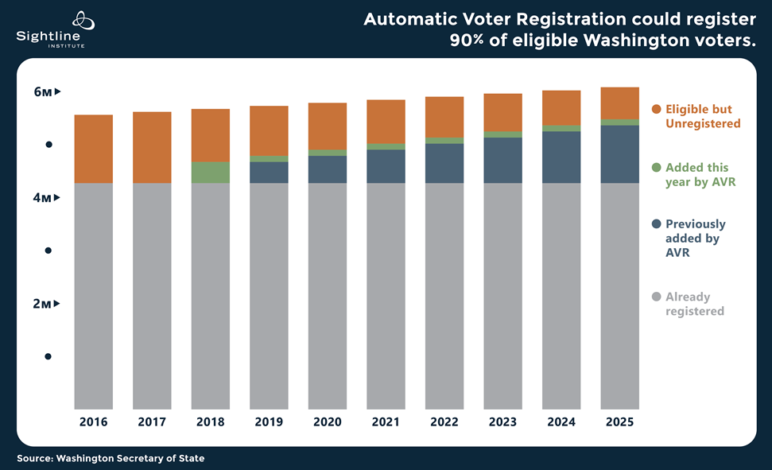


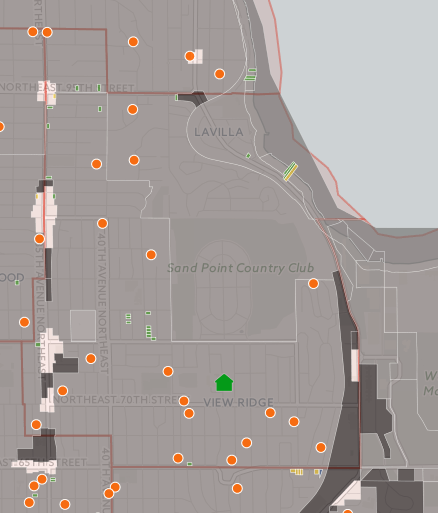

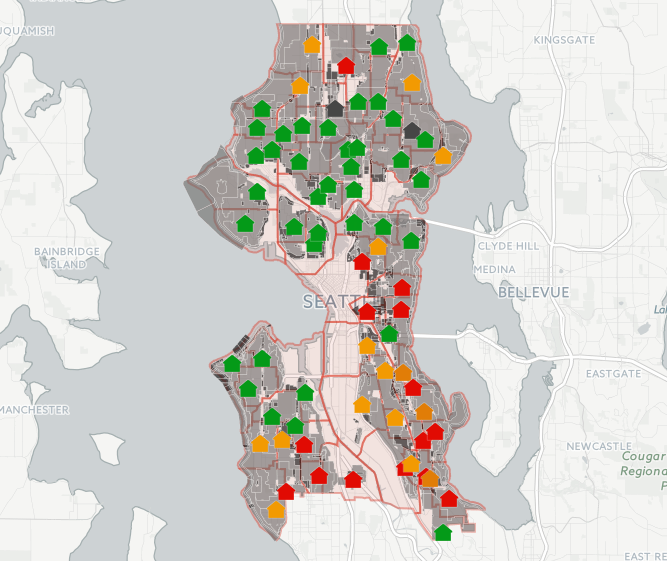

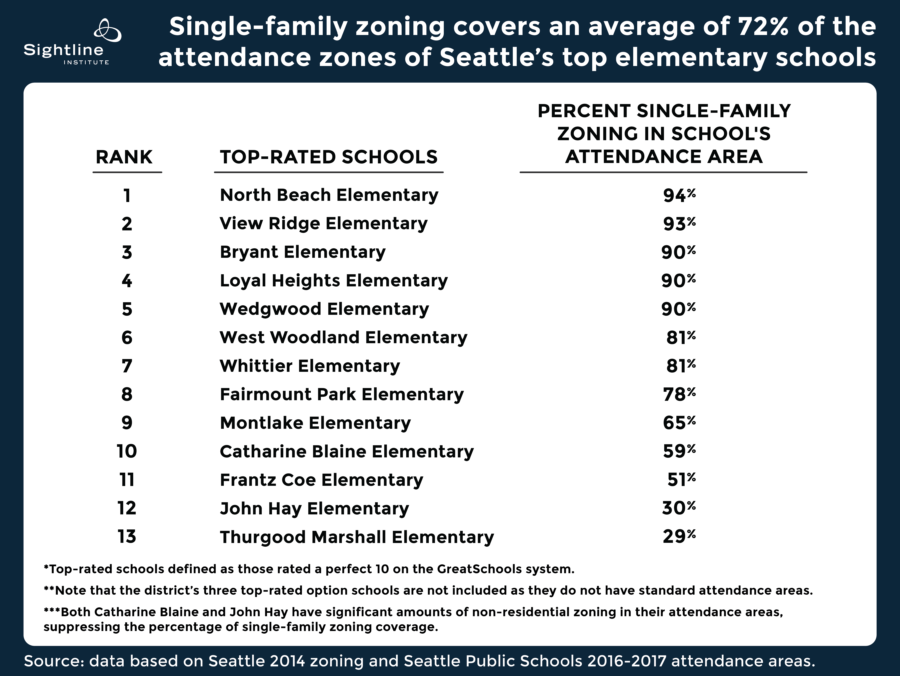
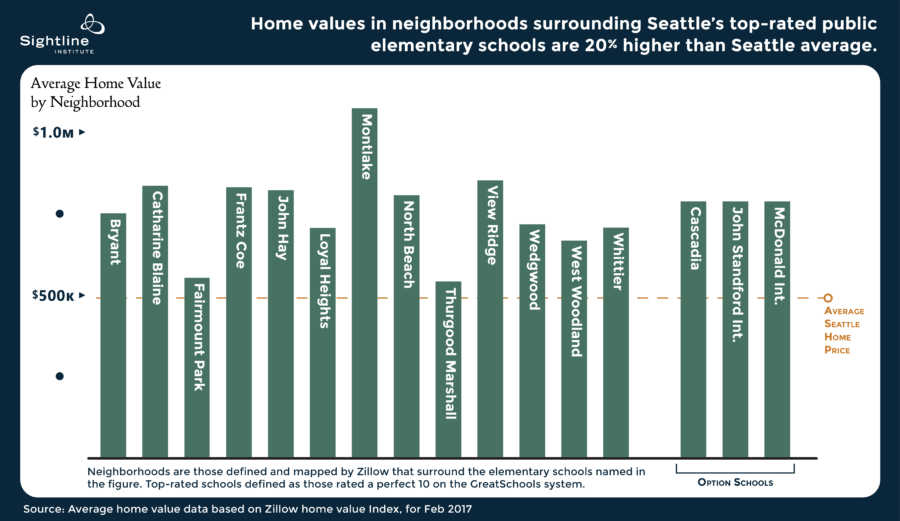
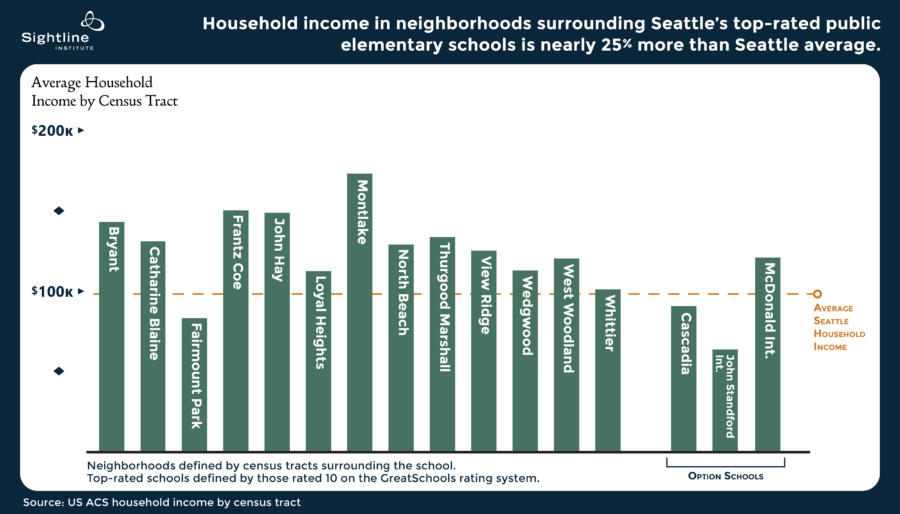
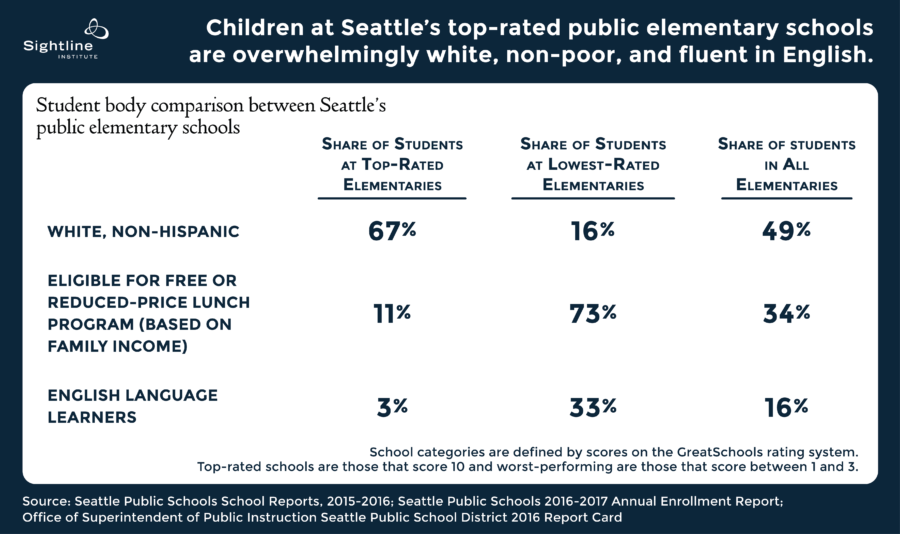
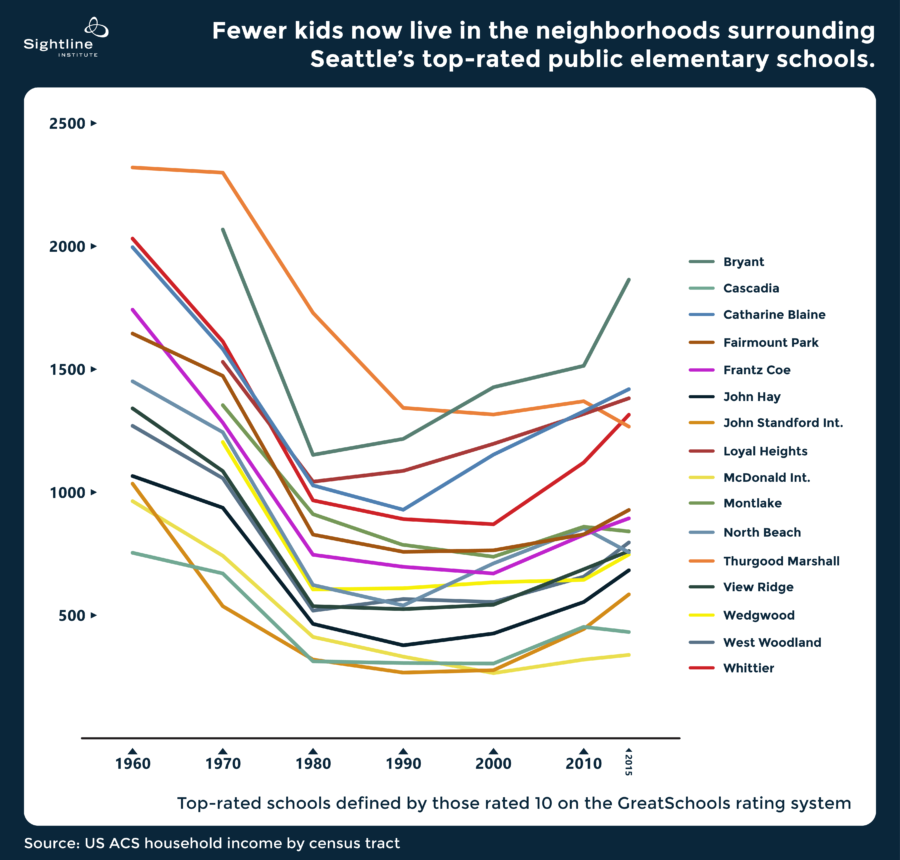

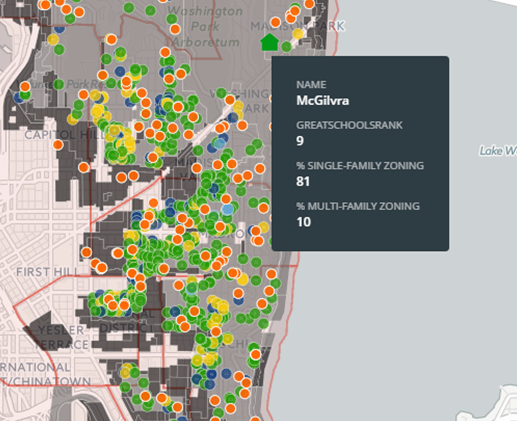
 The map includes the 14 option elementary and K-8 schools in the Seattle Public School district. The pop up boxes indicate whether a school is an option school under the status section. These schools don’t have defined attendance zones and students from across the city attend them. We’ve included these schools in our analysis in this article as geography is a factor in admission decisions. Since the option schools do not have defined attendance zones their pop up boxes show null values for percentage of land of each zoned type and our analysis of percent of zoning type by school attendance zone does not include option schools.
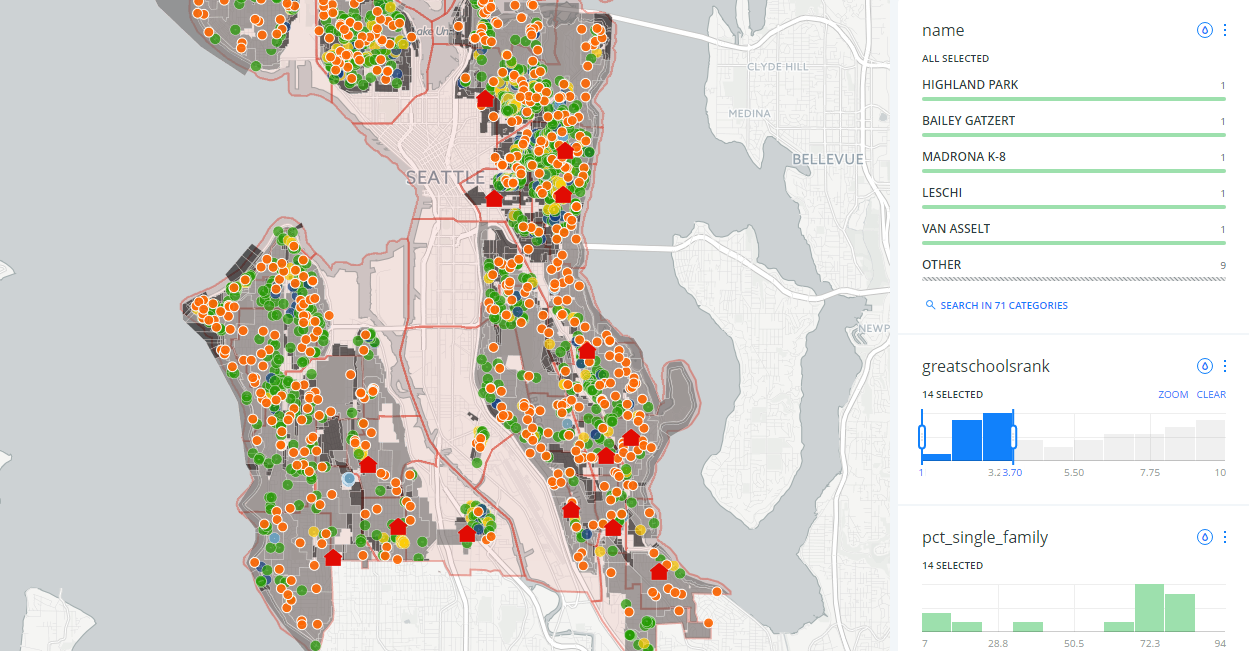
")
")


")
")


")
")
")
")
")
")
 by Michael used under CC BY-NC-ND 2.0 (https://www.flickr.com/photos/kansas_sebastian/4472445722/)")
 by Michael used under CC BY-NC-ND 2.0 (https://www.flickr.com/photos/kansas_sebastian/4472445722/)")
 by Michael used under CC BY-NC-ND 2.0 (https://www.flickr.com/photos/kansas_sebastian/4471614481/)")
 by Michael used under CC BY-NC-ND 2.0 (https://www.flickr.com/photos/kansas_sebastian/4471614481/)")
")
")
")
")
")
")
")
")
")
")
")
")
")
")
")
")
")
")