[prettyquote]”You put a big black blob in the middle of Canada, and you reach out a tentacle to every part of the Coast, there is a giant octopus that is essentially wrapping its tentacles around North America.”[/prettyquote]
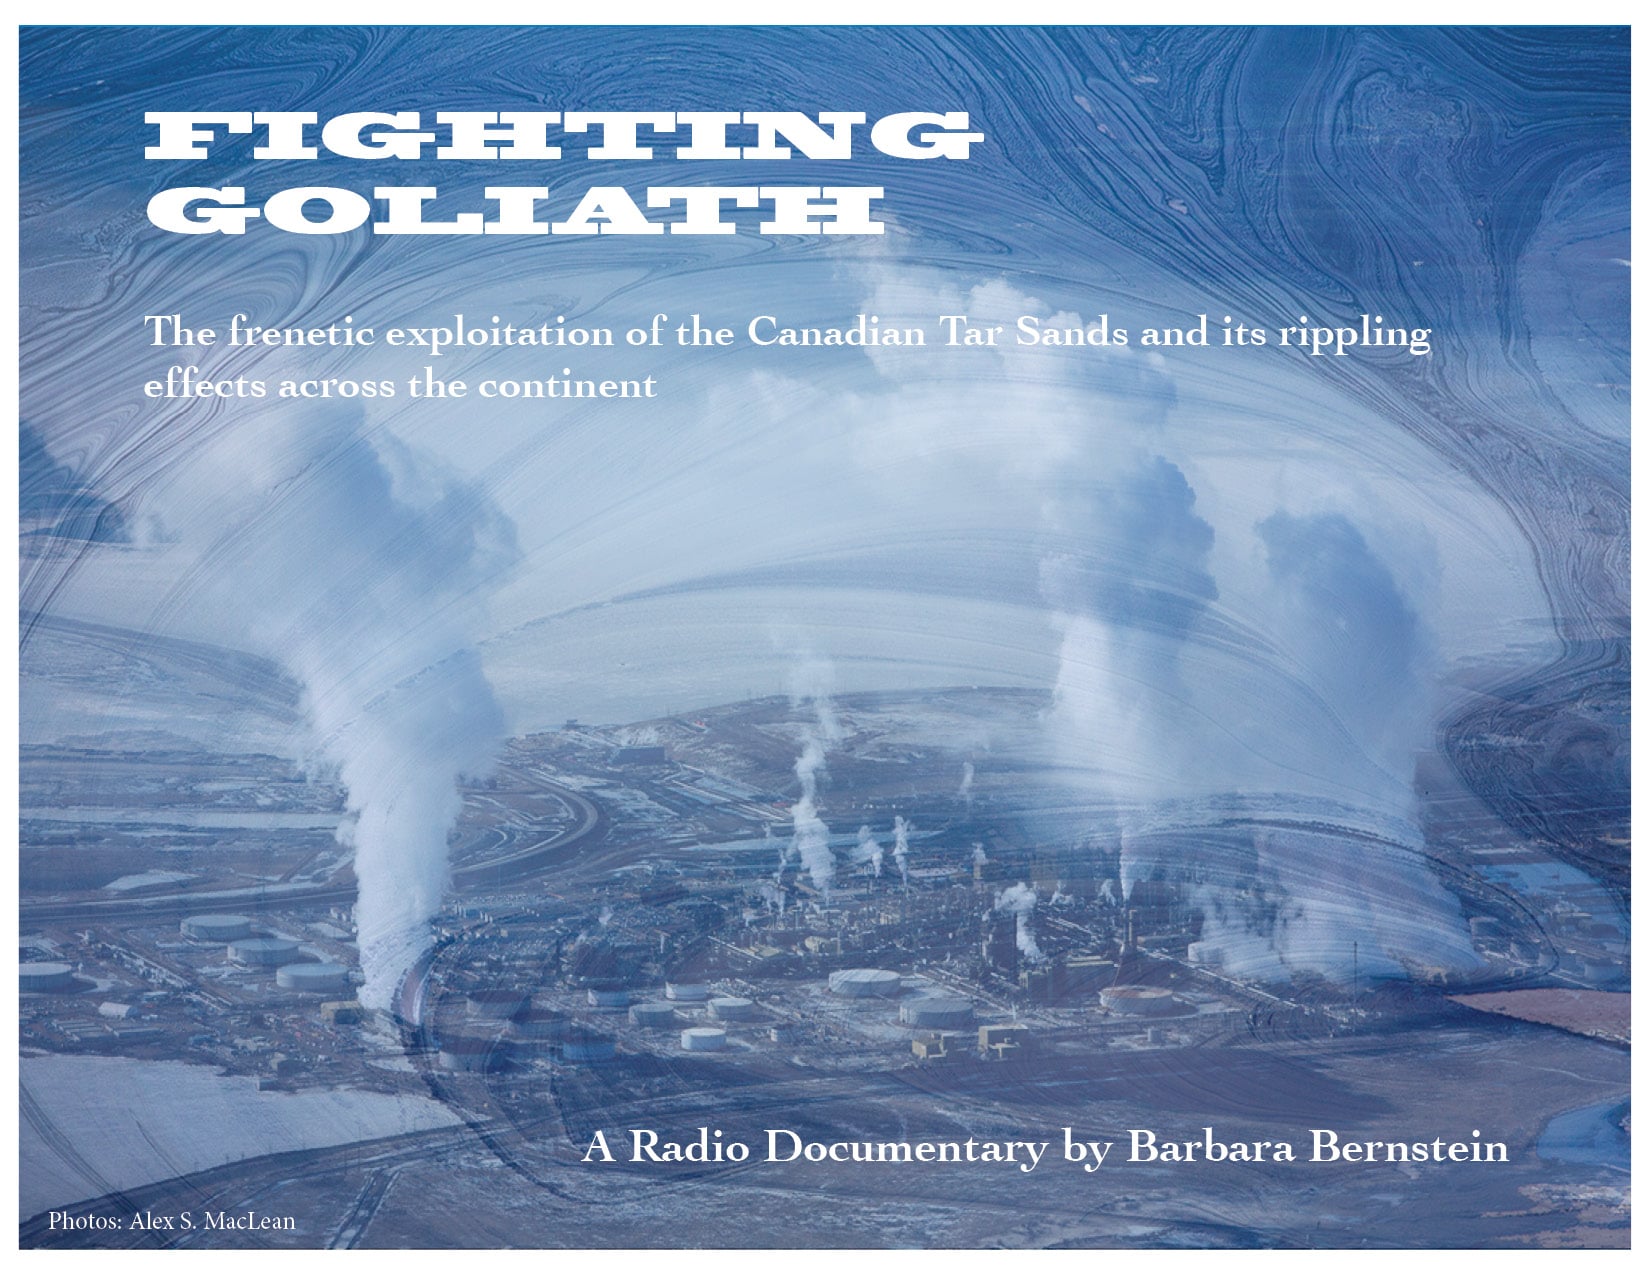
Last year, Portland’s KBOO Community Radio profiled what is “the largest industrial project on Earth”: the North American tar sands. Typically, one hears of the “Canadian tar sands,” as if the issue is one that lives only north of the US national border and need not concern American citizens. But reporter Barbara Bernstein’s documentary, “Fighting Goliath,” revealed an alarming and very real threat that deserves the same scrutiny as the coal export and oil train schemes better known in the Northwest and Plains states.
However, this is not just an account of the tar sands as a sprawling behemoth, from their massive open pit mines to their toxic tailings ponds, from their environmentally sensitive transport routes to their huge water needs and giant equipment and infrastructure demands. Bernstein also tells the story of a powerful and diverse group of citizens who came together to oppose tar sands expansion in the corporate interest and to demand accountability from government officials in responding to the public’s concerns.
It’s the most riveting hour of radio you’ll hear for a while, guaranteed. Listen in.
Is it safe to use rain barrel water collected from your roof to irrigate homegrown lettuces, strawberries, and tomatoes? The question is so straightforward, and yet the answer has been so murky. In the past, many sources cautioned against this use of stormwater runoff, while some, including Seattle Public Utilities, suggest it’s OK with water … Read more
2014 was a big year for Sightline, inside and out. We took deeper dives into family-friendly urban policy, money’s influence on our democracy, and making polluters pay for their carbon pollution. We also continued our leading research on coal and oil exports out of Cascadia; traffic trends, transit funding, and rideshare safeguards; and a number of other key topics for promoting sustainability across the Northwest. And you, dear reader, you dove right in with us! Thanks for a great year of wonking out, and cheers to 2015! Now a look back at your faves:
14. Bertha vs. the Bus: As Seattle prepared to vote on key funding for King County public transit earlier this year, a snappy infographic from Jennifer Langston proved a jaw-dropping comparison between the cost of digging a single foot of Seattle’s doomed tunnel and that of funding a better transit system.
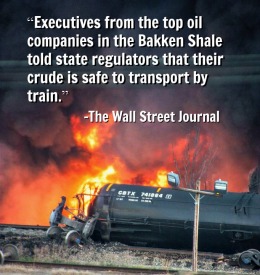
12. Why Bakken Oil Explodes: Eric de Place explains why that particular strain of Dakota-originated oil rolling through our backyards and along our shorelines is exceptionally flammable.
11. Bad News for Ridley Terminal: They say bad news sells better than good news, perhaps especially when it comes to a major coal export facility in British Columbia.
10. To Revitalize Downtowns, Tax Land Speculation: Yes, something with the subtitle “5 reasons to love land-value taxes” was one of your most read articles of 2014. We’re proud to nerd out with the best of ’em.
Portland and Vancouver BC officials, welcome to Seattle’s pain. With Uber launching (or threatening to launch) its app-based personal transportation service in your city, you have a real puzzle to solve.
A purely regulatory approach to cutting carbon is like Thanksgiving dinner without the turkey. But just charging polluters without any other policies is like eating turkey by itself with no cranberry sauce or stuffing to make it delicious, no mashed potatoes, green beans and yams to round out the meal, and no pie to sweeten the experience. In Oregon and Washington, we want the full dinner. Here’s how serving up a carbon price carefully paired with other policies makes for a delicious meal.
Policies can complement making polluters pay in the following ways:
Keep costs down by slashing carbon that a price can’t reach because of market barriers
Achieve other benefits—cleaning the air, developing new clean tech industries—in addition to trimming carbon pollution
By doing both of the above, complementary policies can pick the low-hanging fruit as well as the exotic fruit and put them all together in one reasonably priced basket.
Energy giant Kinder Morgan has big ambitions. The firm aspires to multiply its coal export capacity in the Gulf Coast region even as it seeks permission to build a huge new oil pipeline in the Pacific Northwest. These projects could boost Kinder Morgan’s profits, but they also raise serious questions about what the projects might cost neighboring communities.
Today, Sightline Institute is publishing a new report, “The Facts about Kinder Morgan,” that examines the facts about the company’s behavior. The report reveals that the company’s track record is one of pollution, law-breaking, and cover-ups.
In public, Kinder Morgan points out that it is already operating coal export facilities in Virginia, South Carolina, Louisiana, and Texas. Or, as the company’s spokesperson said when the firm was pushing a failed coal export plan in Oregon, “What we’re proposing is not something we don’t already do.” And that’s exactly the problem.
[button link='{“url”:”https://www.sightline.org/2017/06/06/map-the-future-is-carbon-priced-and-the-us-is-getting-left-behind/”,”title”:”Click here for an updated version of this map”}’]
Oregon and Washington leaders are contemplating turbocharging their clean energy transition by instituting carbon pricing here in the Pacific Northwest. Will a cap or tax on carbon work? Has anyone else ever done this before? Why, yes. Since you ask: Scandinavian countries have been pricing carbon for more than two decades. The European Union Emissions Trading System (EU ETS) has been pricing carbon for almost a decade. US states and Canadian provinces have been pricing for years. Today, there are 39 (1) different programs that collectively put a price on 12 percent of all the greenhouse gas (GHG) emissions in the world. And when China’s national program starts in 2016, almost a quarter of global GHG pollution will carry a price tag to speed the changeover to clean energy. The animated map below shows carbon pricing programs around the world, with the size of the bubbles indicating the amount of pollution priced.
Carbon pricing programs come in many flavors: tax, cap-and-trade, or hybrids, and implemented at the level of country, region, state, or even city. (A fully sort-able table of the programs is at the bottom of this article.) The biggest program is the EU ETS, covering a little less than 2,000 million metric tons (MMT) of GHG emissions, or about 45 percent of all the emissions in the European Union. Japan’s carbon tax is the next biggest player, covering about 800 MMT, or 70 percent of Japan’s emissions. China, with several years of pilot project experience under its belt, is now committed to rolling out a cap-and-trade program in 2016 that will dwarf both the EU and Japan’s programs, probably covering about 5,000 MMT of pollution. For reference: the entire world emits about 36,000 MMT, so China’s program alone will price about 13 percent of global emissions. To get a sense of how the carbon pricing programs relate to global emissions, the map below shows the world’s biggest polluters. (You can also see countries re-sized by emissions here.) The US has a conspicuous mismatch between its large red pollution bubble and the lack of a green price bubble. President Obama, not to be outdone by the Chinese, has announced an agreement with China to cut carbon pollution. However, new Congressional leadership has vowed to move in the opposite direction by delaying and undermining federal efforts to cut pollution.
Original Sightline Institute graphic, available under our free use policy.
Here are a few questions about global carbon pricing programs that Pacific Northwest leaders might want answered:
How do you know it’s going to stay revenue-neutral?
This time I’d like to share with you the #1 question from progressives about revenue-neutral carbon taxes:
How do you know it’s going to stay revenue-neutral?
It’s the same question! The motivations for asking the question, of course, are different. Conservatives ask because they’re worried about government getting bigger, that is, when we compare revenues from the existing tax system X with revenues from a potential new tax system Y, they want to make sure that X ≥ Y. Progressives ask because they’re worried about government getting smaller, that is, they want to make sure that X ≤ Y.
As a Sightline reader, you are well informed about the challenges that the Northwest faces in the journey toward health, safety, and sustained prosperity for all. Perhaps you’d like to make a difference, but are unsure about where to begin. At times, sustainability matters and policy choices can seem like colossal burdens in the journey to a happy, healthy planet. To begin can seem a tremendous act.
Luckily, we are in this together, and donating to Sightline is an easy way to help!
For the next two weeks we’re asking our friends, readers (that’s you), and subscribers to make a financial contribution in order to sustain our research, analysis, and news service.
A tax and a cap are just different vehicles for delivering the same thing: a carbon price that holds polluters responsible for their pollution, drives the transition to clean energy, andstaves off the worst risks of climate volatility. With a tax, you know the price in advance but not the quantity of carbon pollution per year; with a … Read more