While Cascadian climate hawks have been fighting rearguard actions against proposed pipelines and coal trains, California has been rolling out an ambitious carbon cap. Such a cap is the principal alternative to a carbon tax—such as British Columbia’s carbon tax shift—as a method for putting a price on carbon in Oregon and Washington. It’s an option Oregon will consider next year in its impending revenue-reform debate. In Washington, the Golden State’s cap appears to be the model that Governor Jay Inslee favors: he recently convened a panel of leaders to design a state “Cap and Market” system.
The panel, after deliberation, may conclude that the best choice is for Washington to simply photocopy California’s rules and join the Golden State’s system. California actually designed its carbon market so that other states can plug themselves into it. Or the panel could opt to design its own system. Either way, Cascadia’s climate warriors would do well to study how their southern neighbor put a price on carbon, because the Golden State’s rules form the dominant carbon trading market in North America. Just last week, the state auctioned more than 20 million carbon-emission permits at $11.50 apiece.
Here are 17 things worth knowing about that market. Some of them are details, even arcane ones, but the details of a carbon pricing system matter enormously. They matter more than whether the underlying mechanism is a tax or a cap. (Sightline laid out the details of good design in Cap and Trade 101.)
1. The cap is strong . . . until 2020.
California’s carbon cap—the flagship in an armada of global warming policies launched in 2006 as Assembly Bill 32 (AB 32)—came into force in January of 2013, initially covering the electric-power sector and large factories with giant carbon footprints. Next year, it expands to the carbon dioxide from gasoline, diesel, natural gas, and other fossil fuels (and to other greenhouse gases such as methane). By then, the Cali cap will be the most comprehensive, though not the most aggressive, carbon-pricing regime in the world.
The crux of cap-and-trade is the cap itself: a legally enforceable limit on total climate-altering pollution. The cap diminishes over time, gradually squeezing carbon out of the economy.
The Air Resources Board, a branch of the California Environmental Protection Agency, designed and enforces the cap. ARB issues one permit for each ton of carbon dioxide emissions allowed each year. Once the cap is fully phased in next year, just about everyone who sells fossil fuels or fossil-fuel-powered electricity into the California economy will have to obtain enough permits to cover the emissions from their fuel or electricity.
The total supply of emissions permits will step downward by 2-3 percent per year for the rest of this decade so that emissions return to the 1990 level by 2020. After 2020, the same annual cap will likely apply, but as of yet, the legislature has not told ARB to ratchet down permits further. The state is under a non-binding executive order to reduce emissions an additional 80 percent by 2050, and the legislature has begun debating a continued downward trajectory of permits. But the program’s future depends on whether climate hawks retain sufficient influence in Sacramento.
2. Is it working? So far so good.
California’s cap is new, so it’s too soon to make unequivocal statements about its effectiveness. Complete emissions data from the Golden State are only available through 2011—two years before the launch of the cap. So far, though, ARB’s systems of rules and enforcement mechanisms seem well crafted and appear to be functioning as intended. Barring some unforeseen political change, we expect they will trim emissions as intended through 2020.
Overall, the state’s emissions (shown below) rose from 1996 to 2007, then dropped with the Great Recession and have since plateaued. To return to 1990 levels by 2020 will require a 5 percent drop below the 2011 level. Because California’s population continues growing quickly, emissions per capita will have to drop even more, as the figure shows. (Sources for the figure are at the end of the article.)
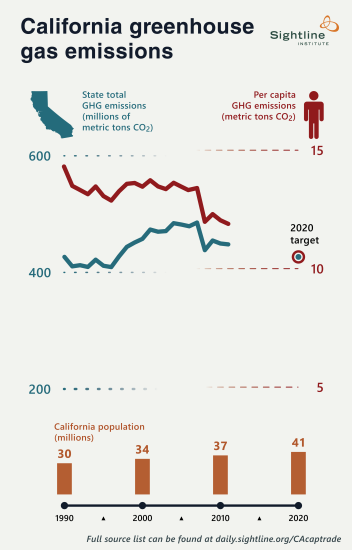
Original Sightline Institute graphic, available under our Free Use Policy.
3. Most of the dollar value of the permits will benefit the public.
The “trade” in cap-and-trade means that the companies regulated under the cap can sell their emissions permits if they have more than they need or buy permits from others if they’re short. These emissions permits are like shares of stock or commodities such as pork bellies: their value varies and you can sell them for cash.
Many cap-and-trade systems distribute emissions permits for free—an approach Sightline has long criticized as regressive and a reward to dirty industries. Sightline, like most policy analysts, prefers auctioning permits, so that the public retains their full value and can invest it in public purposes, such as buffering low-income families against higher energy prices.
Next year, when the cap expands, ARB will auction most of the new permits—those for petroleum and other fuels. That’s great news, and it will account for about half of all permits in the years ahead. As for the rest of the system—the permits covering electricity, large factories, and other sources of greenhouse gases—well, it’s complicated. But the bottom line is that, even though ARB has been distributing about 90 percent of emissions permits for free in 2013 and 2014, it’s devised policies that are hard to criticize too harshly. By our estimation, most of the dollar value associated with the permits will either be captured in the auction or be allocated in a way that provides at least indirect benefits to the public.
First, ARB is not grandfathering permits—distributing free permits to large industrial facilities based on their past emissions. Instead, it has devised a formula that provides free permits (shown in blue in the figure below) to large industrial companies whose products compete head-to-head with products from outside of California. The goal is to prevent putting California industries that sell into out-of-state markets at a disadvantage. The formula goes further and gives extra permits to the firms that have done the most to reduce their emissions. It’s not a perfect policy. It still siphons money to the state’s biggest carbon polluters, and no formula can capture all the nuances of market competition. Still, it’s not grandfathering.
Second, ARB is distributing most of its free permits to electric utilities (orange in the figure below) and, starting next year, to natural gas utilities (yellow, below). The utilities get the permits for free, but the California Public Utility Commission requires all investor-owned utilities to sell their permits in ARB’s auction. Of course, the utilities then need to buy permits to cover their own emissions. The point of this Rube Goldberg device is to determine the dollar value of the permits: the CPUC orders utilities to devote all of the proceeds from the sales of their permits for the exclusive benefit of their retail customers.
For example, the CPUC ordered Pacific Gas and Electric, the giant private utility that serves much of northern California, to give “climate credits” averaging $35 to residential customers as line items on their April bills. It will do so again in October. That’s enough money to offset the pocketbook bite of carbon pricing—the increased price of PG&E electricity—for many customers, especially low-income households. Because the credits come as a flat amount that is the same regardless of how much power a household uses, they don’t diminish the economic incentive to reduce emissions. And they counter the regressive nature of carbon pricing: poor families get the same credit as rich families, although poor families use far fewer kilowatt-hours. In effect, California has hacked together a crude cap-and-dividend system through its utilities.
Climate credits are progressive in another way as well. California offers discounted power rates and energy-saving services for qualifying low-income families, further trimming their bills. Climate credits consequently stretch further.
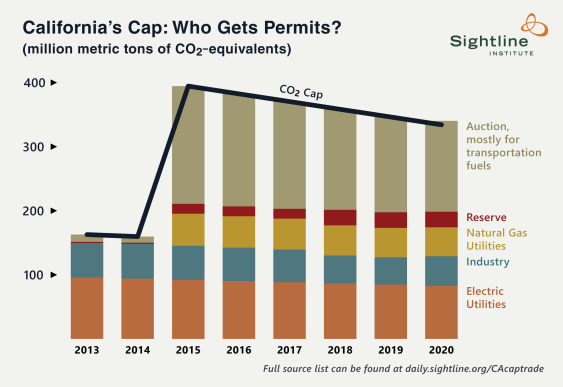
Original Sightline Institute graphic, available under our Free Use Policy.
4. The cap will hurt working families some, despite Cali’s best efforts.
California chose to take imperfect action and address regressivity through policies like utility credits. These credits are a blunt instrument for sharing carbon-pricing revenue. They allocate credits one per electric meter, whether the meter serves one person or eight. A better policy would distribute climate credits through refundable state income tax credits and the electronic benefit transfer system. The tax and benefit systems have the subtlety and comprehensiveness to distribute climate credits to those who need them most.
Californian climate hawks had bold plans for just such low-income rebates, one advocate told us. Unfortunately, she said, “The lawyers came in and shut down the party.” Legal and political constraints made rebates impossible. In California, new taxes must win supermajority support in the state legislature, while state agencies can impose fees authorized by simple majorities. AB 32 passed by simple majority in 2006, granting power to ARB to establish cap and trade. To defend the system against lawsuits arguing that cap and trade is an unauthorized tax, ARB must collect and spend auction revenue in conformity with legal definitions of a fee.
To qualify as a fee, a revenue stream has to pass a set of legal tests, among which is that the fee pays for programs closely aligned with the fee itself. Tax revenue can be spent on whatever the legislature chooses; fee revenue can only flow to programs that advance the purpose of the fee. A tax can pay for schools or police or state parks and anything else the legislature chooses, but a garbage-collection fee must pay for garbage collection.
In the case of cap and trade, the purpose of the program is to reduce greenhouse-gas emissions, so California’s auction revenues must fund emissions-reduction programs. Distributing the proceeds as rebates to poor families or as dividends for all Californians would be to treat auction revenue as a tax. The whole cap-and-trade program might then be vulnerable to a lawsuit.
Utilities are regulated private companies, not public entities, so the closest California could come to rebates for working families was its utility hack: free permits, mandatory auctions, mandatory “climate credits.” For the poorest families, who consume little power and pay discounted rates, these credits provide a net gain: their value is far greater than costs these families will see as a result of the higher power prices associated with the carbon cap in the electricity and industrial sectors.
That’s good news, because, next year, when the auction expands to petroleum and more, household costs are likely to begin rising more and the state has only weak tools—two of them—for further buffering the poor.
First, economy-wide energy efficiency standards and investments paid for with cap revenue will help trim the energy consumption of California households. They’ll have more efficient appliances, vehicles, and homes, and, for some, energy consumption may decline more than prices rise.
Second, California has committed that at least 10 percent of auction funds will go to clean-energy and climate-protection programs in neighborhoods where disadvantaged people are disproportionately represented. It also requires that 25 percent of auction proceeds go to projects that particularly help disadvantaged communities in some way.
Project-by-project investments in building retrofits, better transit, and other green infrastructure—no matter how desirable they may be—cannot buffer all working families from the pocket-book effects of putting a price on carbon. But they’ll buffer many families.
California’s cap is distorted by the supermajority voting requirement in the state constitution. Oregon has a similar, though less extreme, supermajority rule for new revenue. Washington, however, does not. The Evergreen State may therefore be able to do better by its working families in its carbon pricing system than California does.
5. California may soon get more than $1 billion a year from its carbon auction.
Look at the olive area that dominates the chart above. That area mostly represents permits for transportation fuels. Starting next year, the state will begin auctioning these permits and placing the revenues in a Greenhouse Gas Reduction Fund.
How much revenue will come into the fund depends on the auction price of permits, of course, but it’s likely to exceed half a billion dollars in the next fiscal year. That figure could increase to as much as $2 billion a year for the rest of the decade or roughly $50 a year for each of the state’s 38 million residents.
The state is supposed to invest these funds in programs that reduce carbon pollution. The state’s investment plan sketches expenditures in sustainable infrastructure, energy efficiency upgrades, natural resource conservation, solid-waste reduction and recycling, and low-carbon transportation systems. Governor Jerry Brown has proposed dedicating $250 million in 2014 to the controversial high-speed rail line in development between Los Angeles and San Francisco.
Whether the Golden State will do a good job of managing its carbon auction proceeds is a great, unanswerable question. Time will tell.
6. The scope is almost comprehensive.
By the end of 2015, the Cali cap will cover 85 percent of California’s greenhouse gas emissions, including non-fossil-fuel emissions of carbon from cement manufacturing and “minor greenhouse gases” such as methane. It even includes “carbon by wire,” that is, the emissions from out-of-state coal and natural gas plants that sell electricity into the state’s grid. Following what appears to be a standard adaptation of IPCC measurement rules, however, California does not include in its emissions inventory—or in its carbon pricing policies—fuel used to power planes or ships with destinations beyond the state border.
For comparison, the BC carbon tax covers only fossil fuels burned inside the province; it does not include carbon by wire or fuel used by planes or ships leaving the province. Altogether, the BC carbon tax shift encompasses about 70 percent of provincial greenhouse gas emissions. The Northeast states’ Regional Greenhouse Gas Initiative (RGGI) covers only electricity, and not carbon by wire. The European cap-and-trade system covers electricity and industry but not motor fuels. California’s program, although its current carbon price is lower than that in British Columbia and some European carbon taxes, will soon be the most comprehensive in the world. And as the cap gets tighter it may gain depth to go along with its breadth.
7. The cap requires zero paperwork from most Californians.
Any carbon price has to actually attach to fossil fuels at specific, physical locations. ARB made life easy for itself by choosing locations that would limit the number of companies it would need to regulate: in the entire state, only an estimated 350 businesses have legal obligations under the cap. Some of these companies’ 600-or-so regulated facilities are “upstream,” such as power plants, while others are “midstream,” such as wholesale petroleum distribution centers, but all of them are convenient chokepoints in the fossil fuel economy. In short, most Californians will see the impacts of carbon pricing in their fuel bills—and in the funding it produces for clean-energy solutions and utility rebates—but they’ll never fill out of a form.
8. The cap smartly allows “banking,” not “borrowing.”
The Cali rules allow regulated entities to save permits issued this year for use in a future year (banking) but not to borrow permits from future years to use now (borrowing). California’s permits have a “vintage year” and can be used at any point during or after that year. This is good policy, as it adds flexibility for participants and stabilizes permit prices without blowing a hole in the cap.
9. Trading is tightly regulated, as it should be.
The first permit auction took place in November of 2012, and it and subsequent auctions have gone smoothly. Any individuals or entities that register can participate in the trading of permits, which is good thing for the smooth functioning of the carbon market. ARB has also introduced a variety of market monitoring efforts. For example, the state enforces limits on how many permits one may hold and disclosure rules require that the authorities know who owns each permit at any point in time. Such policies provide safeguards against market manipulation and fraud of the type recently documented in Wall Street high-frequency trading and “dark pools.” Gaming of this type is unlikely in any event, as Sightline has argued, but ARB is not taking chances.
10. California carefully restricts and monitors offsets.
California allows regulated facilities to substitute qualifying offsets—such as reforestation programs and methane captured from livestock manure digesters—for 8 percent of their emissions permits. Critics have argued that California’s offset provisions are far too generous, endangering the integrity of the cap. Early offsets in the European cap-and-trade program sometimes proved dubious as to their true net effect on global carbon pollution.
We’ll have to wait and see the effect of California’s offsets, but ARB’s regulations suggest that the agency is taking an appropriately hard line. Its offset restrictions may be the toughest in any cap-and-trade system. All offsets must be third-party verified, sited within the United States, provably “additional” to what would have otherwise happened, and from within only five categories so far. The limited availability of offsets that pass those tests may prevent offsets from meeting anywhere close to their theoretical maximum of 8 percent of permits per regulated facility.
11. California’s cap folds in the climate benefits of a carbon tax.
On May 16, ARB auctioned almost 17 million one-ton carbon permits for $11.50 each, plus another 4 million that will not be valid until 2017, for $11.34 each. Between auctions, permits trade on private markets. Their price has trended downward (see page 12) as more auctions have taken place, revealing that emissions reductions are perhaps easier to come by than previously expected. That price translates, very roughly, to 1 cent per kWh of coal-fired power or a dime per gallon of gasoline (except that gasoline doesn’t come under the cap until 2015). In comparison, the BC carbon tax started at $10 per metric ton of CO2 in 2008 and increased to $30 per ton (US$27.50) in 2012, where it has remained.
The February auction price was just above the reserve price—the minimum bid allowed. The reserve price started at $10 per ton in 2012 and goes up annually by 5 percent plus inflation. This escalating reserve price accelerates emissions reductions if they prove inexpensive. It establishes a predictable floor beneath which the carbon price will not fall, and that price floor tells the entire energy economy that cheap carbon is forever gone, just as a carbon tax would. The inflation-adjusted price of carbon will be no lower than $15 a ton in 2020. By 2031, assuming extension of the program, the floor price will be above $25.
12. California’s “reserve” could speed the transition beyond carbon.
Some cap-and-trade systems set top prices called “pressure valves” that threaten to blow holes in the cap by allowing waivers and exemptions. California’s does not. Instead, it has a “price containment reserve” (shown in red in the figure above). ARB holds back a few percent of permits from each auction and deposits them in the reserve. If carbon prices rise across a high trigger, some of these permits go to auction, helping to tame prices. This reservoir of permits not only serves as a shock absorber against price spikes, it also tightens the cap in regular years. ARB projects that permit prices will stay below the trigger price; if that happens, the state will actually end up below 1990 levels in 2020.
13. The governor can put the cap on hold.
Less admirable about this policy is a poison pill buried in AB 32. To win passage, proponents of the bill had to include a provision that allows the governor to suspend the program for a year in case of “extraordinary circumstances, catastrophic events, or threat of significant economic harm”—terms that a science-denying future governor might exploit for political purposes. Indeed, gubernatorial candidate Meg Whitman pledged to do so in her race against Jerry Brown. The governor cannot suspend the state’s income tax or speeding laws in any circumstances. Why should she or he have unilateral authority to suspend its carbon cap?
14. The cap is only part of California’s approach.
California’s carbon cap is only one facet of AB 32. It’s a critical one—the backstop and guarantor of all the others—but it’s not alone.
In fact, by some measures, the cap is not even the main event. The latest ARB estimate suggests that 80 percent of the promised emissions reductions will come from “complementary policies” such as a Low Carbon Fuel Standard, Advanced Clean Car Standards, and a Renewable Electricity Standard. The cap-and-trade program “cleans up the rest.”
Economists tend to dislike this type of complementarity. The philosophy of cap-and-trade is for the market, not public agencies, to choose how to tame carbon pollution. On the other hand, energy markets are riddled with flaws and oddities (such as payback gaps, split incentives, and other principal-agent problems), so the traditional arguments for relying entirely on market incentives are not bullet-proof. Ultimately, it’s a battle between market failure and government failure.
California’s approach—for better or worse—is to wear both belt and suspenders: put a price on carbon but also implement regulatory policies in an effort to fix market failures. The other policies, if they work, trim emissions and thereby keep the price of permits—though not necessarily the overall cost of reducing emissions—lower than it might otherwise be. Policy analysts argue over the costs and benefits of each complementary policy, but regardless of whether the strategy makes policy sense it definitely made political sense: support for the complementary policies helped to carry along the less-popular carbon price.
15. California voters support AB 32, including the carbon cap.
In 2010, elements of the oil industry aimed a ballot measure at the carbon cap, and the rest of AB 32, by offering voters a chance to suspend them “until unemployment drops to 5.5 percent or less for a full year.” By a whopping 62-38 percent margin, voters declined, affirming their support for a clean-energy transition.
16. The courts have so far approved the cap.
In the courtroom, the news service Marten Law notes that AB 32 “has withstood the many challenges it has faced” (updates here and here). Challenges keep coming, but so far, none of them has damaged the law.
17. California’s cap is designed for others to join; Quebec already did.
California’s cap is connected with Quebec’s, enabling refiners, power generators, and other carbon-market participants in the two jurisdictions to trade carbon allowances and offsets. Joint auctions are in the offing. This link is one of the few remnants of the Western Climate Initiative, which tried in 2007 to create a multi-jurisdictional carbon price in seven states and four provinces.
Picking up where WCI left off, the premier of British Columbia and the governors of California, Oregon and Washington signed an agreement in October of 2013 to launch the Pacific Coast Action Plan on Climate and Energy. California’s cap anchors its south and BC’s carbon tax anchors its north. Oregon and Washington, sandwiched between them, have two models of carbon pricing to choose from and, perhaps, join. California has even articulated the conditions a jurisdiction must meet to join its cap and trade system (here, here, and here, on page 95). Washington and Oregon policymakers will no doubt be examining these terms closely in the months ahead.
Research assistance by Pablo Arenas. Thanks to reviewers Kristin Eberhard, Anthony Eggert, Elizabeth Hardee, Katie Hsia, Alex Jackson, and Erica Morehouse for comments on a draft of this article.
Sources for figures: Emissions trends in the first figure are from US Census Bureau and California Department of Finance (population); emissions data from California ARB for 1990-2004 and 2000-2011, with data for 2000-2004 using an average of the (slightly different) figures from these two sources. Emissions include most greenhouse gases, including “carbon by wire” from imported electricity, but not including aviation or boat fuel used for out-of-state travel.
Carbon cap permits in the second figure are from California Air Resources board, assembled and analyzed by Natural Resources Defense Council, San Francisco. To make the chart more readily understood, this chart somewhat simplifies categories of permits.



PSJ
Terrific article! Glad to see that someone is leading the way . . .
Nice job explaining the elements of California’s system, and comparing it to other similar systems. I also thought the description of the complementary measures and the context in which they’re viewed was well done. I hope that Washington and Oregon both join; and that we advance the targets for post-2020.
Thanks!
Phil
work4love
Nice job of not explaining how to get more money from Californian. All these charges to the companies will be passed on to consumers. I will be living California soon……..
Jim Lazar
Nice piece on California.
#4: ONLY the CPUC is allocating residential allowances “one per meter” and I would have thought you would LIKE that approach — rebating the money NOT in proportion to usage. Very much like a carbon tax that rebates it all on a per-capita basis. That approach applies ONLY to the residential allowances, not to commercial, which get folded into the rates. People are responding as intended: the “climate dividend” is NOT being viewed as a discount on the electric bill.
It actually is a huge wealth transfer from McMansions and desert-area single-family homes to apartment and coast-zone dwellers. Most important, it raises the cost of discretionary usage.
BUT, the municipals are NOT following this model; I think all of them are using their allowances to offset their emissions, in essence allocating them on a per-kWh basis.
Changing to #14: THIS economist LIKES the complementary policies. In particular, building codes, zoning, appliance standards, and fuel economy standards. The New England states put a piece of their carbon allowance revenue into energy efficiency programs. Those programs reduce carbon emissions by more than the fee does — and in fact, the allowance prices have stayed at rock bottom in large part because investment in efficiency helps meet the (not-very-aggressive) New England targets.
The California Low-Carbon Fuel Standard is an important one. They have carefully measured the source carbon content of biofuels, so that corn ethanol refined with coal-fired electricity is essentially a wash with gasoline, and does not count. Same fuel refined with wind electricity does. This is an important distinction from most LCFS proposals. er,
Sean Penrith
Alan,
Terrific article covering the essential elements of California’s mechanism nicely done!
Your point, “California actually designed its carbon market so that other states can plug themselves into it,” is a critical one that I feel some overlook. I have heard ARB Chair, Mary Nichols, say pointedly that they will measure their success in CA against the number of jurisdictions they manage to link to.
Sean
Maureen Milledge
thank you for this well-researched and written article. I have taken copious notes, and understand cape and trade versus carbon tax so much better now. This new understanding will come in handy when I and 700 other members lobby in Washington with Citizens’ Climate Lobby “for the political will for a livable planet”.
Benoit St-Jean
Great job ! (But are you British Colombian ?)
There is one fundamental point you missed. This is not a California alone designed system open for others to simply «plug in». This is a system designed by the WCI partners, especially Calif-Québec-Wash-Ontario-Oregon and BC. At the end most backed off for political reasons (and BC because it has its succesful carbon tax). But the important result is that at the end, two leader jurisdictions,Calif and Québec, are setting up what is still bounded to be the base of a truly North-American carbon market.
Quebec didn’t just pluged in to California system. Quebec develop it own C&T system, as comprehensive and rigourous as California’s (at least your link open a California doc that demonstrate that). Then Québec and California linked their systems on the bases that are in the WCI Program Design (www.westernclimateinitiative.org/component/remository/general/program-design/Design-Summary-And-Documentation). They will have in november their first Calif-Quebec common auction of allowances. Now it is dearly hoped that other dynamic jurisdictions, like BC-Wash-Ontario and others, will also set up their own rigourous C&T system and do what’s needed to link with California and Québec.
Avec mes meilleures salutations
Benoit St-Jean, BAA,ACI,LL.M.(environment)
Advisor in international commerce and sustainable development
Montréal
Derek Jones
This whole carbon credit/cap is utter nonsense! In reality they are still allowing the companies or business to pollute. (Sometime above establish levels) And exactly where does the money go? To help clean the air/environment?? NO! The money most likely goes to a general fund where the likes of the State Legislators who continue to spend beyond their intake of revenue, try to pay off unfunded pensions and liabilities the State owes. This is nothing more then another tax in which the people of California are once again getting screwed. Like the gas tax which is suppose to go for the roads and infrastructure….It ends up going to fund over committed pensions while the roads (have you driven on CA. roads lately) are in dire need of repair with no real funding in sight. I am one of the biggest supporters for a clean planet, but I don’t believe in lying to people and taxing the poor to pay for what the rich create.
Aldyen Donnelly
First, I must say that I appreciate the fine effort you made to describe the overly complex California cap and trade market rules in easy-to-understand language. That is vert hard to do
Having said that, the article includes a number of important errors and omissions, one of which Jim Lamar highlights above.
Please note that,contrary to suggestions in the article, CalifoCalifornia’s carbon market rules unfairly discriminate against states and provinces with which California trades. That is why none of BC, WA, OR or other US states that trade with CA have elected to link CA’s carbon policies/markets, notwithstanding the significant resources they expended on the WCI process. And the only province/state that has linked to CA does not trade (much) with CA. There are reasons these statements are true, and they should be of great concern to those of us who care about the adoption of effective, efficient and sustainable carbon policy(ies).