Major corporations in the Pacific Northwest are failing their climate commitments. Last year, Sightline examined the climate commitments of 11 of the Fortune 500 corporations with headquarters or significant footprints in the Pacific Northwest. In the year since, more than half of these 11 corporations increased their Scope 1 + Scope 2 emissions. Their cumulative increase in Scope 1 + Scope 2 emissions surpassed 11 percent.
Moreover, last year we lauded Microsoft, Amazon, and Starbucks for their climate leadership. All three had set lofty goals to reach carbon neutrality (or better) by mid-century, and all were on track to source 100 percent renewable energy for their operations in this decade. Each of these corporations also had major investments underway to use energy more efficiently, whether it be retrofitting their buildings with high-efficiency systems, improving on the energy consumption of technology products, or implementing major energy efficiency gains in their supply chains. But in the subsequent annual emission reports, the most trackable and verifiable emissions rose for all three of these “climate leaders.”
Setting the Stage
Before we dive further into our most recent findings, a couple quick notes will set the stage for readers. Further information about methodology can be found in the “Sources and Methods” section at the end of this article.
In our analysis last year, we focused on corporate commitments related to reducing emissions, using renewable energy, and investing in energy efficiency. In this update, we’ve narrowed our focus solely to emission reductions, which includes the net impact of any achievements in renewable energy and energy efficiency.
Carbon analysts generally break down corporate emissions into three categories:
- Scope 1 includes direct emissions from sources like fuel and refrigerant use in company facilities and vehicles;
- Scope 2 includes indirect emissions from purchased energy, such as gas-fired power from an electric utility; and
- Scope 3 emissions are all other indirect emissions from activities like business travel, employee commuting, the use of products sold, transportation and distribution, and supply chain purchases. Our analysis will exclude Scope 3 emissions because we do not have uniform data from each corporation.
COVID-19 plays only a small role in these results. Except for Amazon, the emissions performance trends are for time periods that conclude before the onset of the global COVID-19 pandemic.
Changes in absolute emissions
Since our original analysis, the 11 Northwest corporations Sightline featured added more than four million tons (CO2e) of Scope 1 + 2 emissions, led by Amazon which was responsible for almost all (3.6 million tons) of that increase. More than half of the 11 Northwest corporations increased their absolute carbon emissions for Scope 1 + Scope 2 since their previous report, while five decreased their Scope 1 + Scope 2 emissions.
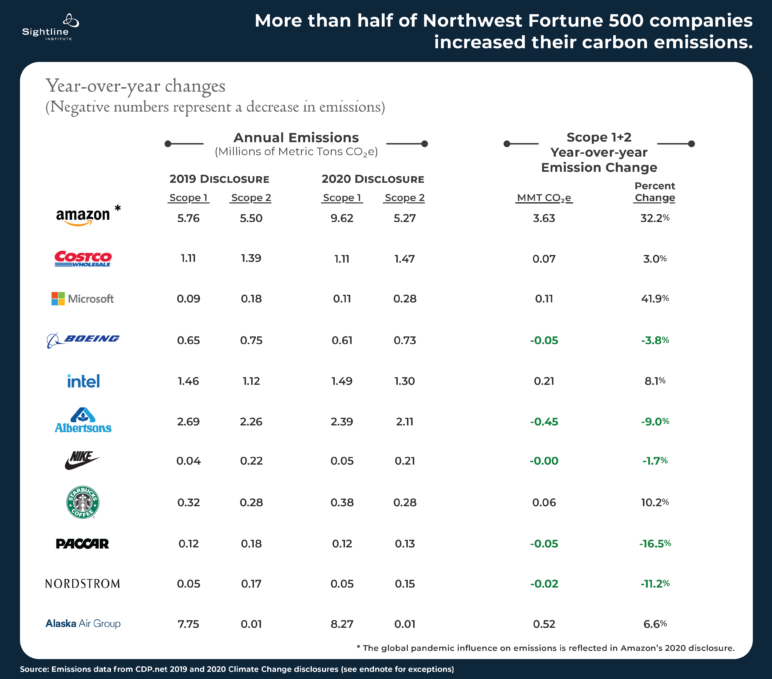
Disappointingly, the three climate leaders we lauded in 2020—Microsoft, Amazon and Starbucks—all increased their emissions by double-digit percentages. These three corporations are all striving to be carbon neutral or carbon negative by mid-century, but they have taken a giant step backward. Microsoft’s core emissions grew by a whopping 42 percent in the year before the pandemic. Although the Redmond, Washington-based company has made lofty pledges, it has a long way to go, and it’s moving quickly in the wrong direction. Worse yet, Amazon’s core-emission increase alone dwarfs the sum-total increases of its Northwest Fortune 500 peers, calling into question the sincerity of its climate pledge. Will Amazon continue its climate pollution as it grows and maintains its market dominance?
On the other hand, PACCAR and Albertsons had lackluster climate commitments a year ago, but both have made impressive dents in their emissions in a single year despite their revenue growth. Truck manufacturing company PACCAR and grocery retailer Albertsons both indicated that energy efficiency investments drove a reduction in emissions. Albertsons also addressed fugitive emissions from leaky refrigeration systems, while PACCAR indicated that shifting to cleaner fuels contributed to the reduction.
Changes in carbon intensity
Another way to look at the story, albeit not one that matters much for the atmosphere, is to look at emissions per dollar of revenue earned, a metric known as “carbon intensity.” Viewed through this lens, a more positive story emerges as Northwest corporations grew their businesses. The majority (seven of eleven) of the companies in our analysis reduced their carbon intensity, which is a positive outcome—these companies are eking out more dollars revenue per ton of carbon.
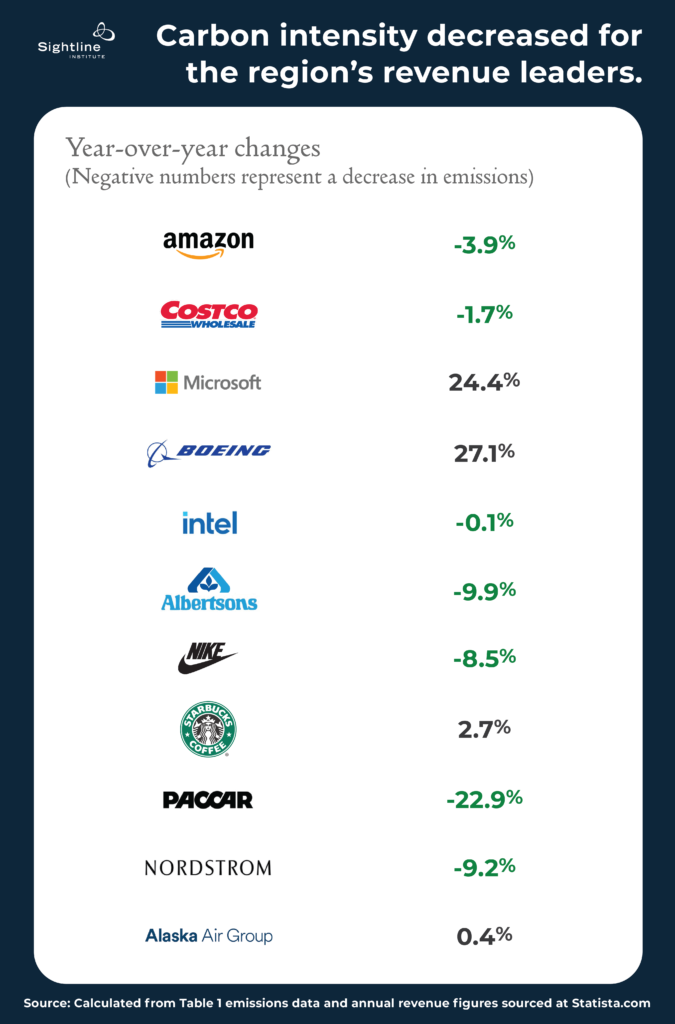
Nevertheless, two of the three climate leaders from last year, Microsoft and Starbucks, actually have a more carbon-intensive business than the year previous. Microsoft cites the opening of new data centers as the reason for its nearly 25 percent increase. Starbucks did not provide an explanation for the increase.
Both Boeing and Amazon saw giant revenue swings from their previous reporting year. Boeing experienced a major loss of revenue (24 percent decrease) due to the 737 MAX crashes and subsequent FAA grounding, but the corporation only had a small decrease in emissions by comparison. Meanwhile, Amazon saw a whopping 38 percent increase in revenues in 2020 as the global pandemic drove more consumers to online shopping and had a similarly large increase in emissions. Nordstrom, with a modest two percent decline in revenue, was only one of two companies that experienced a decrease in revenue although its carbon intensity decrease appears to have outpaced its revenue decrease.
While lessening the carbon intensity of industry is desirable, and several Northwest corporations deserve credit for doing so, the reductions mask what really matters: increases in absolute emissions.
Climate Commitment Updates
In the first half of 2020, several major corporations made splashy announcements committing their enterprises to climate goals. At publication of our article last year, Amazon, Nike, Starbucks, Microsoft, Intel, and Nordstrom had all made climate commitments through one or more of six major climate initiatives (RE100, Science Based Targets, Better Buildings, We Are Still In, The Climate Pledge, and United Nations Global Compact). Since then, both PACCAR and Albertsons have signed on to the Science Based Targets initiative, and Alaska Air Group has joined The Climate Pledge. Now nine of the 11 NW Fortune 500 have joined one or more of the major climate change initiatives, up from six in the previous year. Costco and Boeing remain the holdouts in this arena, although both have acknowledged some climate action goals. Costco has recently announced a new climate action plan that is grounded in well-accepted frameworks for goal setting, accounting standards, and financial reporting. Boeing continues to adhere to the UN’s CORSIA standards that aim to cut the carbon footprint of international aviation in half by 2050.
The major milestones for these commitments still remain several years out. Corporations have some time to make investments that lead to lower emissions. But the urgency to do so may be lacking as evidenced by the net increase in emissions by these corporations. Each of the 11 NW Fortune 500 have declared concern for the impacts from climate change and have acknowledged some role in contributing to the emissions driving climate change. Each has indicated some appreciation for the urgency needed to reduce emissions. But for Mother Nature, action will have more impact than words.
Sources and Methods
Sources: Emissions data is sourced from 2019 and 2020 CDP Climate Change disclosures except for Amazon data and 2019 Alaska Air Group data. Amazon and 2019 Alaska Air data were sourced from their respective websites because it was not publicly disclosed to CDP.
Timeframes: 2020’s Sightline article referenced 2019 CDP disclosures which reported calendar year (CY) or fiscal year (FY) 2018 performance. This article references 2020 CDP disclosures which report CY/FY 2019 performance. The Amazon data referenced in this article is for CY 2020, compared to CY 2019 which was used for the earlier article. Data comparisons between corporations are year-over-year but do not always compare the same time frames because some reporting was provided for calendar years, some for fiscal years.
Emission Scopes: We focused our analysis on Scope 1 + Scope 2 emissions for this report. Scope 3 emissions are the least precise category of the three emission types because, unlike Scope 1 and Scope 2 which are typically measured with instrumentation, Scope 3 is typically estimated. Scope 3 emissions were not included in our analysis because both CDP as well as some corporations changed estimation approaches for Scope 3 emissions between the 2019 and 2020 disclosure, hindering a like-to-like comparison. Further, several of the companies omitted some categories typically included in Scope 3 emissions for lack of quality data.
Calculation Methodology:
Year-over-year emissions change (CO2e) = (2020 Scope 1+2 emissions) – (2019 Scope 1+2 emissions)
Year-over-year emissions change (%) = (Year over year emissions (CO2e)) ÷ (2019 Scope 1+2 emissions)
Carbon Intensity (CI) = (Annual Scope 1+2 emissions) ÷ (Annual Revenue)
Carbon Intensity Change (%) = (2020 CI – 2019 CI) ÷ (2019 CI)
