With all the controversy about coal export facilities planned for the Northwest, it’s useful to examine some facts about markets in Asia, where the coal would ultimately be sold. While it’s likely that not everyone will agree about the meaning of these data, I do hope that everyone can agree about the facts.
Here’s a look at trends in the two major reference prices for Asian coal imports:
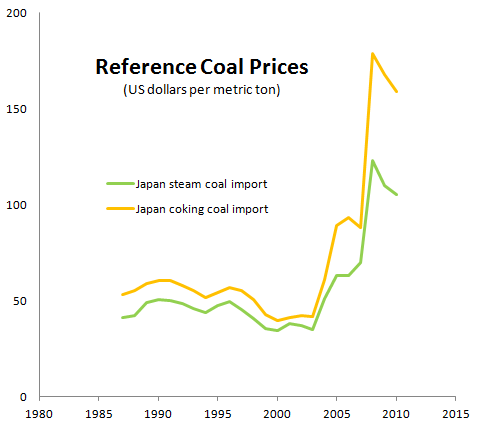
In recent years, coal prices have skyrocketed, particularly for “coking” coal. (“Coking” coal is used in steelmaking; “steam” coal is used for generating electricity.) Prices peaked at historic levels in 2008, roughly tripling in just 4 years. Although prices declined in 2009 and again in 2010 they remained at exceptionally high levels relative to the last few decades.
(Price data for 2011 is not yet available; I’ll report on it when it is.)
Coal imports into Asia tell a remarkable story:
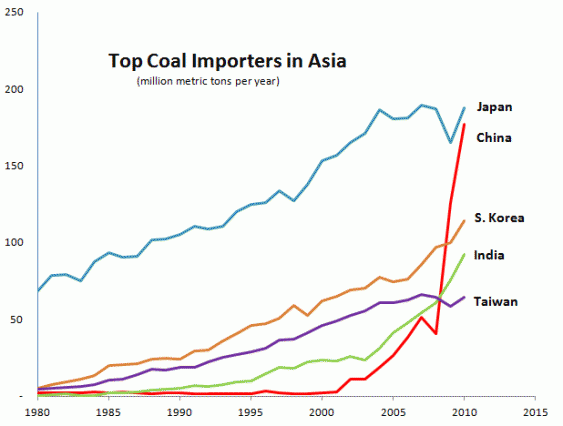
All the major Asian economies have exhibited consistent growth in coal imports. Yet China’s growth has been positively astonishing: imports more than quadrupled between 2006 and 2010. Data for 2011 is not yet available, but they will likely show China as Asia’s new leading coal importer.
It’s interesting to contrast import trends to coal consumption trends:
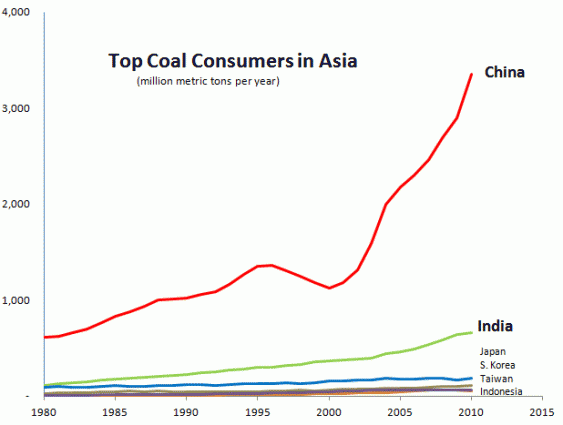
China’s growth in overall coal consumption, while still meteoric, is considerably more moderate than its recent spike in imports. China currently consumes roughly half the world’s total coal diet; it dwarfs all other Asian countries, including India. Coal consumption in Japan, Taiwan, and Indonesia is flat or slightly declining; it’s rising in both India and South Korea.
Now compare coal consumption trends to coal production trends:
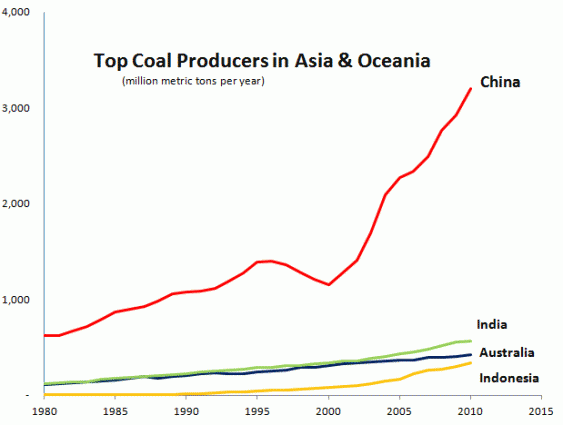
China’s trend lines for consumption and production look almost identical because China has met its coal demand with its considerable domestic reserves for almost its entire history. India is both a major producer and consumer of coal. Australia and Indonesia each produce and export far more coal than they consume at home.
Is China’s coal import growth an indication of a radical but fundamental shift in the global coal trade? Or do the trends in China indicate an unsustainable economy with severe risks of volatility?
I’ll aim to provide some additional context and analysis over the coming months. In the meantime, I encourage readers to share evidence and data so that the Northwest can make an informed decision about coal exports.
Thanks to Pam MacRae for research assistance.
Notes: Price data come from the BP Statistical Review of World Energy; all other data come from the the US Energy Information Administration’s “International Energy Statistics.”

One sight that was shocking to me on my trip to China a few years ago: in a small village, a donkey cart loaded with bricks of coal, the owner selling them door to door.
Of course that’s nothing compared to the massive coal-fired power plants that make their major cities look like this.