Takeaways
- Every Washington city suffers a voter turnout penalty because state law requires odd-year local elections. Conservatively estimated, the average penalty was 36 percent in 2021, the last time Washington held city and town elections. This penalty amounted to more than 578,000 missing votes statewide.
- Conversely, every Washington legislative district enjoys a voter turnout bonus because of its even-year elections. These bonuses averaged 62 percent in 2022, or 1.2 million ballots.
- The penalties and bonuses are not associated with partisan affiliation, city size, or other obvious demographic traits. They yield more representative electorates for state than for city elections.
- Reforming state law would allow cities to choose to consolidate their elections with state elections and reap the benefits of much greater participation. It might also bolster the legitimacy of city leadership.
Find audio versions of Sightline articles on any of your favorite podcast platforms, including Spotify, Google, and Apple.
In every city in Washington, a 60-year-old state law suppresses voter turnout. It prevents municipal governments from doing the one thing that would reliably boost citizens’ participation in elections—a single change that would increase voter turnout by, conservatively estimated, 62 percent.
The one thing in question would be to let cities and towns move their elections to the same date and the same ballots as state and federal elections. Doing so would allow localities to ride the turnout coattails of presidential and Congressional elections.
Consolidating local with federal elections, a growing trend in US cities, is immensely popular with voters of every political stripe, enhances the representativeness of the local electorate, holds local leaders more accountable to local values and policy preferences, and can save millions of dollars of public funds.
But the principal benefit of election consolidation is none of these things. The principal benefit is that it increases voter participation, giving many more residents a say in how their lives are governed. Election consolidation does so dramatically, and it does so ubiquitously. To quantify these effects, Sightline developed a new method for estimating the turnout penalty for cities’ off-cycle elections and the turnout bonus for legislative races’ on-cycle schedule.
Every city suffered an off-cycle turnout penalty
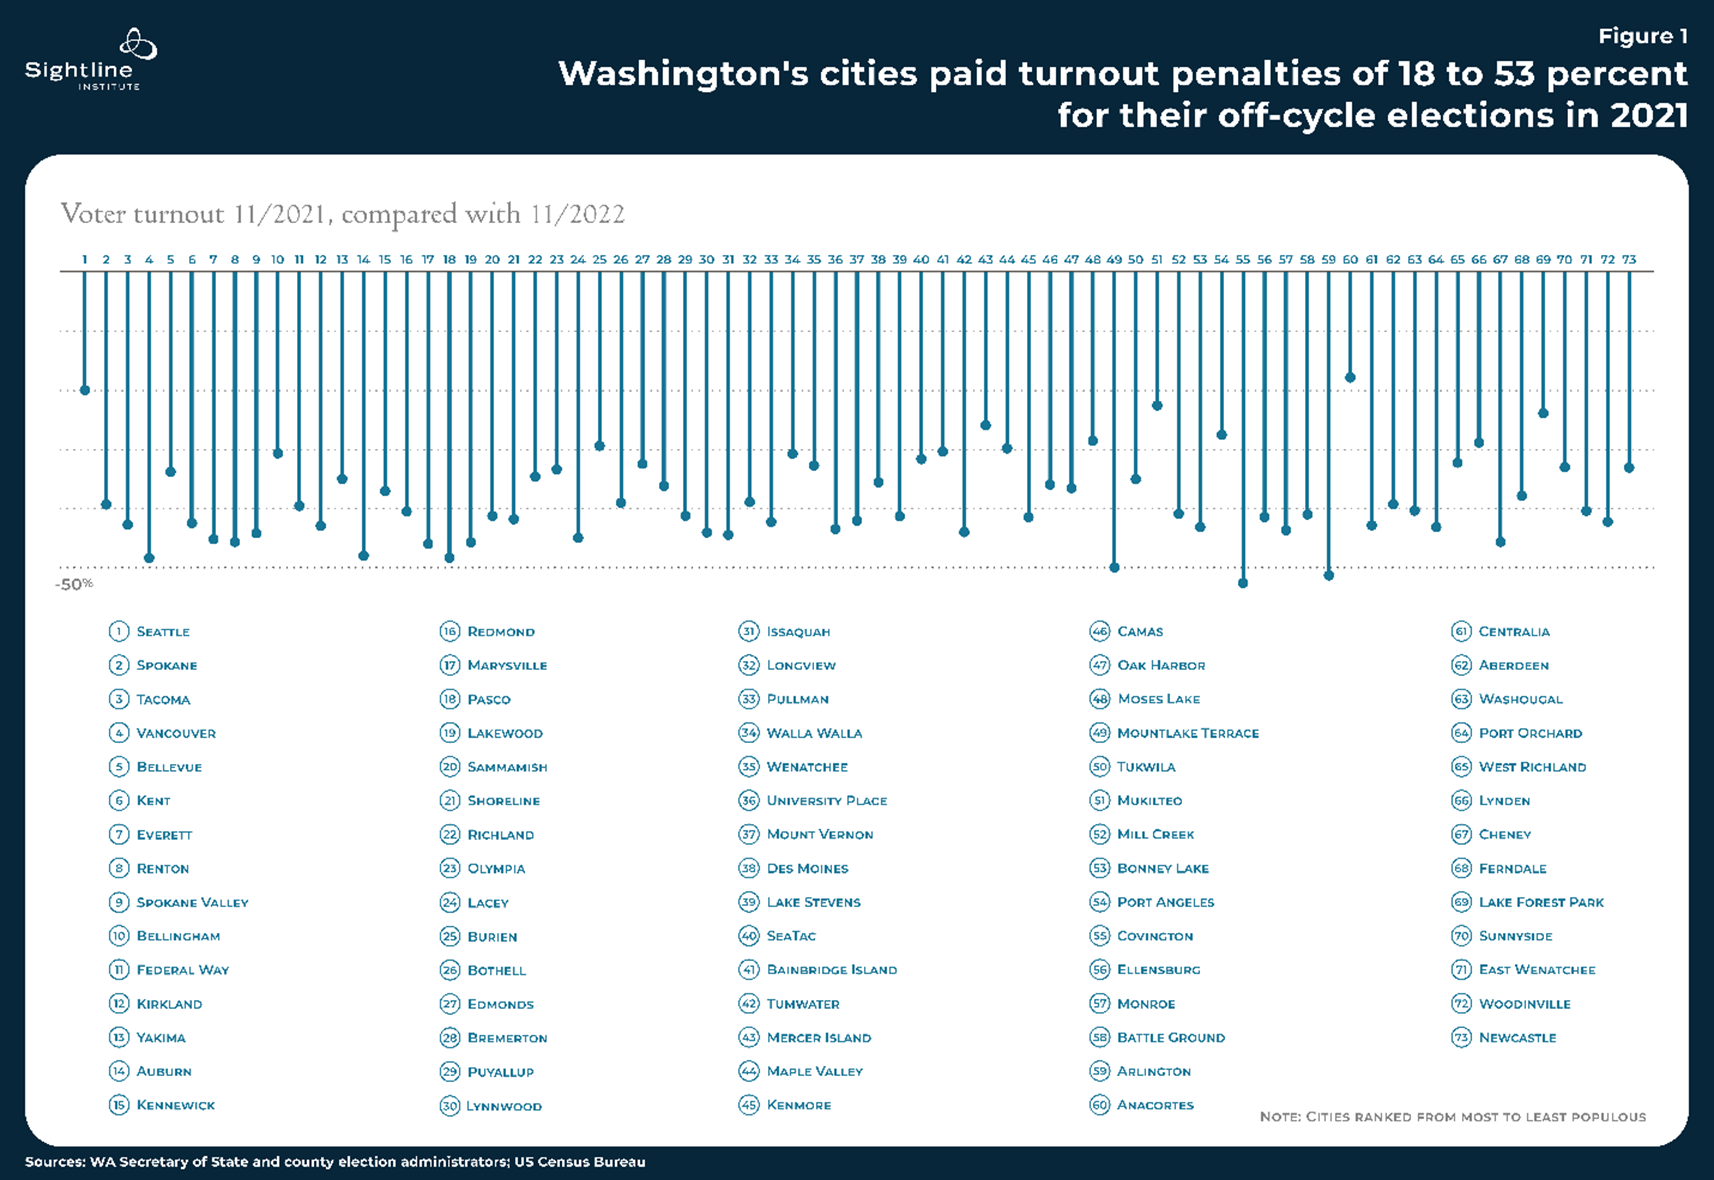
Specifically, Sightline calculated the turnout penalty of off-cycle elections in all of Washington’s cities and towns with populations of 10,000 or greater and found a turnout penalty in every single one for which data are available. The “turnout penalty” is the difference in turnout in a city between the 2021 general election and the 2022 general election.
For example, the city of Seattle had 267,414 ballots cast in its November 2021 municipal election, when the mayor, city attorney, and two at-large city council members were elected. The following year, in the November 2022 general election, when Congressional and state legislative seats were decided, the city’s voters turned in 333,912 ballots. The off-cycle city races had about 66,500 fewer ballots, which is 20 percent lower than the on-cycle turnout. The turnout penalty of holding its municipal election off cycle was therefore 20 percent.
Seattle’s penalty was relatively small. Spokane had a turnout penalty of 39 percent, and Tacoma’s was 43 percent. Lumping together all mid-sized and large municipalities, defined as those with 10,000 or more residents of voting age, the turnout penalty in the 2021 off-cycle election was 37 percent of all voters—more than 578,000 ballots not cast that year. That turnout differential is many multiples the size that get-out-the-vote drives ever achieve; indeed, no other election reform promises comparable gains in participation.
All cities took an off-cycle hit, no matter size, urban or rural location, demographics
As remarkable as the size of the penalty was its universality. As shown in Figure 1, not a single mid-sized or large municipality came close to matching its 2022 turnout in 2021.1
The size of the turnout penalty showed no pattern among cities. It doesn’t scale with city size, for example: the cities in Figure 1 are in descending rank by population yet show no correlation. Sightline tested for correlation with race or ethnicity and again found nothing.
A small overstatement: Not accounting for down-ballot drop-off
The turnout penalties in Figure 1 overstate in a small way and understate in a large way the potential increase in turnout that would come from election consolidation. They overstate because they are based on total ballots cast, not votes cast for local offices. Some of the voters who cast ballots in on-cycle federal and state elections leave blank the local races at the bottom of the ballot. Typically, this “down-ballot drop-off” is modest: 10 percent or less, according to Zoltan Hajnal of University of California, San Diego, the leading scholar of election timing in the United States.
Meanwhile, Sightline analyses based on specific, contested local races, rather than total ballots cast, have demonstrated that Oregon’s on-cycle city and county elections nearly double the turnout of neighboring Washington’s off-cycle city and county elections. Just so, in a forthcoming analysis, Sightline shows that Wyoming’s on-cycle city elections roughly double the turnout of neighboring Idaho’s off-cycle city elections.
A large understatement: Not comparing with presidential year turnout
At the same time, the turnout penalties in Figure 1 dramatically understate turnout potential from election consolidation, because they are based on midterm elections rather than presidential ones. This effect swamps the effect of down-ballot drop-off.
Calculated with respect to the 2020 presidential election, rather than the 2022 midterm, 2021’s off-cycle turnout penalty in large and mid-sized cities would have been not 36 percent but likely more than 50 percent. That is, down-ballot drop-off diminishes voter participation in city elections during on-cycle years by 10 percent or less, but off-cycle elections cost Washington cities 36 percent to more than 50 percent of their potential 2021 electorate.2 fairly consistent among voters of different demographic characteristics, such as race, ethnicity, and ideology, so it is likely to be a neutral factor on election outcomes.
More than half a million WA voices weren’t counted in 2022 vs. 2021
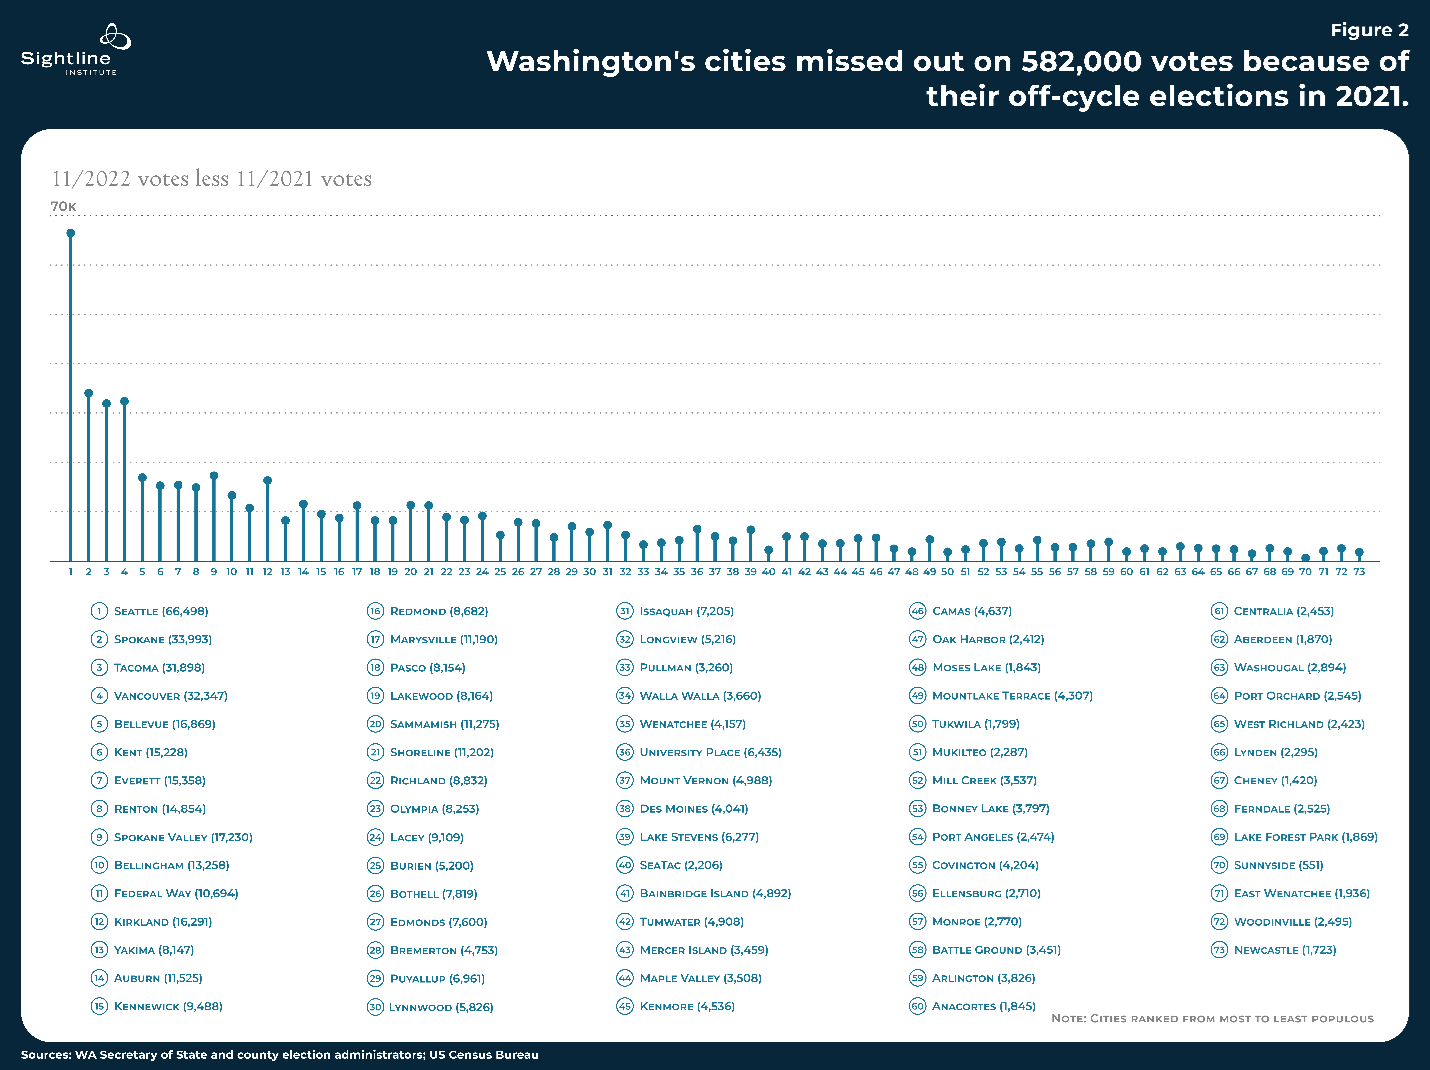
Expressed not as percentages but as numbers of missing votes, the turnout penalties show their scale. City elections in Seattle alone, for example, missed out on reflecting the preferences of almost 66,500 voters—people who voted in November 2022 but not in November 2021. Because of Seattle’s large population, this number is larger than the missed votes of the next two cities, Spokane and Tacoma, combined. This is true even though Seattle’s turnout penalty expressed as a percentage was 20 percent and those cities had turnout penalties around 40 percent.
Figure 2 shows the number of missing votes in November 2021, compared with November 2022, in all of Washington’s large and mid-sized municipalities. Again, every single city missed votes in 2021, compared with its 2022 turnout, ranging from Seattle’s almost 66,500 to the roughly 500 voters who didn’t participate in Sunnyside, in Yakima County. Altogether, Washington’s large and mid-sized cities suffered the absence of 578,344 voters in 2021’s municipal elections who participated in the 2022 midterm election.
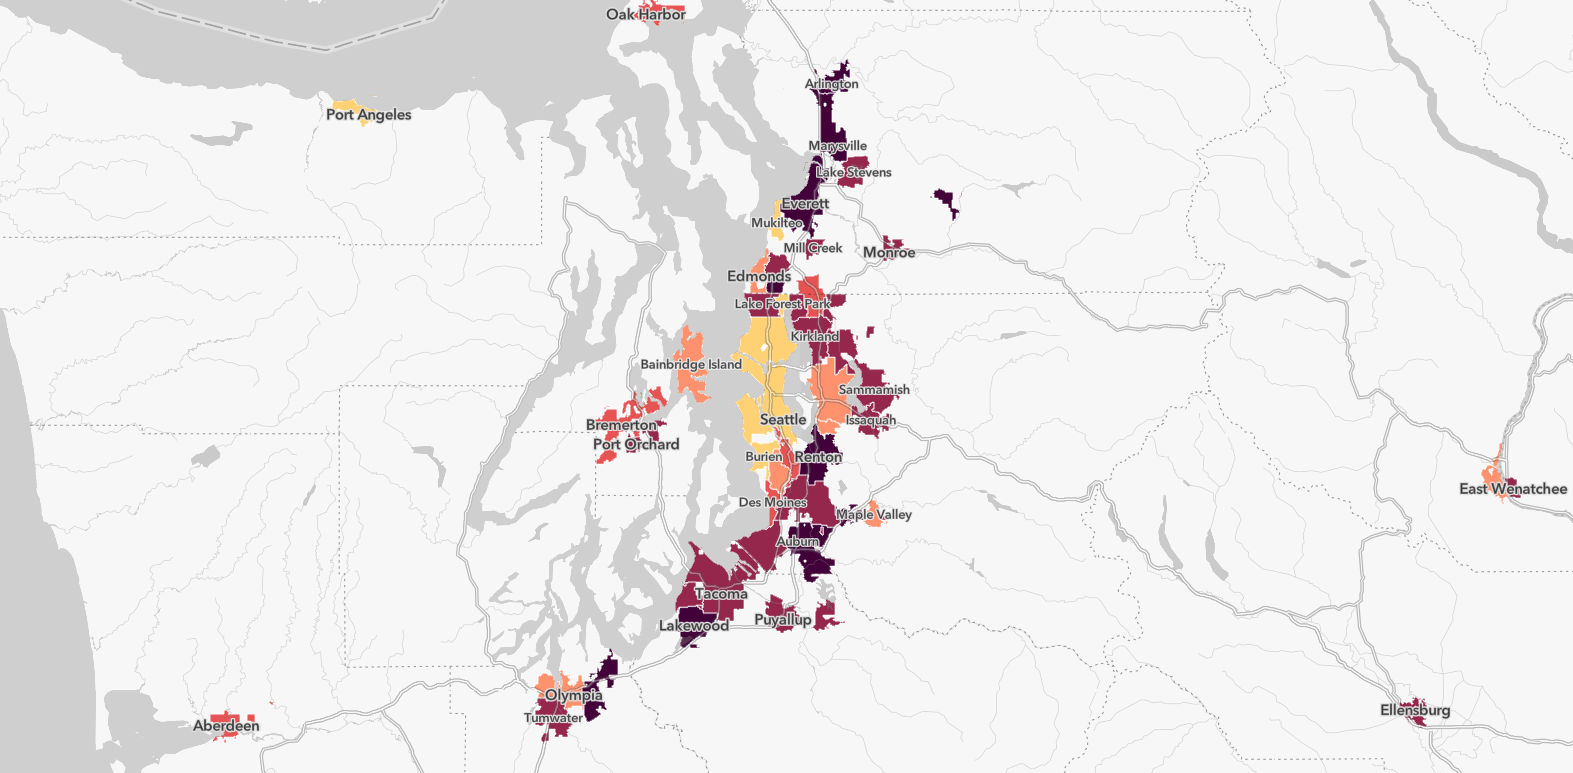
Map 1 below reinforces the points: every city suffered a turnout penalty from off-cycle voting, and the size of the penalty varied across the state without regard to size or location. (You can click on cities to see their turnout penalty and details.)
Map 1
Source: Map by Sightline Institute; GIS analysis by Ben Anderstone, Progressive Strategies NW; data from US Census Bureau, WA Sec. of State, county election administrators. View a full, interactive version of map.
Every legislative district enjoyed an on-cycle turnout bonus
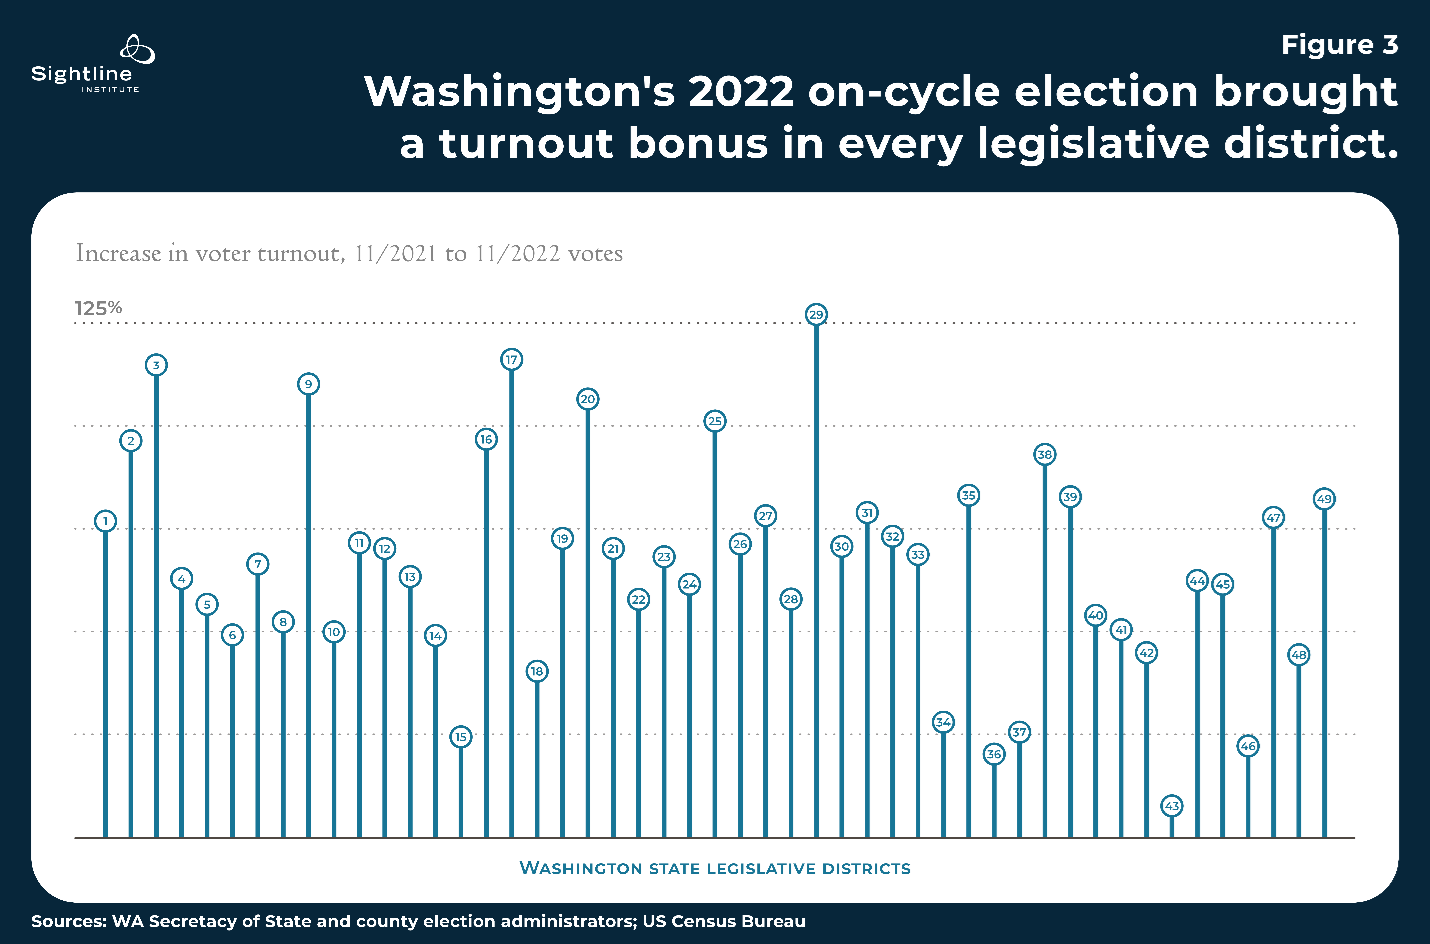
On the flip side of all that loss is a whole lot of gain when jurisdictions can piggyback on the turnout of an on-cycle, or even-year, election—the “turnout bonus.” Sightline calculated this figure for each of the state’s 49 legislative districts, as shown in Figure 3.
The turnout bonus is the increase in ballots cast in the 2022 on-cycle general election (which included Congressional, state, and most county races331st legislative district, which includes Bonney Lake and environs, cast 37,156 ballots in 2021’s off-cycle election and 66,482 ballots in the 2022 on-cycle election. That’s a 79 percent increase, or an on-cycle turnout bonus of 79 percent.
Legislative districts (LDs) cover all voters in the state, including those in rural, unincorporated areas, rather than just those who reside in areas incorporated into a municipality, and the results are just as striking as for cities. The average LD turnout boost from on-cycle elections was massive: 62 percent statewide. The turnout boost reflects 1.2 million additional ballots cast, with turnout rising from 1.9 million in November 2021 to 3.1 million in November 2022.
A repeated understatement: Not comparing with presidential year turnout
As for cities, so for LDs: even this 62 percent statewide increase is an understatement of the true turnout bonus that comes from on-cycle elections, because it compares an off-cycle year with a midterm rather than a presidential year.
Washington recorded 4.1 million ballots in the presidential election of November 2020; in 2022’s midterm, the figure fell to 3.1 million. Comparing 2021’s 1.9 million ballots cast with the average of 2020 and 2022 turnout shows a statewide turnout bonus of 92 percent from on-cycle elections—almost half again as high as the 2022 statewide figure of 62 percent.
All LDs saw a turnout boost, no matter size, urban or rural location, competitive local races, or demographics
LD turnout boosts were ubiquitous, just like city turnout penalties. Voter turnout increased from 2021 to 2022 in every single legislative district. That is, in none of the 49 legislative districts in the state did voter turnout decrease from 2021 to 2022. Turnout rose even in places, such as the city of Seattle, that had hotly contested mayoral elections in 2021 and few contested races in 2022.
The largest turnout boost was 127 percent in the 29th legislative district, a compact area stretching from the south end of Tacoma to Spanaway. There, municipal, school board, and other elections in 2021 only drew ballots from 17,134 people who lived in the precincts of the 29th LD. In 2022, those same precincts cast 38,908 ballots.
The smallest turnout boost was 8 percent, in the 43rd LD in central Seattle. In fact, five of the six smallest turnout boosts were in Seattle legislative districts. The explanation for this pattern might be that November 2021’s ballot included contested races for Seattle mayor and at-large city council seats, while 2022’s ballot in Seattle was a sleepy affair with few competitive races in state or national elections.
As for cities, so too for LDs: the turnout bonuses were not correlated in any important way with anything else Sightline could identify. They did not correlate with the district’s partisanship, population density, or race and ethnicity. And they showed no particular geographic pattern, as illustrated in Map 2.
Map 2
Source: Map by Sightline Institute; GIS analysis by Ben Anderstone, Progressive Strategies, NW; data from US Bureau of Census; WA Sec of State; county election administrators. View a full, interactive version of the map.
Just so, the number of additional ballots cast in 2022, compared with 2021, was large and positive in every legislative district. Map 3 shows the scale of these extra ballots in the size of the square for each legislative district. The extra ballots were unrelated to the political party of each district’s legislative delegation, shown by the squares’ colors.
Map 3
Source: Map by Sightline Institute; GIS analysis by Ben Anderstone, Progressive Strategies, NW; data from US Bureau of Census; WA Sec of State; county election administrators. View a full, interactive version of map.
Bigger turnout, bigger support for winners?
The upshot of the data seems to be that on-cycle elections would dramatically boost participation in democracy, without obviously favoring any particular constituency, party, region, or type of community—at least, none that Sightline has been able to measure. This stronger participation might enhance city leaders’ legitimacy and give them stronger mandates to lead.
Looking at cases suggests the same conclusion: legislative leaders have vastly more supporters than do the mayors and councilors in their districts, and that’s true without regard to party or place.
Laurie Jinkins, the Speaker of the House and a Democrat, represents the 27th district in central Tacoma, where the turnout bonus was 78 percent. That means that she and her Democratic colleagues Senator Yasmin Trudeau and Representative Jake Fey all faced 2022 electorates 78 percent larger than did their counterparts running for Tacoma mayor or district city council seats in the same precincts in 2021—a more challenging prospect, no doubt, but also a more representative share of the public and, therefore, a much stronger mandate to govern. Nearby, in and around Bonney Lake in the 31st district, Republican House Minority Leader Drew Stokesbary had the benefit of an electorate 79 percent larger than the one that chose the mayor and council of Enumclaw. Thus, the leaders of the respective parties in the Washington State House of Representatives come from districts with nearly matching on-cycle turnout bonuses.
On the senate side of the state capitol, the coincidence repeats. Senate majority leader and Democrat Andy Billig represents the 3rd district in Spokane, which saw a more than doubling of turnout from 2021 to 2022—an on-cycle bonus of 115 percent. Senate minority leader John Braun comes from the 20th district, the environs of Centralia and Chehalis, which returned 107 percent more ballots in 2022 than the previous year.
All of these leaders, therefore, face electorates that are very roughly twice as large as the electorates that choose the city leaders from their districts, and that turnout boost only grows when you factor on-cycle presidential elections into the equation.
Other examples abound.
Democratic State Senator Patty Kuderer, for example, represents part of the area between Lake Washington and Lake Sammamish. In 2022, when she won reelection, turnout in her 48th LD was 48,500 voters. The previous year, in 2021, when half of the city council seats were on the ballot in Bellevue, Kirkland, and Redmond, the principal cities that overlap with her district, only 33,600 voters cast ballots. In other words, she faced an electorate 44 percent larger than did the city leaders in her district.
Shelly Short is a Republican senator in the 7th district, which stretches from the Methow Valley across the northern tier of the state to Idaho. She is such a friend to Washington cities’ legislative agenda that their association gave her an award in 2021. One way to help them more would be to help give East Wenatchee and other cities in her district the freedom to increase their voter turnout by the on-cycle bonus, which was 66 percent in her district when she was reelected in 2022.
Senator Claire Wilson and her Democratic colleagues in the 30th district faced 71 percent more voters than did their municipal counterparts running for office in her LD’s cities of Federal Way, Auburn, and Des Moines.
Next door, in the 33rd district, Senator Karen Keiser and Representatives Mia Gregerson and Tina Orwall, all Democrats, won reelection in 2022 in a year with 69 percent more voters than turned out to vote the previous year in the overlapping city council districts of SeaTac, Burien, Des Moines, and Kent. Representative Gregerson, at least, has been trying to do something about it: she’s sponsored a bill to consolidate local elections with federal ones in Washington in each of the past four years.
Giving cities the option to consolidate elections—and voters greater likelihood of voting
Decades of familiarity have inured many people to the size and universality of turnout penalties and bonuses. The scale of these penalties and bonuses dwarfs almost all other factors that influence turnout. And the source of the penalties and bonuses is state law. In Washington, state law sets the date for municipal elections as November of odd-numbered years.
This 1963 policy yields an imbalanced pattern of voting. State legislators run in years with large electorates. These larger electorates, according to academic research, tend to be a better match for the overall public than are small electorates: especially by age but also by race, ethnicity, and ideology. High-turnout on-cycle elections, other research shows, dilute special interest influence and improve accountability by ensuring that elected officials align with the values and beliefs of the majority of their constituents. City officials, meanwhile, run in low-turnout elections, facing less representative electorates dominated by older, whiter voters, including many homeowners.4 Like Arizona, California, and Nevada, though, Washington can release cities to move elections at their own discretion. Giving them that option would let cities shed the penalties of off-cycle elections and seize the turnout bonuses from moving local races onto the federal election ballot.
Thank you to Ben Anderstone for data and GIS analysis, Jay Lee for statistical analysis, Todd Newman for research support, Zoltan Hajnal for review comments, Kate Macfarlane and Webster Chang for mapping and layout, and Devin Porter of Good Measures for graphic design.
Appendix: Methods and data
Sightline commissioned Seattle-based election analyst Ben Anderstone of Progressive Strategies NW to assemble complete voter turnout data for every precinct in the state for the 2021 and 2022 November general elections. He used Census Bureau voting-age population estimates and demographic estimates by ethnicity and race. He used voting records from the Washington Secretary of State and county election administrators. Ben aggregated the precincts to match the state’s 49 new, post-2020 legislative districts (LDs). He then calculated total ballots cast per voting-age resident of the district. By doing this, he provided a way to look at how the same voters responded to opportunities to vote for local and state/national candidates in every part of the state of Washington during a two-year period.
Sightline also recorded the party identification of the delegations in all 49 legislative districts. Washington has uniform party membership among the delegations of almost all of its districts in 2023, but in the few rare exceptions, we identified the district’s partisanship based on the majority of the three legislators in each district, one senator and two representatives. Two of either party labeled the district as with that party.
Sightline considered whether every precinct had elections in November of 2021 and 2022, and concluded that all did. Washington conducts statewide general elections in November of each year and, in November 2021, conducted statewide advisory votes. Thus, every active registered voter in the state would have received a ballot in that election, as in the November 2022 general election. In addition, every precinct in the state is part of a school district, even if it is in neither a municipality nor any other off-cycle local voting district: port, irrigation, public utility, surface water management, etc. Further, in 2021, three Washington counties conducted November 2021 general elections: King, Snohomish, and Whatcom. All other counties have on-cycle elections, and King County adopted an election consolidation charter amendment in 2022 that will phase out off-cycle elections over the years ahead.
For the same two November elections, Ben Anderstone also aggregated precincts for all of Washington’s incorporated municipalities (cities and towns), though data were not readily available for some of the smallest towns. Finally, he aggregated data for each city council district in Washington cities that have such districts.
To calculate turnout, we used not ballots cast as a share of registered voters but ballots cast as a share of voting-age population. This method helps to correct for the wide range of voter registration rates and their variation from year to year. One weakness with the method is that voting-age residents of a jurisdiction may not all be eligible to vote, because of citizenship status or felony convictions, for example. It also fails to reflect changes in population from 2021 to 2022. Still, Sightline used voting-age population as a more-consistent denominator for turnout than voter registrations.
Sightline’s methods for calculating turnout penalties and bonuses look only at the increase, rather than the levels, of turnout, because it seeks to understand how turnout might change overall were local elections consolidated with federal elections. As indicated in the data tables accompanying this article, turnout varies widely among jurisdictions. Among legislative districts, in 2022, it ranged from 23 percent of voting-age population in the 15th LD near Yakima and Pasco to 63 percent in the 24th LD on the Olympic Peninsula. Among cities in 2021, it ranged from 11 percent in Sunnyside, near Yakima, to 59 percent in Anacortes, in Skagit County.
To examine relationships between turnout penalties and bonuses, populations, population density, and race/ethnicity, Sightline Senior Research Associate Jay Lee conducted statistical tests of correlation using the software tool R. He also checked correlations with partisanship of the district, using as an indicator of partisanship the 2022 percent vote share of US Senator Patty Murray, a Democrat.
One way to improve this method would be to add more off-cycle and on-cycle elections. Turnout varies considerably over time, depending on voters’ perceptions of the stakes in each election. So comparing only one on-cycle with one off-cycle election yields results more indicative than predictive. Counteracting this flaw is the conservatism Sightline employed by comparing off-cycle turnout with a midterm year, when turnout is much lower than in a presidential year.
Turnout bonuses by legislative district
| Washington Legislative District (LD) | Location of district, principal cities | Senator, Rep 1, Rep 2 (2023) | 2023 Party of majority of district delegation | LD Voting-age population (2020) | Nov. 2021 general election ballots cast | Nov. 2022 general election ballots cast | 2021 turnout (ballots cast/voting-age population) | 2022 turnout (ballots cast/voting-age population) | 2022 on-cycle turnout bonus (2022 turnout, as percent increase over 2021 turnout) |
|---|---|---|---|---|---|---|---|---|---|
| 1 | Bothell, Lake Forest Park, Kenmore | Stanford, Duerr, Kloba | D | 122,252 | 39,369 | 69,622 | 32% | 57% | 77% |
| 2 | Yelm, Pierce county | McCune, Barkis, Wilcox | R | 117,684 | 29,446 | 57,832 | 25% | 49% | 96% |
| 3 | Spokane | Billig, Riccelli, Ormsby | D | 125,230 | 28,797 | 61,858 | 23% | 49% | 115% |
| 4 | Spokane Valley | Padden, Schmidt, Christian | R | 121,889 | 40,953 | 66,714 | 34% | 55% | 63% |
| 5 | Issaquah, Sammamish | Mullet, Ramos, Callan | D | 116,388 | 46,176 | 72,315 | 40% | 62% | 57% |
| 6 | Spokane | Holy, Volz, Graham | R | 122,031 | 40,946 | 61,085 | 34% | 50% | 49% |
| 7 | northeast corner of state | Short, Maycumber, Kretz | R | 122,702 | 41,796 | 69,548 | 34% | 57% | 66% |
| 8 | Tri-cities | Boehnke, Barnard, Connors | R | 114,878 | 39,093 | 59,556 | 34% | 52% | 52% |
| 9 | Pullman, southeast state | Schoesler, Dye, Schmick | R | 128,003 | 31,902 | 67,049 | 25% | 52% | 110% |
| 10 | Mount Vernon area | Muzzall, Shavers, Paul | D | 126,071 | 50,591 | 75,850 | 40% | 60% | 50% |
| 11 | Renton, Tukwila, Kent | Hasegawa, Hackney, Bergquist | D | 123,867 | 28,079 | 48,172 | 23% | 39% | 72% |
| 12 | Monroe to Wenatchee | Hawkins, Goehner, Steele | R | 123,024 | 40,883 | 69,572 | 33% | 57% | 70% |
| 13 | Ellensburg, Moses Lake, central state | Warnick, Dent, Ybarra | R | 117,963 | 33,970 | 55,495 | 29% | 47% | 63% |
| 14 | Yakima, south central state | King, Corry, Mosbruckner | R | 116,363 | 32,334 | 48,194 | 28% | 41% | 49% |
| 15 | Pasco to Yakima | Torres, Chandler, Sandlin | R | 105,378 | 19,063 | 23,712 | 18% | 23% | 24% |
| 16 | Kennewick to Walla Walla | Dozier, Klicker, Rude | R | 119,296 | 28,452 | 55,983 | 24% | 47% | 97% |
| 17 | Vancouver to Camas | Wilson, Waters, Harris | R | 120,318 | 32,866 | 71,043 | 27% | 59% | 116% |
| 18 | Unincorporated Clark County | Rivers, McClintock, Cheney | R | 119,539 | 47,282 | 66,361 | 40% | 56% | 40% |
| 19 | Aberdeen and environs | Wilson, Waters, McEntire | R | 125,140 | 37,921 | 65,466 | 30% | 52% | 73% |
| 20 | Centralia, Chehalis | Braun, Abbarno, Orcutt | R | 119,696 | 35,306 | 72,912 | 29% | 61% | 107% |
| 21 | Edmonds, Everett, Lynnwood | Liias, Peterson, Ortiz-Self | D | 124,223 | 34,234 | 58,262 | 28% | 47% | 70% |
| 22 | Olympia | Hunt, Doglio, Bateman | D | 124,667 | 43,844 | 69,198 | 35% | 56% | 58% |
| 23 | Bainbridge, Bremerton | Hansen, Simmons, Nance | D | 125,082 | 43,012 | 72,341 | 34% | 58% | 68% |
| 24 | Aberdeen, Port Angeles, Port Townsend | Van De Wege, Chapman, Tharinger | D | 131,609 | 51,151 | 82,599 | 39% | 63% | 61% |
| 25 | Puyallup | Gildon, Chambers, Jacobsen | R | 119,285 | 28,502 | 57,334 | 24% | 48% | 101% |
| 26 | Bremerton, Gig Harbor | Randall, Hutchins, Caldier | R | 125,364 | 44,478 | 76,172 | 35% | 61% | 71% |
| 27 | Tacoma | Trudeau, Jinkins, Fey | D | 127,327 | 33,307 | 59,340 | 26% | 47% | 78% |
| 28 | Lakewood, University Place, Tacoma | Nobles, Leavitt, Bronoske | D | 120,747 | 29,871 | 47,164 | 25% | 39% | 58% |
| 29 | Tacoma, Lakewood | Conway, Moran, Mena | D | 118,573 | 17,134 | 38,908 | 14% | 33% | 127% |
| 30 | Federal Way, Des Moines | Wilson, Taylor, Reeves | D | 120,031 | 25,168 | 42,963 | 21% | 36% | 71% |
| 31 | Bonney Lake, Enumclaw | Fortunato, Stokesbary, Robertson | R | 118,818 | 37,156 | 66,482 | 31% | 56% | 79% |
| 32 | Mountlake Terrace, Shoreline | Salomon, Ryu, Davis | D | 127,128 | 38,167 | 66,090 | 30% | 52% | 73% |
| 33 | Burien, Seatac | Keiser, Orwall, Gregerson | D | 122,933 | 26,821 | 45,255 | 22% | 37% | 69% |
| 34 | West Seattle, Vashon | Nguyen, Alvarado, Fitzgibbon | D | 127,978 | 55,490 | 71,005 | 43% | 55% | 28% |
| 35 | Lacey, Shelton | MacEwen, Griffey, Couture | R | 126,753 | 41,436 | 75,878 | 33% | 60% | 83% |
| 36 | Seattle (Ballard, Queen Anne) | Frame, Reed, Berry | D | 133,538 | 67,184 | 80,747 | 50% | 60% | 20% |
| 37 | southeast Seattle | Saldaña, Santos, Street | D | 129,010 | 48,655 | 61,077 | 38% | 47% | 26% |
| 38 | Everett | Robinson, Cortes, Fosse | D | 122,634 | 27,206 | 52,525 | 22% | 43% | 93% |
| 39 | Granite Falls, Lake Stevens, Granite Falls | Wagoner, Low, Eslick | R | 119,257 | 36,185 | 66,137 | 30% | 55% | 83% |
| 40 | Anacortes, Bellingham, Mt. Vernon | Lovelett, Lekanoff, Ramel | D | 128,373 | 50,583 | 77,868 | 39% | 61% | 54% |
| 41 | Bellevue, Mercer Island | Wellman, Senn, Thai | D | 119,168 | 43,765 | 65,840 | 37% | 55% | 50% |
| 42 | Blaine, Bellingham | Shewmake, Rule, Timmons | D | 123,433 | 52,438 | 75,961 | 42% | 62% | 45% |
| 43 | Central Seattle | Pedersen, Macri, Chopp | D | 145,451 | 59,590 | 64,123 | 41% | 44% | 8% |
| 44 | Mill Creek, Everett | Lovick, Donaghy, Berg | D | 117,387 | 39,492 | 64,142 | 34% | 55% | 62% |
| 45 | Kirkland, Redmond | Dhingra, Goodman, Springer | D | 118,356 | 41,726 | 67,381 | 35% | 57% | 61% |
| 46 | northeast Seattle | Valdez, Pollet, Farivar | D | 131,442 | 59,278 | 72,421 | 45% | 55% | 22% |
| 47 | Kent | Kauffman, Entenman, Stearns | D | 119,577 | 28,595 | 50,825 | 24% | 43% | 78% |
| 48 | Bellevue, Redmond | Kuderer, Slatter, Walen | D | 125,223 | 33,610 | 48,517 | 27% | 39% | 44% |
| 49 | Vancouver | Cleveland, Wylie, Stonier | D | 123,340 | 28,970 | 52,792 | 23% | 43% | 82% |
| Total | 6,024,419 | 1,892,273 | 3,067,686 | 31.4% | 51% | 62% |
Turnout penalties by city
| City | Voting-age Population (2020) | Nov. 2021 general election ballots cast | Nov. 2022 general election ballots cast | 2021 turnout (ballots cast/voting age- population) | 2022 turnout (ballots cast/voting-age population) | 2021 off-cycle turnout penalty (2021 turnout, compared with 2022) | 2021 Missing Votes (2022 ballots cast less 2021 ballots cast |
|---|---|---|---|---|---|---|---|
| Seattle | 630,174 | 267,414 | 333,912 | 42% | 53% | -19.9% | 66,498 |
| Spokane | 180,961 | 52,475 | 86,468 | 29% | 48% | -39.3% | 33,993 |
| Tacoma | 175,227 | 42,768 | 74,666 | 24% | 43% | -42.7% | 31,898 |
| Vancouver | 150,427 | 34,569 | 66,916 | 23% | 44% | -48.3% | 32,347 |
| Bellevue | 120,263 | 33,124 | 49,993 | 28% | 42% | -33.7% | 16,869 |
| Kent | 104,299 | 20,652 | 35,880 | 20% | 34% | -42.4% | 15,228 |
| Everett | 87,826 | 18,636 | 33,994 | 21% | 39% | -45.2% | 15,358 |
| Renton | 84,351 | 17,697 | 32,551 | 21% | 39% | -45.6% | 14,854 |
| Spokane Valley | 80,043 | 21,791 | 39,021 | 27% | 49% | -44.2% | 17,230 |
| Bellingham | 77,879 | 30,018 | 43,276 | 39% | 56% | -30.6% | 13,258 |
| Federal Way | 77,734 | 16,353 | 27,047 | 21% | 35% | -39.5% | 10,694 |
| Kirkland | 73,177 | 21,684 | 37,975 | 30% | 52% | -42.9% | 16,291 |
| Yakima | 70,824 | 15,160 | 23,307 | 21% | 33% | -35.0% | 8,147 |
| Auburn | 65,153 | 12,503 | 24,028 | 19% | 37% | -48.0% | 11,525 |
| Kennewick | 61,193 | 16,154 | 25,642 | 26% | 42% | -37.0% | 9,488 |
| Redmond | 55,799 | 12,748 | 21,430 | 23% | 38% | -40.5% | 8,682 |
| Marysville | 53,415 | 13,153 | 24,343 | 25% | 46% | -46.0% | 11,190 |
| Pasco | 52,034 | 8,713 | 16,867 | 17% | 32% | -48.3% | 8,154 |
| Lakewood | 50,020 | 9,689 | 17,853 | 19% | 36% | -45.7% | 8,164 |
| Sammamish | 47,390 | 16,067 | 27,342 | 34% | 58% | -41.2% | 11,275 |
| Shoreline | 47,336 | 15,605 | 26,807 | 33% | 57% | -41.8% | 11,202 |
| Richland | 45,933 | 16,727 | 25,559 | 36% | 56% | -34.6% | 8,832 |
| Olympia | 44,806 | 16,505 | 24,758 | 37% | 55% | -33.3% | 8,253 |
| Lacey | 41,438 | 11,152 | 20,261 | 27% | 49% | -45.0% | 9,109 |
| Burien | 41,413 | 12,502 | 17,702 | 30% | 43% | -29.4% | 5,200 |
| Bothell | 37,573 | 12,223 | 20,042 | 33% | 53% | -39.0% | 7,819 |
| Edmonds | 35,484 | 15,857 | 23,457 | 45% | 66% | -32.4% | 7,600 |
| Bremerton | 35,482 | 8,387 | 13,140 | 24% | 37% | -36.2% | 4,753 |
| Puyallup | 33,685 | 9,917 | 16,878 | 29% | 50% | -41.2% | 6,961 |
| Lynnwood | 31,071 | 7,405 | 13,231 | 24% | 43% | -44.0% | 5,826 |
| Issaquah | 30,672 | 9,010 | 16,215 | 29% | 53% | -44.4% | 7,205 |
| Longview | 29,595 | 8,193 | 13,409 | 28% | 45% | -38.9% | 5,216 |
| Pullman | 28,582 | 4,457 | 7,717 | 16% | 27% | -42.2% | 3,260 |
| Walla Walla | 27,272 | 8,270 | 11,930 | 30% | 44% | -30.7% | 3,660 |
| Wenatchee | 27,247 | 8,559 | 12,716 | 31% | 47% | -32.7% | 4,157 |
| University Place | 26,929 | 8,376 | 14,811 | 31% | 55% | -43.4% | 6,435 |
| Mount Vernon | 26,472 | 6,866 | 11,854 | 26% | 45% | -42.1% | 4,988 |
| Des Moines | 26,030 | 7,334 | 11,375 | 28% | 44% | -35.5% | 4,041 |
| Lake Stevens | 25,516 | 8,921 | 15,198 | 35% | 60% | -41.3% | 6,277 |
| SeaTac | 24,740 | 4,772 | 6,978 | 19% | 28% | -31.6% | 2,206 |
| Bainbridge Island | 19,826 | 11,247 | 16,139 | 57% | 81% | -30.3% | 4,892 |
| Tumwater | 19,775 | 6,251 | 11,159 | 32% | 56% | -44.0% | 4,908 |
| Mercer Island | 19,711 | 9,899 | 13,358 | 50% | 68% | -25.9% | 3,459 |
| Maple Valley | 19,297 | 8,263 | 11,771 | 43% | 61% | -29.8% | 3,508 |
| Kenmore | 18,694 | 6,406 | 10,942 | 34% | 59% | -41.5% | 4,536 |
| Camas | 18,548 | 8,273 | 12,910 | 45% | 70% | -35.9% | 4,637 |
| Oak Harbor | 18,278 | 4,193 | 6,605 | 23% | 36% | -36.5% | 2,412 |
| Moses Lake | 18,088 | 4,622 | 6,465 | 26% | 36% | -28.5% | 1,843 |
| Mountlake Terrace | 17,350 | 4,315 | 8,622 | 25% | 50% | -50.0% | 4,307 |
| Tukwila | 17,220 | 3,336 | 5,135 | 19% | 30% | -35.0% | 1,799 |
| Mukilteo | 17,091 | 7,871 | 10,158 | 46% | 59% | -22.5% | 2,287 |
| Mill Creek | 16,548 | 5,119 | 8,656 | 31% | 52% | -40.9% | 3,537 |
| Bonney Lake | 16,530 | 5,004 | 8,801 | 30% | 53% | -43.1% | 3,797 |
| Port Angeles | 16,169 | 6,518 | 8,992 | 40% | 56% | -27.5% | 2,474 |
| Covington | 15,610 | 3,786 | 7,990 | 24% | 51% | -52.6% | 4,204 |
| Ellensburg | 15,530 | 3,826 | 6,536 | 25% | 42% | -41.5% | 2,710 |
| Monroe | 15,129 | 3,575 | 6,345 | 24% | 42% | -43.7% | 2,770 |
| Battle Ground | 15,113 | 4,970 | 8,421 | 33% | 56% | -41.0% | 3,451 |
| Arlington | 14,782 | 3,631 | 7,457 | 25% | 50% | -51.3% | 3,826 |
| Anacortes | 14,517 | 8,515 | 10,360 | 59% | 71% | -17.8% | 1,845 |
| Centralia | 13,881 | 3,274 | 5,727 | 24% | 41% | -42.8% | 2,453 |
| Aberdeen | 13,054 | 2,895 | 4,765 | 22% | 37% | -39.2% | 1,870 |
| Washougal | 12,905 | 4,279 | 7,173 | 33% | 56% | -40.3% | 2,894 |
| Port Orchard | 11,980 | 3,355 | 5,900 | 28% | 49% | -43.1% | 2,545 |
| West Richland | 11,634 | 5,100 | 7,523 | 44% | 65% | -32.2% | 2,423 |
| Lynden | 11,547 | 5,671 | 7,966 | 49% | 69% | -28.8% | 2,295 |
| Cheney | 11,226 | 1,692 | 3,112 | 15% | 28% | -45.6% | 1,420 |
| Ferndale | 11,185 | 4,152 | 6,677 | 37% | 60% | -37.8% | 2,525 |
| Lake Forest Park | 10,877 | 5,966 | 7,835 | 55% | 72% | -23.9% | 1,869 |
| Sunnyside | 10,626 | 1,119 | 1,670 | 11% | 16% | -33.0% | 551 |
| East Wenatchee | 10,557 | 2,857 | 4,793 | 27% | 45% | -40.4% | 1,936 |
| Woodinville | 10,248 | 3,415 | 5,910 | 33% | 58% | -42.2% | 2,495 |
| Newcastle | 10,202 | 3,489 | 5,212 | 34% | 51% | -33.1% | 1,723 |
| Washington State | 6,062,910 | 1,873,617 | 3,067,686 | 31% | 51% | -38.9% | 1,194,069 |
| Total for cities in this list | 3,459,193 | 1,049,290 | 1,627,634 | 30% | 47% | -35.5% | 578,344 |

You talk about turnout ‘penalties’ and ‘bonuses’. This makes it sound as if cities and counties are being given fines or funds for votes. I think you mean that less people turn out for state-wide and federal elections, and even more for presidential elections, but there are no monetary fines, etc. Perhaps a better solution is to understand why people who will vote in a presidential election don’tbthink it’s important enough to vote in a mayor’s or school board race?
Thanks for your comment.
As noted in my next reply, the most successful strategies for strengthening our democracy focus on making the system better meet the needs of busy voters, not on convincing them that they should really care more. Because what the evidence shows is that if we hold mayor and school board elections at the same time as presidential elections, they will happily vote on all three offices. If we keep them at separate times, they will not.
In the article, you reference testing for correlation of race and ethnicity and that you found no correlation, but it doesn’t seem like you tested for correlation with age even though you mention it later in the article. It would be interesting to see the impact that age has on voter turnout in even versus odd year voter turnout.
As David mentions above, there are terms like penalties and suppression, which makes it sound that this is an intentional policy of the state to reduce voter turnout in off year elections. Is there any evidence that that was a goal of the 1963 law? Or, is this a side effect of the lack of engagement of voters in local elections?
As a Spokane resident, I have been following the discussion on Reddit regarding the low voter turnout in this election, especially of younger voters. A lot of the younger voters sounded fairly frustrated with the candidate selection process itself and didn’t like either candidate, they didn’t care enough to vote, the candidates didn’t seek out their demographic, they didn’t know the candidates or issues, or they felt that it wouldn’t make a difference regardless. Would even year voting change any of this or would it potentially make it worse? Would these potential voters be any more informed about the issues or candidates?
What would the impact on the local campaigns be? Local candidates would be competing for ad space, yard space, donations, and just plain attention with state and federal candidates. It would be interesting to ask those local candidates in states where this change has occurred the impact of consolidating elections into even years.
I am not opposed to this idea but I do have a concern that other than increasing voter turnout, it wouldn’t have a positive impact on local campaigns, but actually create a negative impact. I cannot validate those concerns through any studies or research but I do believe that my concerns are valid and deserve consideration.
What I would really like to see is increased awareness of local issues and positions by our younger voters. I know I wasn’t overly concerned about it when I was younger and I see the same issue with my kids and other young people now. If they are registered to vote, Washington has made it very easy for them to do so with prepaid mail-in ballots and a voters guide. It doesn’t seem to help though. I believe that’s a citizen engagement issue that won’t be solved by consolidating elections into even years.
Thanks for your comment and sorry for my slow reply. I’ve been away.
We lacked data to run correlations by city or district and age, largely because there’s not huge variation in the age composition of different cities and districts. But if you follow the links early in this article to the half dozen other articles Sightline has published on this topic, you’ll see answers to your question — and to your other questions and concerns.
I found no legislative history on the 1963 Washington law, but yes, there’s abundant evidence that the national movement in the United States to move local elections to odd-numbered years in the early 1900s was partly motivated by anti-ethnic sentiments. In Washington, the 1963 law codified a previous pattern that was similar. Again, you’ll find more if you review our other articles.
The strongest finding about the demographic effect of shifting local elections on cycle is that it dramatically increases participation among younger voters. Off-cycle elections yield low turnout that’s heavily concentrated among retirees and homeowners. National research shows that voters in on-cycle elections are just as informed about the issues and candidates as they are in off-cycle elections, so the idea that local races will get lost in the shuffle is not supported by the evidence. The way I think about this is to remember that most voters make their decisions with relatively little information. And they mostly follow the lead of their own trusted sources — party, club, friend group, union, media outlet they like, whatever. They show up to vote for high-stakes offices like President and Congress, and they stay to vote for the rest of the offices, relying on the same information sources to make their selections. Separating the races does NOT increase voters’ information about local politics. It just causes them to not bother voting.
One can wish voters were more civically minded, attended candidate forums, read local newspapers, and showed up for city council meetings — I do. But that’s largely a hand-wringing exercise. A more fruitful approach is to look at the systemic and institutional factors that yield participation. Automatic voter registration and vote by mail are examples of what’s come from following this approach: systems, not persuasion. Election timing is the last giant, unused strategy. And it’s wildly popular. Voters of all ages are consistent and clear across the US that they want fewer elections and they want them on election day in November. When given that system, they participate.
I don’t have time to read all this. Could yall just let me know or highlight any observations where job positions and routinely expiring taxes decided in odd years had an increased/decreased number of votes after those decisions were made in even years, *among those who are poor*?
The demographic with relatively no registration or turnout is those of low income. There’s King County data with assessed property value. There’s Census Bureau CPS data with household income. There are many national and international studies over the past three decades from Kim Quailie Hill in 1992 to Theodossiou in 2020 suggesting the strength of a social safety net correlates with voter turnout.
I don’t think expecting someone working 60+hours a week and developing an illness through poverty to make all these decisions at the same time is justified. Age/race data is inadequate.
Ranked choice voting and mandatory PTO for presidential primaries, state primaries, and general elections makes more sense?
Thank You