fbpx

Micro-housing: It’s Not about the Size but How You Use It

Find audio versions of Sightline articles on any of your favorite podcast platforms, including Spotify, Google, and Apple.

Editor’s note: Guest author David Neiman is a principal at Neiman Taber Architects, where he is deeply involved in micro-housing as an architect, developer, and proponent in the public policy sphere. His firm works to create plentiful, high-quality, small unit housing, designed to support livability and promote community among residents. 

I’ve spent much of the last decade designing and developing micro-housing projects in Seattle. I’ve also become deeply involved in local and state policy debates around regulating this type of housing. During this time, I’ve witnessed a shift in how micro-housing is viewed and managed: beginning as a novelty and quickly evolving from a developer’s workaround to the neighborhood advocates’ nightmare, to the politicians’ headache and the bureaucrats’ bogeyman, all the while being slowly driven towards extinction by over-regulation. 

Despite this, and over the din of the loudest voices at the political extremes, I’ve seen a consensus emerge in policy circles recognizing that micro-housing is one of the simplest and most straightforward ways to put more homes into a housing market that is simply starving for them. It’s also one of the most effective ways to give people of modest means the opportunity to live in desirable neighborhoods with access to jobs, services, education, amenities, arts, culture, and an overall high quality of life. 

At all levels of government, politicians and policymakers are looking for ways to promote more of this type of housing. But they stumble on the question of “how small is too small,” where to look for guidance, and how to develop appropriate regulations that govern the size of micro-housing. Below I share key resources to inform this conversation, as well as a number of designs to help leaders envision how these homes could look and feel for the many neighbors who need them. Spoiler alert: A well designed studio apartment can be a lot smaller than most people think. 

Building codes over zoning codes; Or, health and safety over opinions 

First things first: it’s important to differentiate between building codes and zoning codes. Building codes regulate unit size by directly specifying minimum square footage of the floor area. Zoning codes take a more circumspect approach, using density limits, parking requirements, and per unit amenities that indirectly govern housing size.  

For the purposes of this article, we will ignore zoning codes, which are inherently political documents that vary from city to city. Instead, we’ll focus on the International Building Code (IBC), which is used in all 50 US states. It has a narrower mandate, which is simply (but importantly) to protect public health and safety and to safeguard against hazards in the built environment. While in practice, the ultimate rationale for a zoning code provision can be merely “because I said so,” the building code is supposed to have an empirical justification and so can be evaluated on that basis. 

The IBC regulates housing size by dictating the minimum size of “habitable” rooms. For instance, a studio apartment requires a 190-square-foot living room. Additionally, the IBC mandates that a kitchen, a bathroom, and a storage closet be provided. Combining those elements with the code-required circulation and accessibility clearances, a studio apartment’s minimum size usually ends up at about 300 square feet.1This measurement refers to the interior “paint-to-paint” dimensions of the apartment. The measurement method commonly used for listing apartment sizes, known as BOMA, includes wall thickness and typically results in a measurement about 10 percent higher.
 

A 300-square-foot studio apartment is by no means luxurious, but smaller apartments are quite common, and I would guess that most of us have lived in smaller spaces at one time or another. In Seattle, a 300-square-foot studio rents for approximately $1,600 per month, making it affordable for people earning around $64,000 annually. That’s fine if you can afford it, but nearly half of Seattle’s renters can’t afford to pay that much for rent 

To serve these neighbors, either we need to build housing that is smaller and more affordable than what conventional development can deliver, or we need to provide subsidized housing to a large percentage of our population. Realistically, our present social safety net can’t even provide for our most vulnerable populations, let alone people who are fully employed but simply earn a modest salary. This is where micro-housing can play a crucial role. 

Imagining a new micro-housing norm 

Of Cascadia’s major cities, I’m most familiar with Seattle, which has been a national leader in micro-housing. In recent years the city has built thousands of micro-homes in various forms. One type is a smaller studio apartment that Seattle calls a Small Efficiency Dwelling Unit (SEDU). This type of housing has been legal for over 20 years, offering residents smaller and more affordable alternatives to traditional studios. 

Housing advocates in Washington are working on legislation this year to legalize this kind of small studio apartment throughout the state. But to get there, legislators and policymakers first need to understand that this type of housing is humane, safe, and dignified. To show that, let’s compare what the code allows today to some smaller, more affordable alternatives. 

Status quo: Today’s typical micro-housing studio 

Here is what a typical 300-square-foot studio apartment plan looks like (see Figure 1). It features a 190-square-foot living room, which accommodates a bed, a couch, and a small dining area. Additionally, there’s a compact kitchen, a storage closet, and a bathroom.  

If you’re a developer aiming to provide the most homes at the lowest cost, your goal is to reduce the unit size to get the most units possible into a floorplate. Under current rules, you can’t reduce the living room below 190 square feet, and accessibility codes mandate a minimum bathroom size, typically 5 feet by 8 feet. To squeeze in more units per floor, the only option is to shrink the kitchen and storage space to the bare minimum. Here is a plan of what that looks like. 

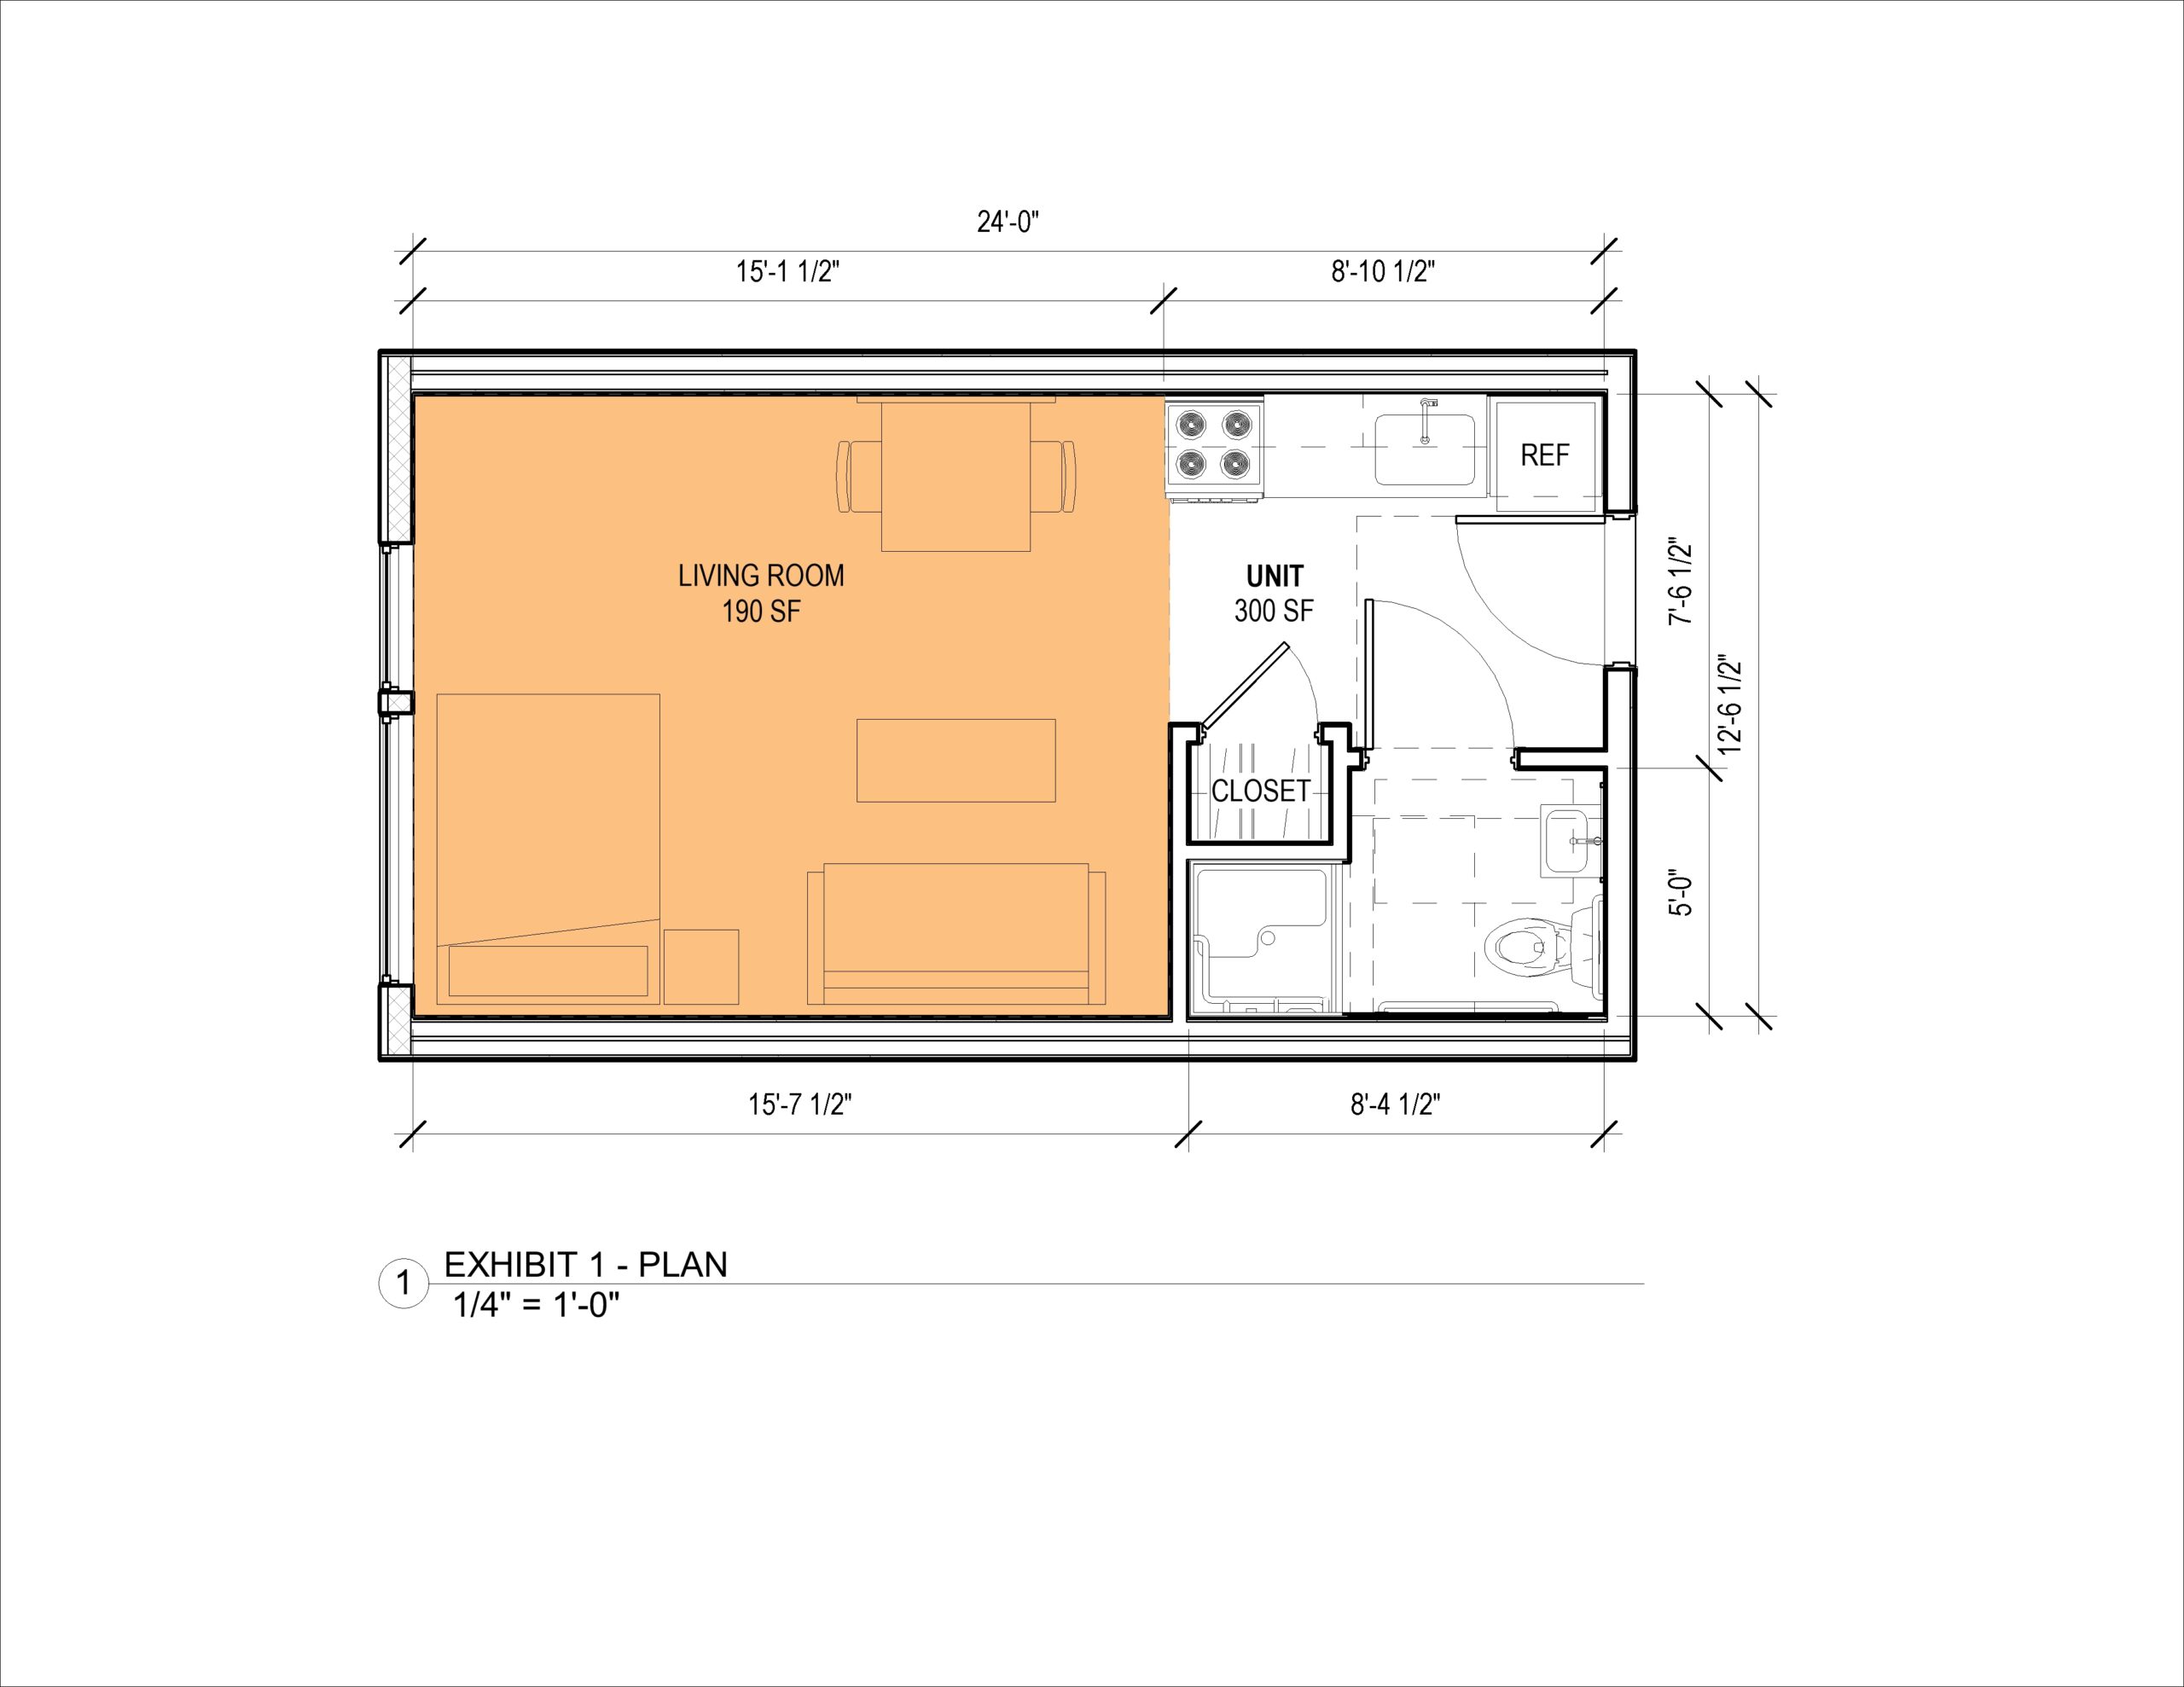
Figure 1: A mandated 190-square-foot living room in a 300-square-foot home reduces kitchen and storage spaces to their absolute minimums. Image by Neiman Taber Architects.

Status evolved: More livability, less living room 

Now let’s try a different approach. From a livability perspective, empty floor space is probably the least important feature that a person needs in their home.  

In this redesigned plan of the same unit, we’ve increased the kitchen size, providing more countertop workspace, additional storage and cabinets, a washer-dryer unit, a desk, and bookshelves. There’s still enough room for furniture, but by trading some living room area for more practical built-in features, we’ve created a significantly more comfortable home. And the total unit size is still 300 square feet. 

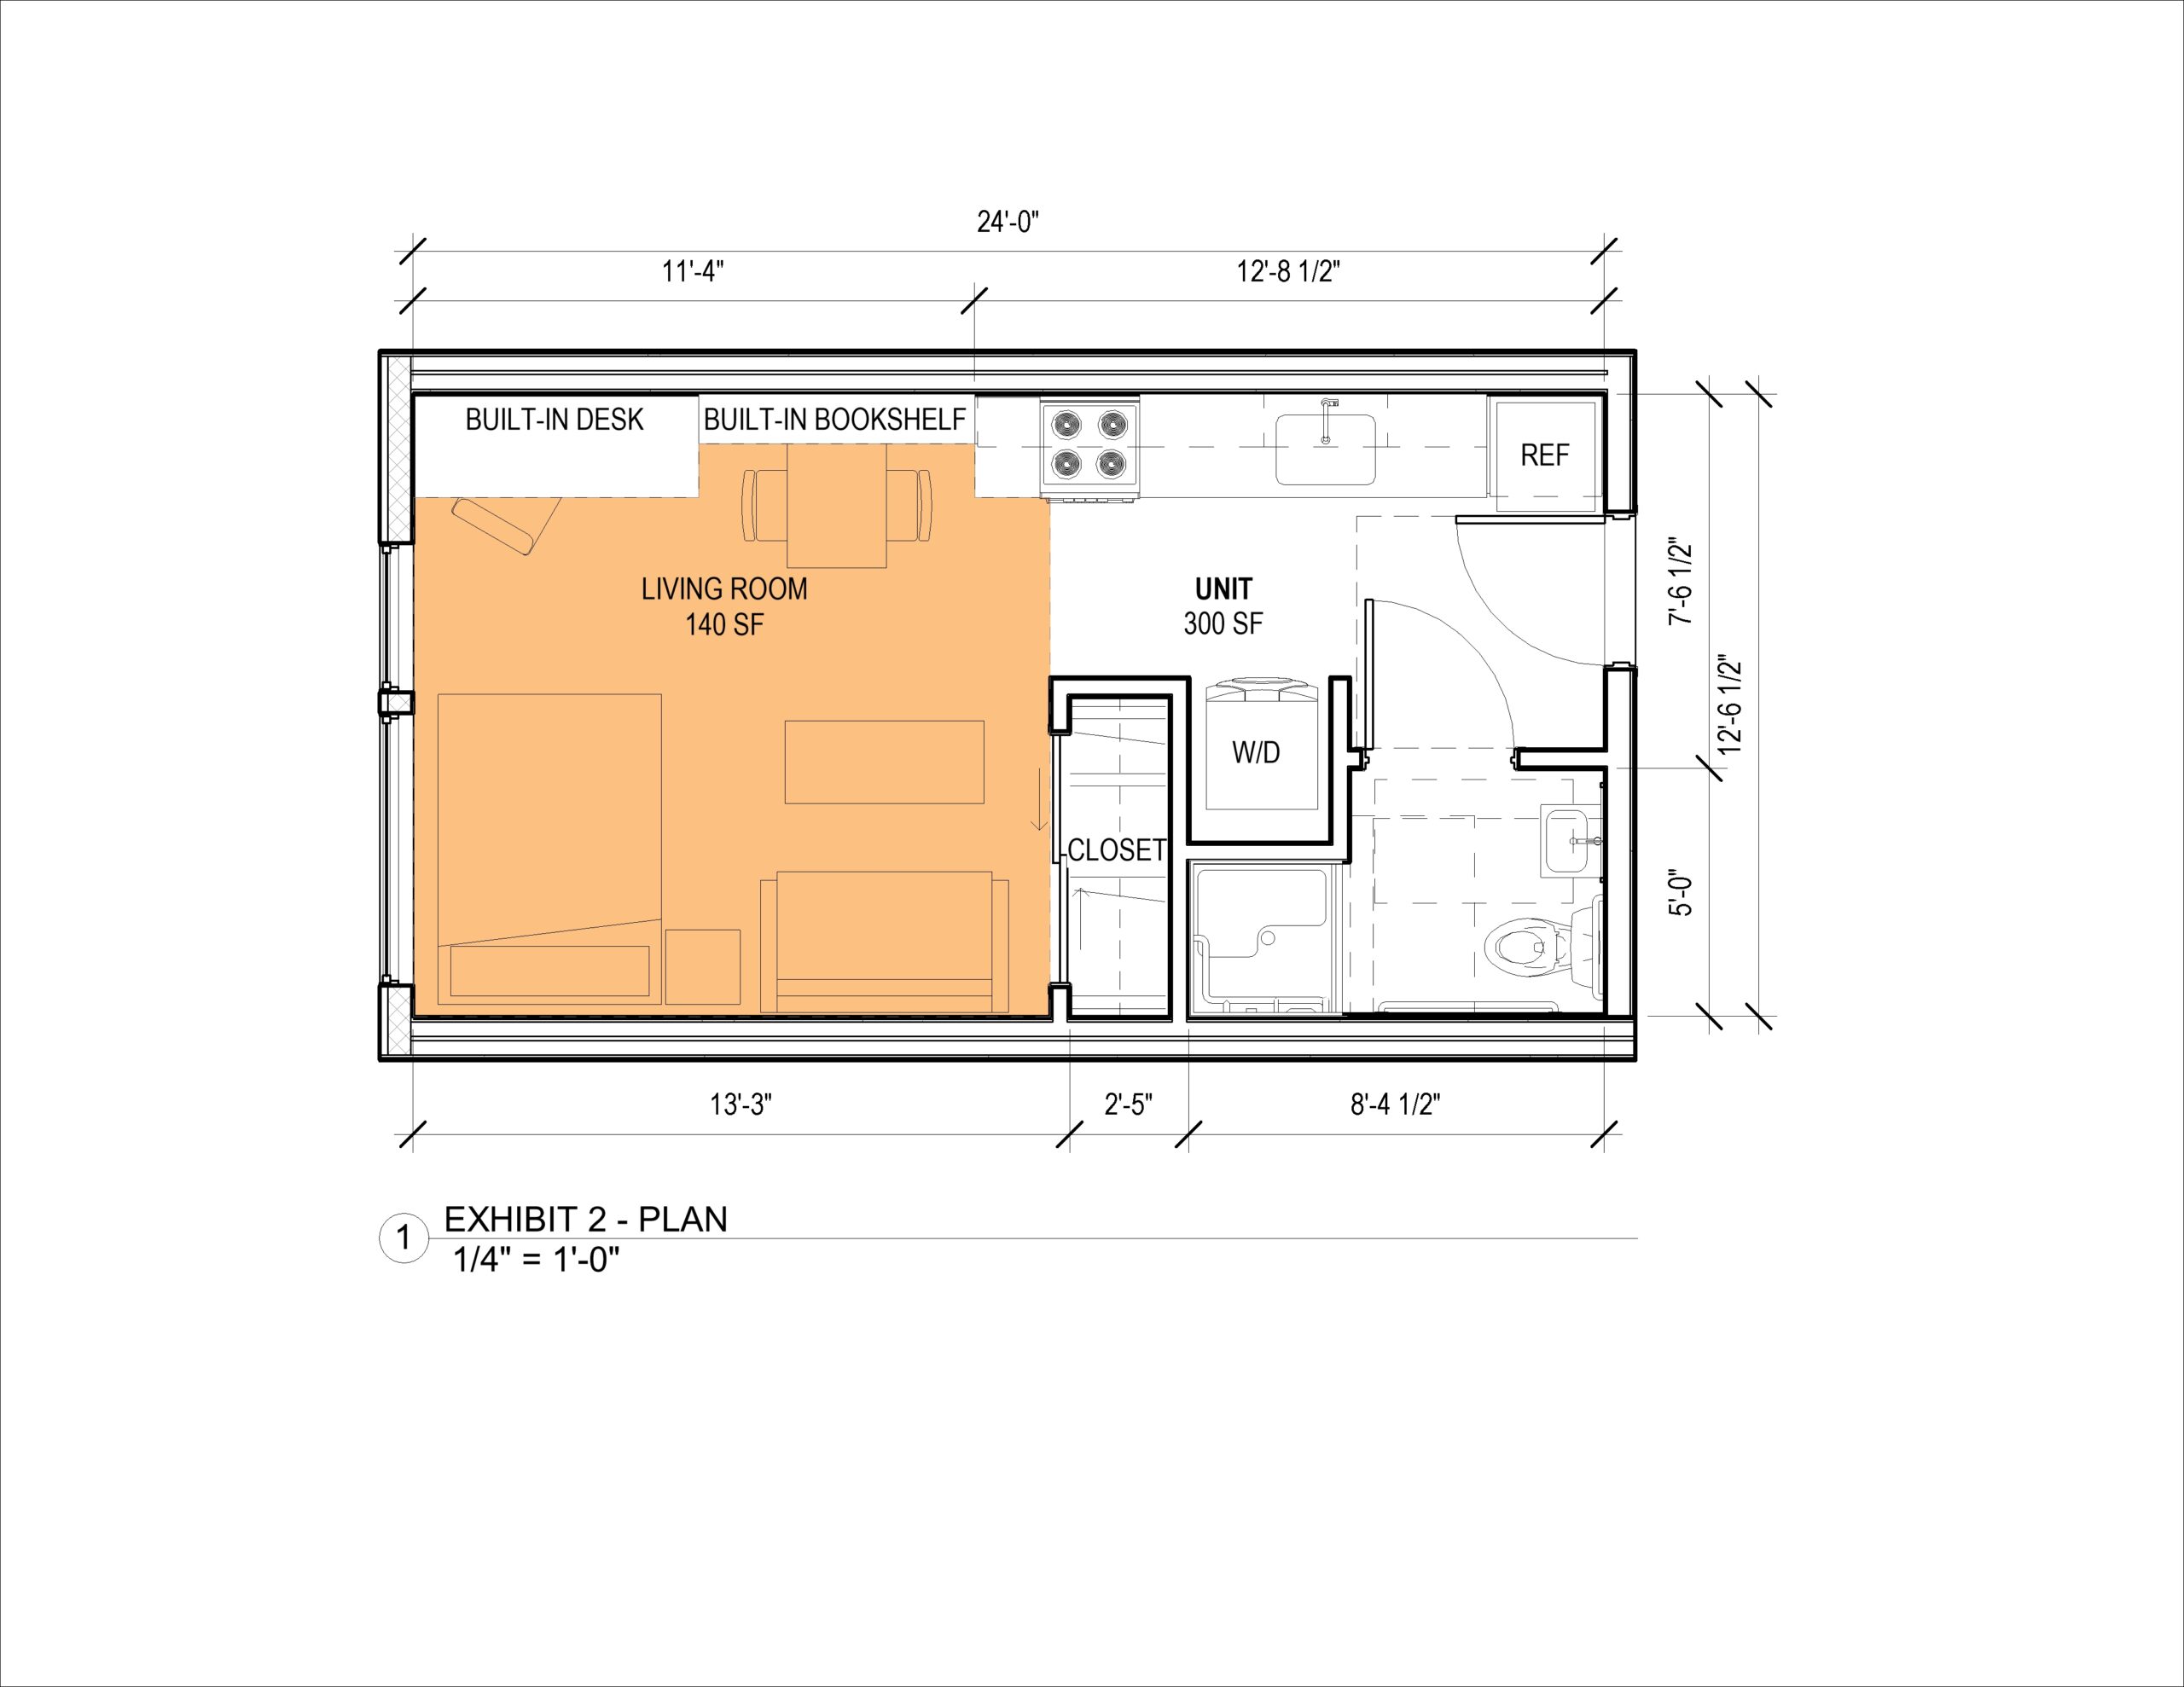
Figure 2: A revised design with a 140-square-foot living room in a 300-square-foot home increases kitchen counter space and adds more storage space, built-in furniture, and even a washer-dryer. Image by Neiman Taber Architects.

Use the slider below to compare the two designs: the first with its 190-square-foot living room and the second with its 140-square-foot living room—and added kitchen counter space, storage space, built-in furniture, and even a washer-dryer. Which would you prefer to live in? 

These two plans demonstrate a simple point: If you’re trying to design a building code to make a small unit more livable, forcing the living room to be larger is the wrong approach. Unfortunately, this is exactly what the IBC does. 

The origins of the IBC’s 190-square-foot living room mandate 

It’s worth a moment to discuss where the requirement for a 190-square-foot living room comes from. It’s not a universally accepted number. Until the 2018 IBC code update, the minimum standard for a living room was 220 square feet. Seattle’s SEDU standards allow for a 120- to 150-square-foot living room, depending on how you measure it. The IBC also allows congregate housing units—i.e., where residents have a private bedroom but share things like a kitchen, dining room, and other common spaces—with living spaces as small as 70 square feet. These are all forms of permanent housing meant for use by the general public, yet the size requirements vary widely.  

A skeptical observer might wonder if these square footage requirements have any empirical basis or are merely arbitrary. A review of historical codes would prove the skeptic right. The Uniform Building Code, the predecessor to the IBC we use today, was first published in 1927. About two decades later in 1946, it introduced minimum room sizes, including an 80-square-foot living room. In 1964 the requirement grew to 90 square feet. In 1973, the requirement suddenly more than doubled to 220 square feet 

The square footage minimums do not stem from a long tradition nor any particular health or safety principle. The fact that today’s standard arrived suddenly in the early 1970s likely has more to do with urban politics of the day. At that time, most American cities were in decline, losing their population and tax base to the suburbs and struggling with high crimes rates. In reaction, many cities enacted policies aimed at getting rid of small, low-cost housing types like SROs where poor people lived.  

Another way: Public health-informed priorities and sizing 

Public health experts have long acknowledged that the built environment heavily impacts human health. The National Healthy Housing Standard (NHHS), developed by public health professionals, serves as a tool for planners, elected officials, and policymakers to design regulations for housing that are based on the public health literature.2Document pages 30–33 specify kitchen, bathroom, and minimum space recommendations.
  

So what does the NHHS standard recommend for minimum living room sizes? A mere 70 square feet. However, this is not the end of the story. While the IBC focuses primarily on living room size, the NHHS gives more attention to subjects such as cleanliness, adequate storage, and functional food preparation. 

For example, the NHHS stipulates the need for a kitchen with both a range top and oven, a refrigerator and a freezer, and a designated space for utensils and cooking tools. It also requires a kitchen to have a washable backsplash and cleanable floors. In contrast, the IBC remains mostly silent on these matters, requiring only a microwave oven, a sink, and a mini-fridge. 

Another example: The NHHS mandates the use of low-pile carpets, non-absorbent flooring, low-VOC finishes, and other requirements aimed at providing cleanable surfaces and healthy indoor air quality. The IBC is silent on these matters. 

In general, if we look to the IBC as a guide for designing micro-homes, we end up with larger and more expensive housing units than necessary, often lacking important livability features. In contrast, the NHHS permits smaller and more efficient homes but demands other essential amenities for livability, well-being, and sanitation. 

What would a better micro-home look like? 

At this point we’ve established a few things.  

  1. The current standards are somewhat arbitrary. 
  2. Living room size is not a reliable measure of livability. 
  3. A better standard would focus much less on unit size and more on design elements that support healthy lifestyles.  

Clearly, we can build humane, quality housing smaller than what the IBC code allows today, but the question remains: how small is too small? Below are floor plans for micro-homes with living rooms of 120, 95, and 70 square feet in 250-, 220-, and 200-square foot units respectively—and plenty of space for living well in each.  

The 120 in a 250: A Seattle SEDU-compliant option 

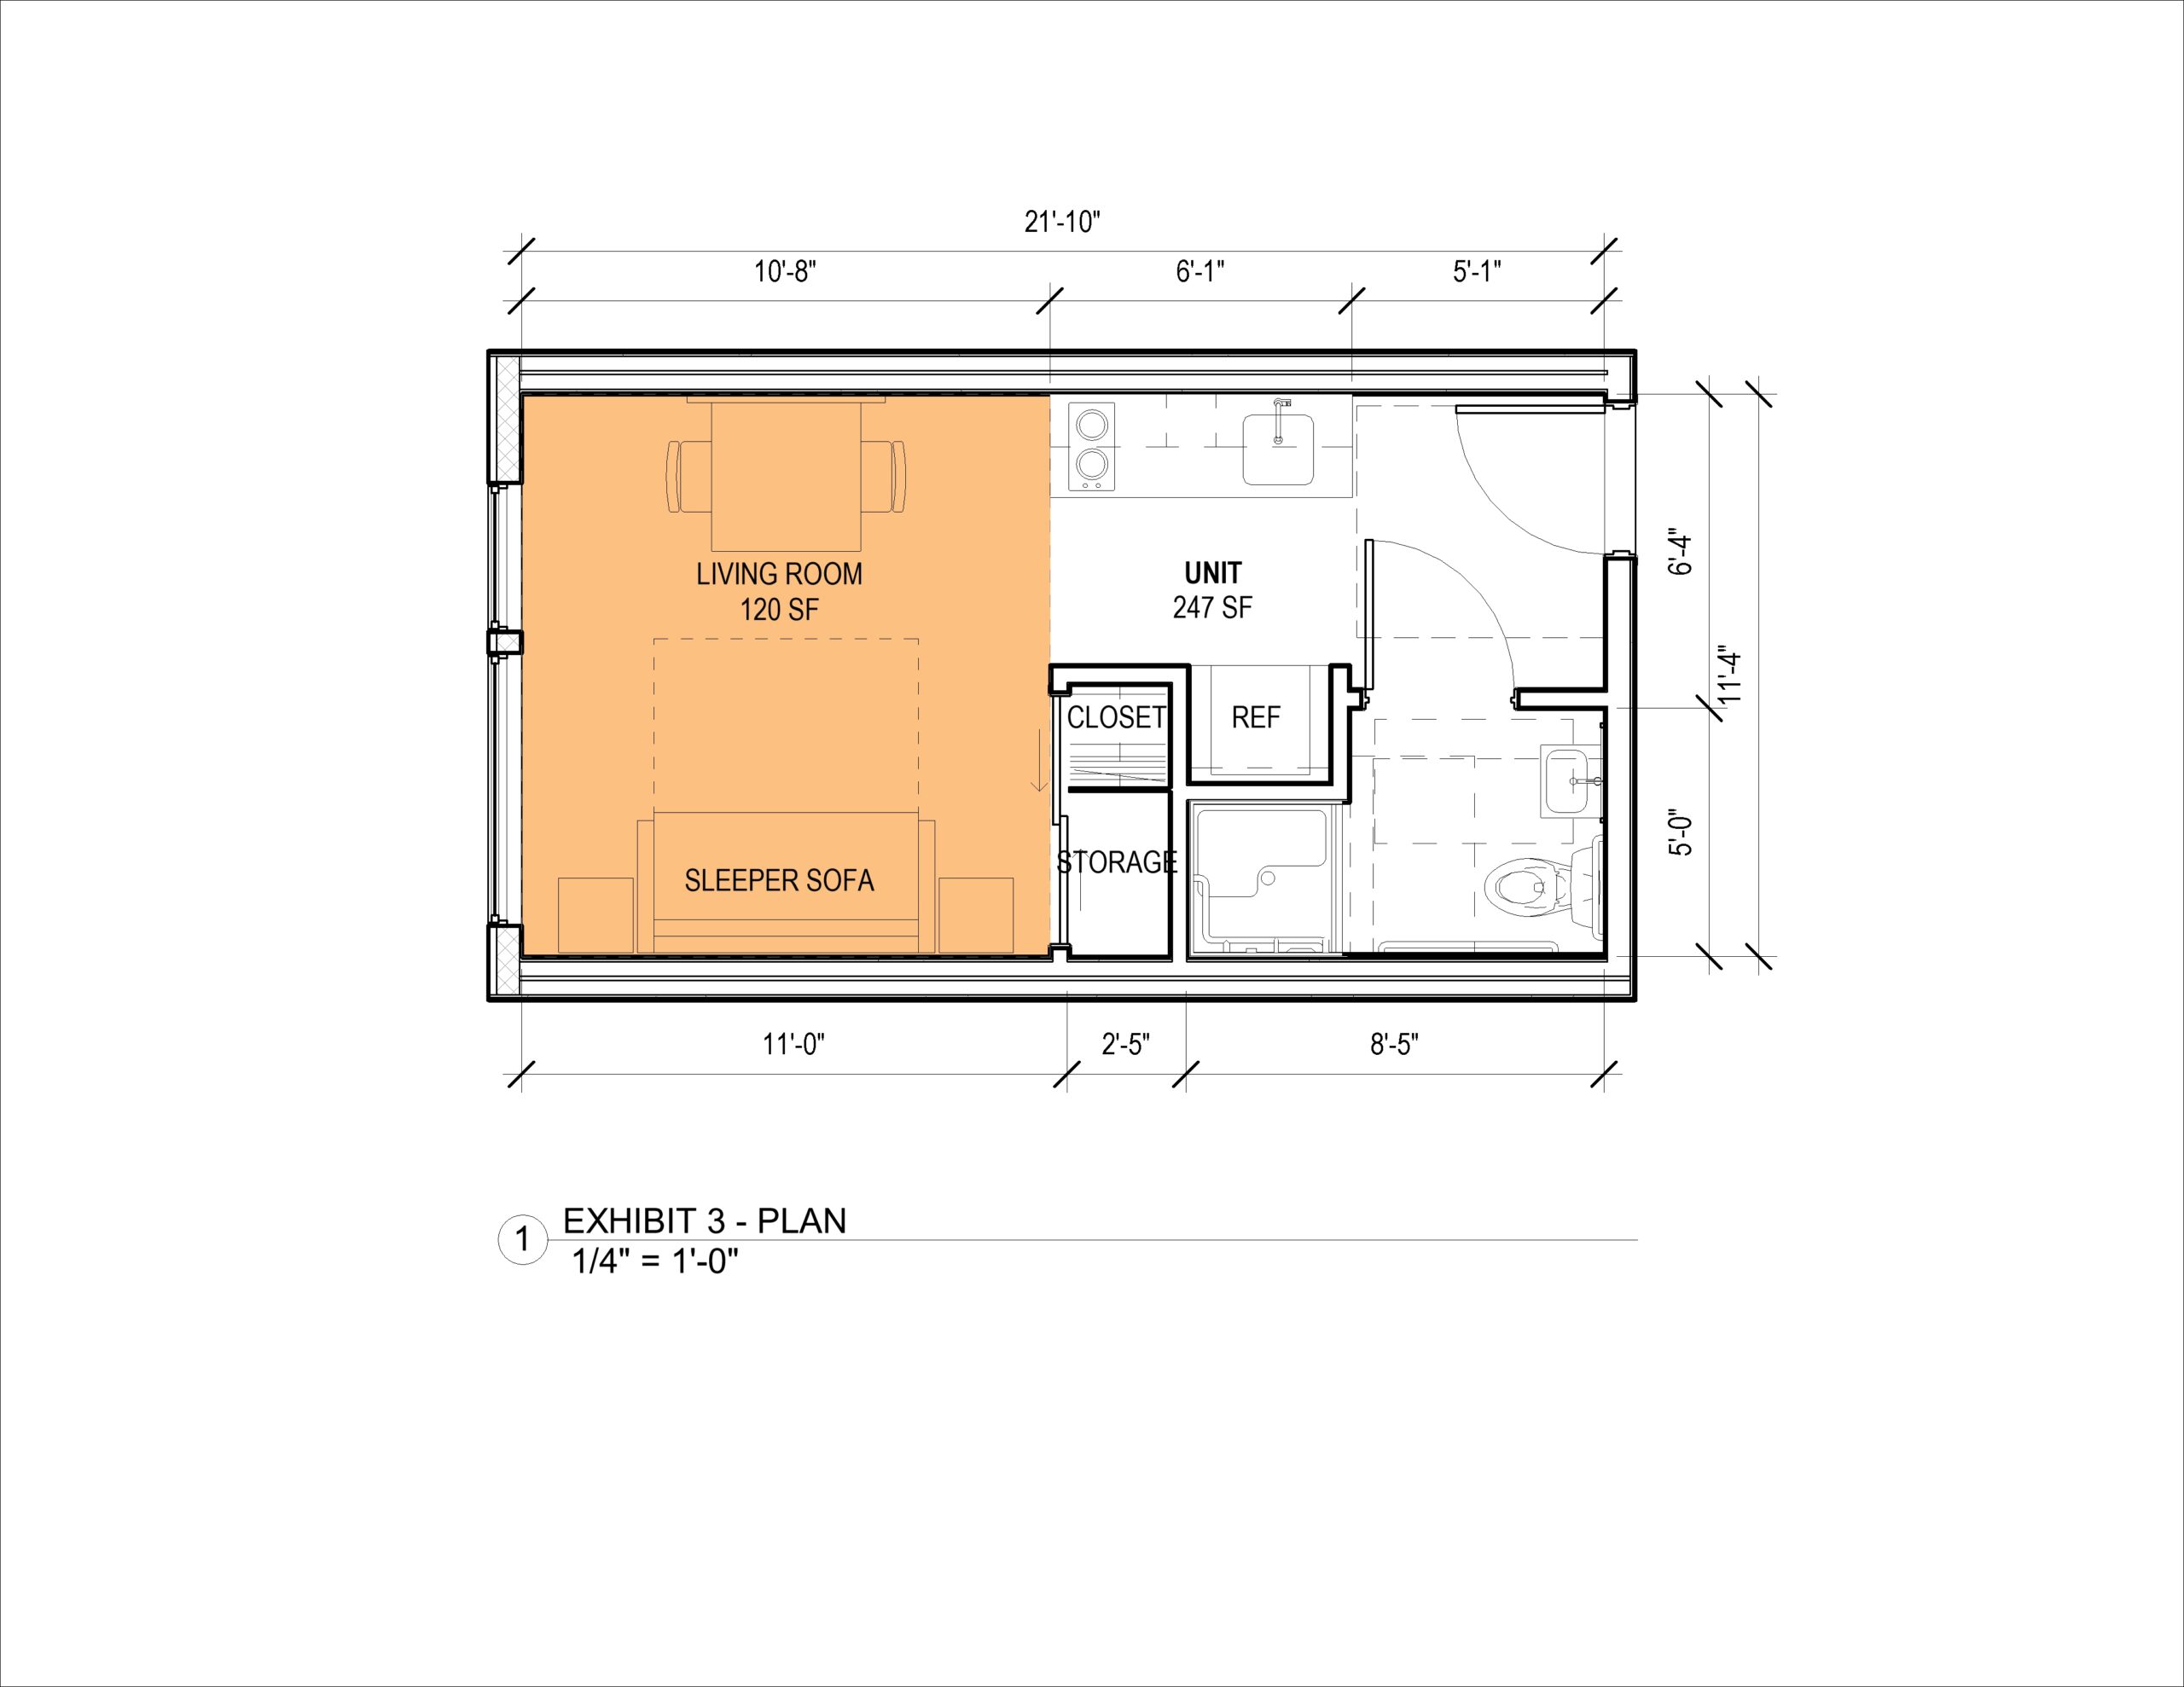
Figure 3: A 250-square-foot studio that is Seattle SEDU-compliant. With a 120-square-foot living room, it can’t accommodate both a bed and couch in the living space. Image by the Neiman Taber Architects.

We’ll begin with a small studio along the lines of what Seattle allows for a Small Efficiency Dwelling Unit (SEDU). It complies with all of Seattle’s regulations, including some of the city’s idiosyncratic rules about countertop areas, storage configuration, and how to measure the living room.  

In total, this SEDU measures 250 square feet. At this scale there is room for a basic kitchen, bathroom, and storage area, plus the minimum required 120-square-foot living room. The living room area can comfortably fit a dining room table plus one more large piece of furniture. Unlike the larger 300-square-foot studio in Figures 1 and 2, we don’t have enough space for both a couch and a bed, so we opted for a convertible sofa that can serve both purposes. 

The 90 in a 220: More kitchen and storage, plus a washer-dryer 

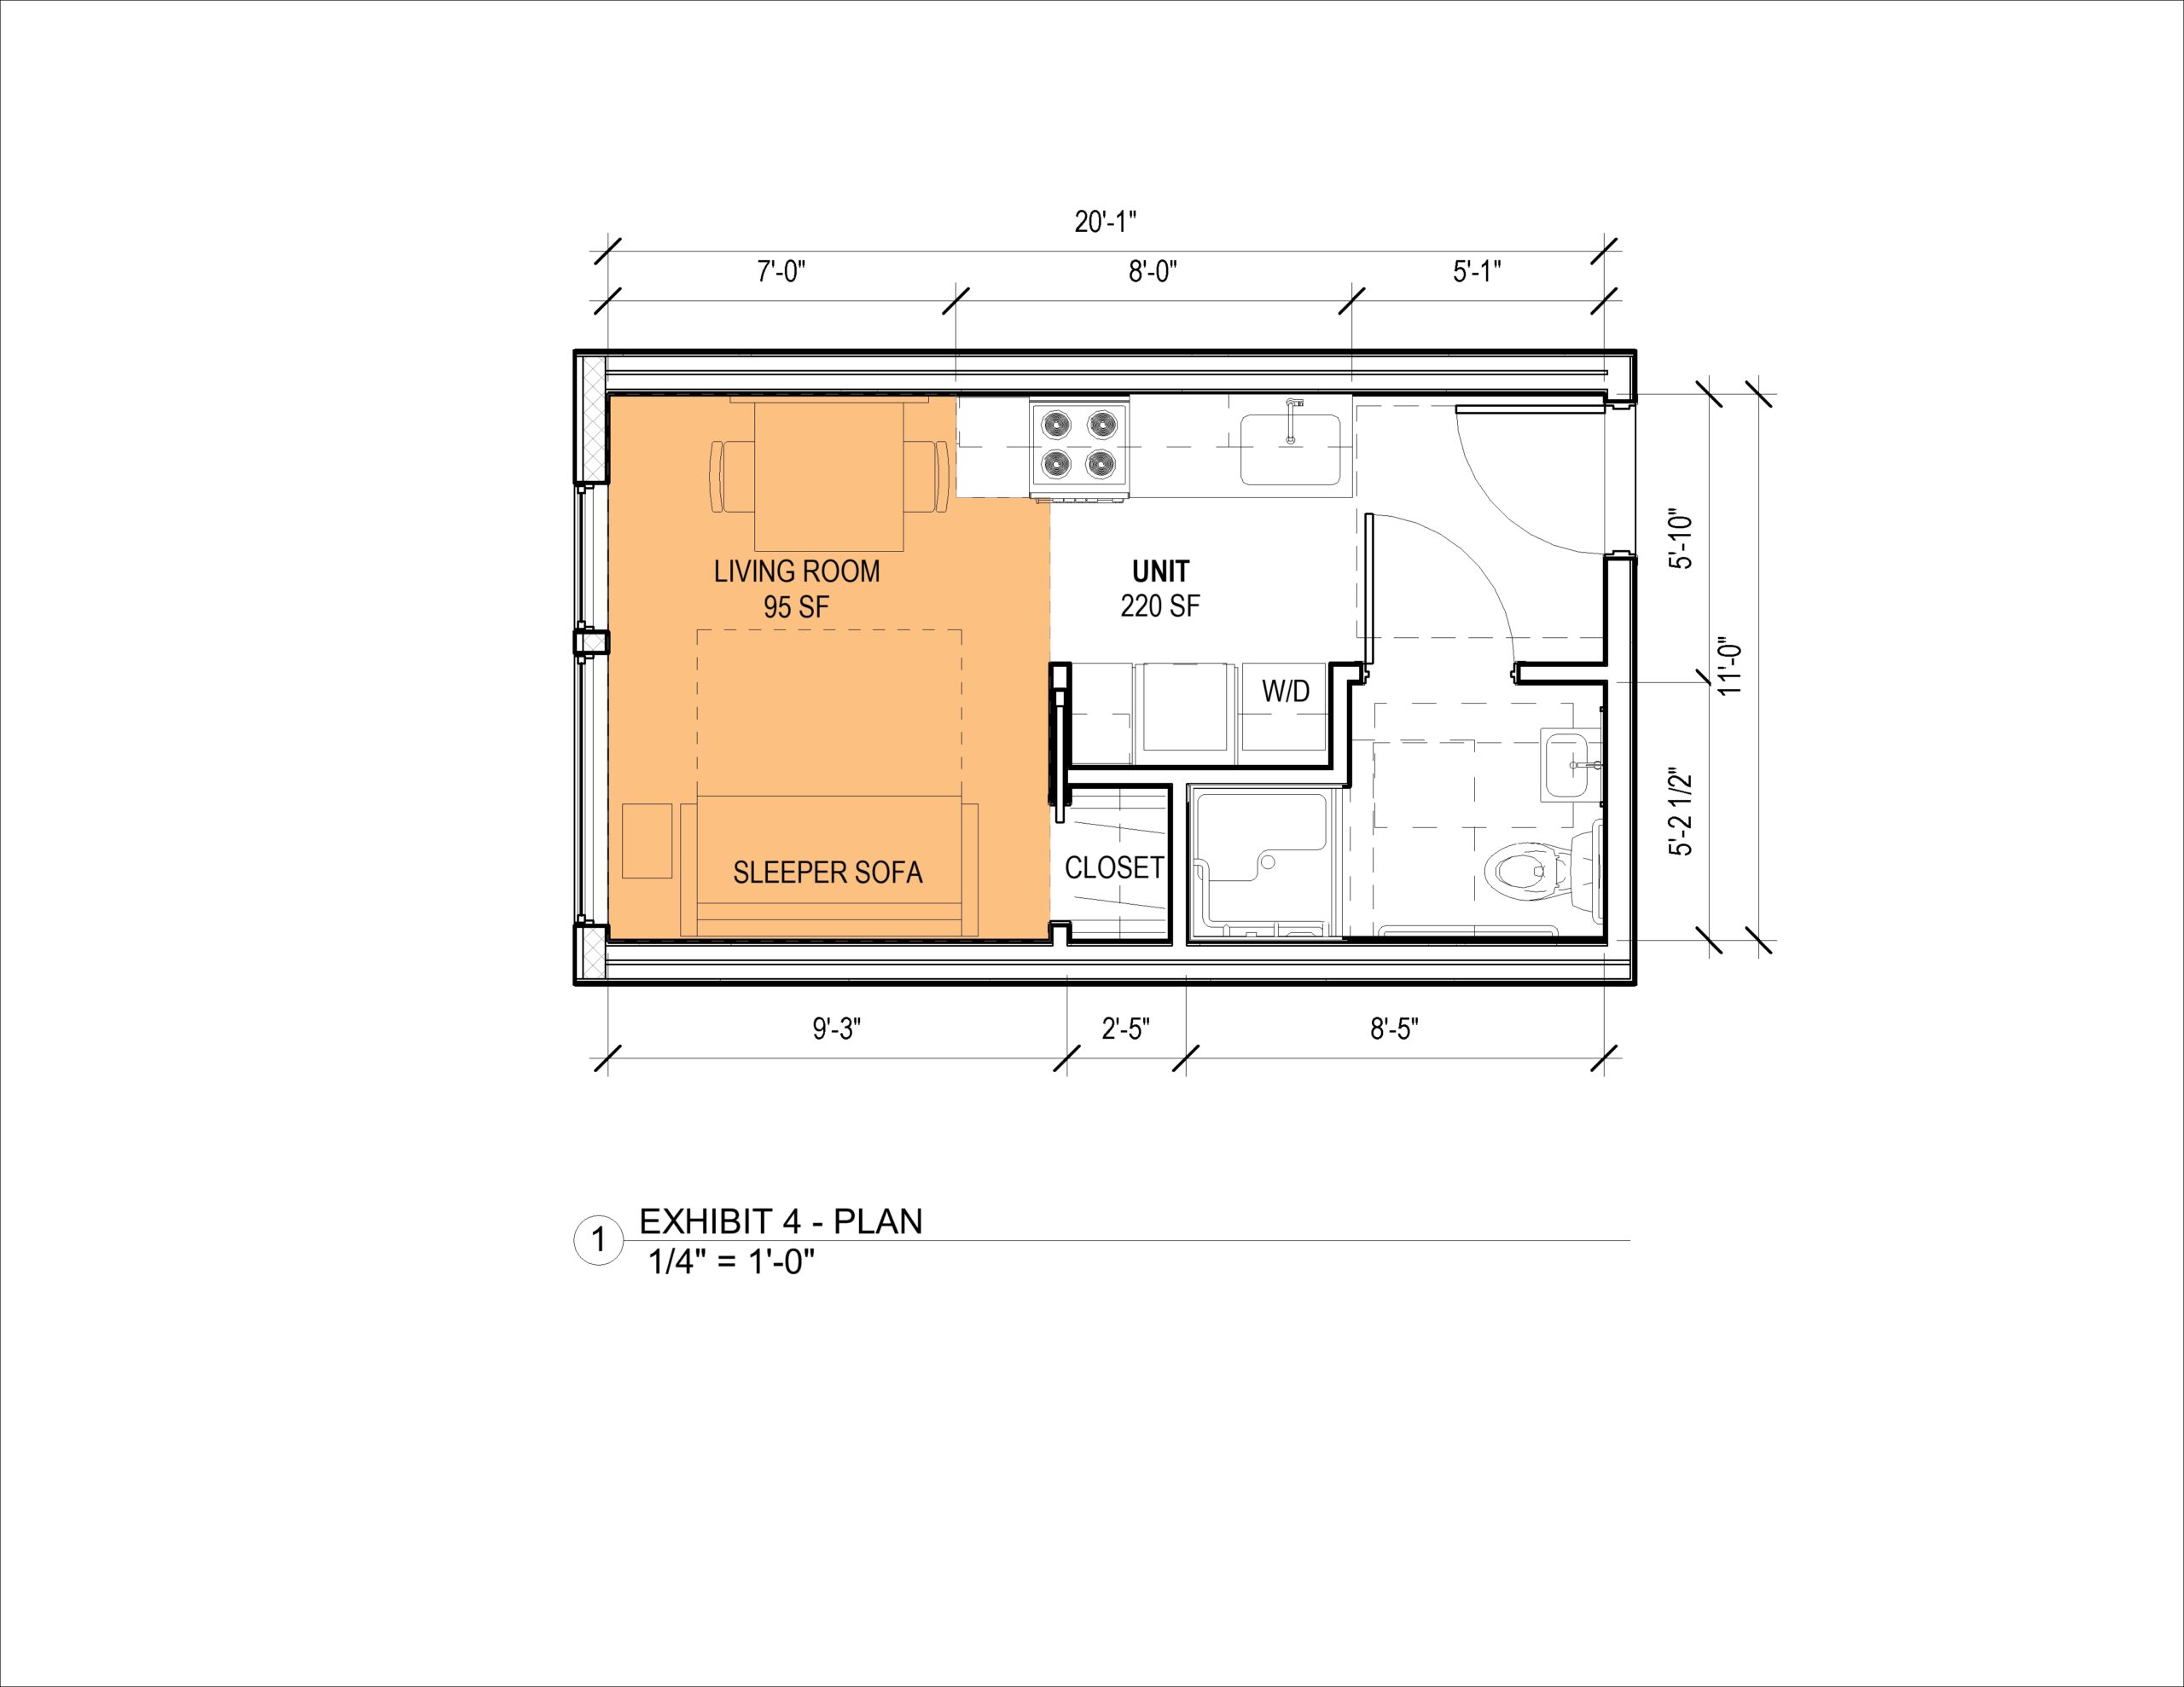
Figure 4: A 220-square-foot SEDU variation, with a smaller living room and more kitchen space, storage, and even a washer-dryer. It complies with Seattle’s SEDU rules for total square footage but not living room square footage. Image by Neiman Taber Architects.

This design is a variation on the SEDU. It meets the city’s minimum total square footage for a Seattle SEDU, but it dispenses with the city’s living room size minimum. (The design also meets the minimum requirement for a small studio under a similar program in San Francisco.) 

This is the scale of unit that was typical for SEDUs in Seattle before 2016, when building officials enacted a series of code interpretations that changed the way that habitable space is measured, requiring a larger living room area. Compared to the slightly larger unit and living room above, here we can still fit the same suite of furniture, but also a larger kitchen, a more useful storage area, and a washer-dryer. For comparison, this living room is about 95 square feet, so losing just less than a quarter of the living room space of the prior design. 

The 70 in a 200: NHHS-approved, with handy built-ins, more kitchen and storage, plus washer-dryer 

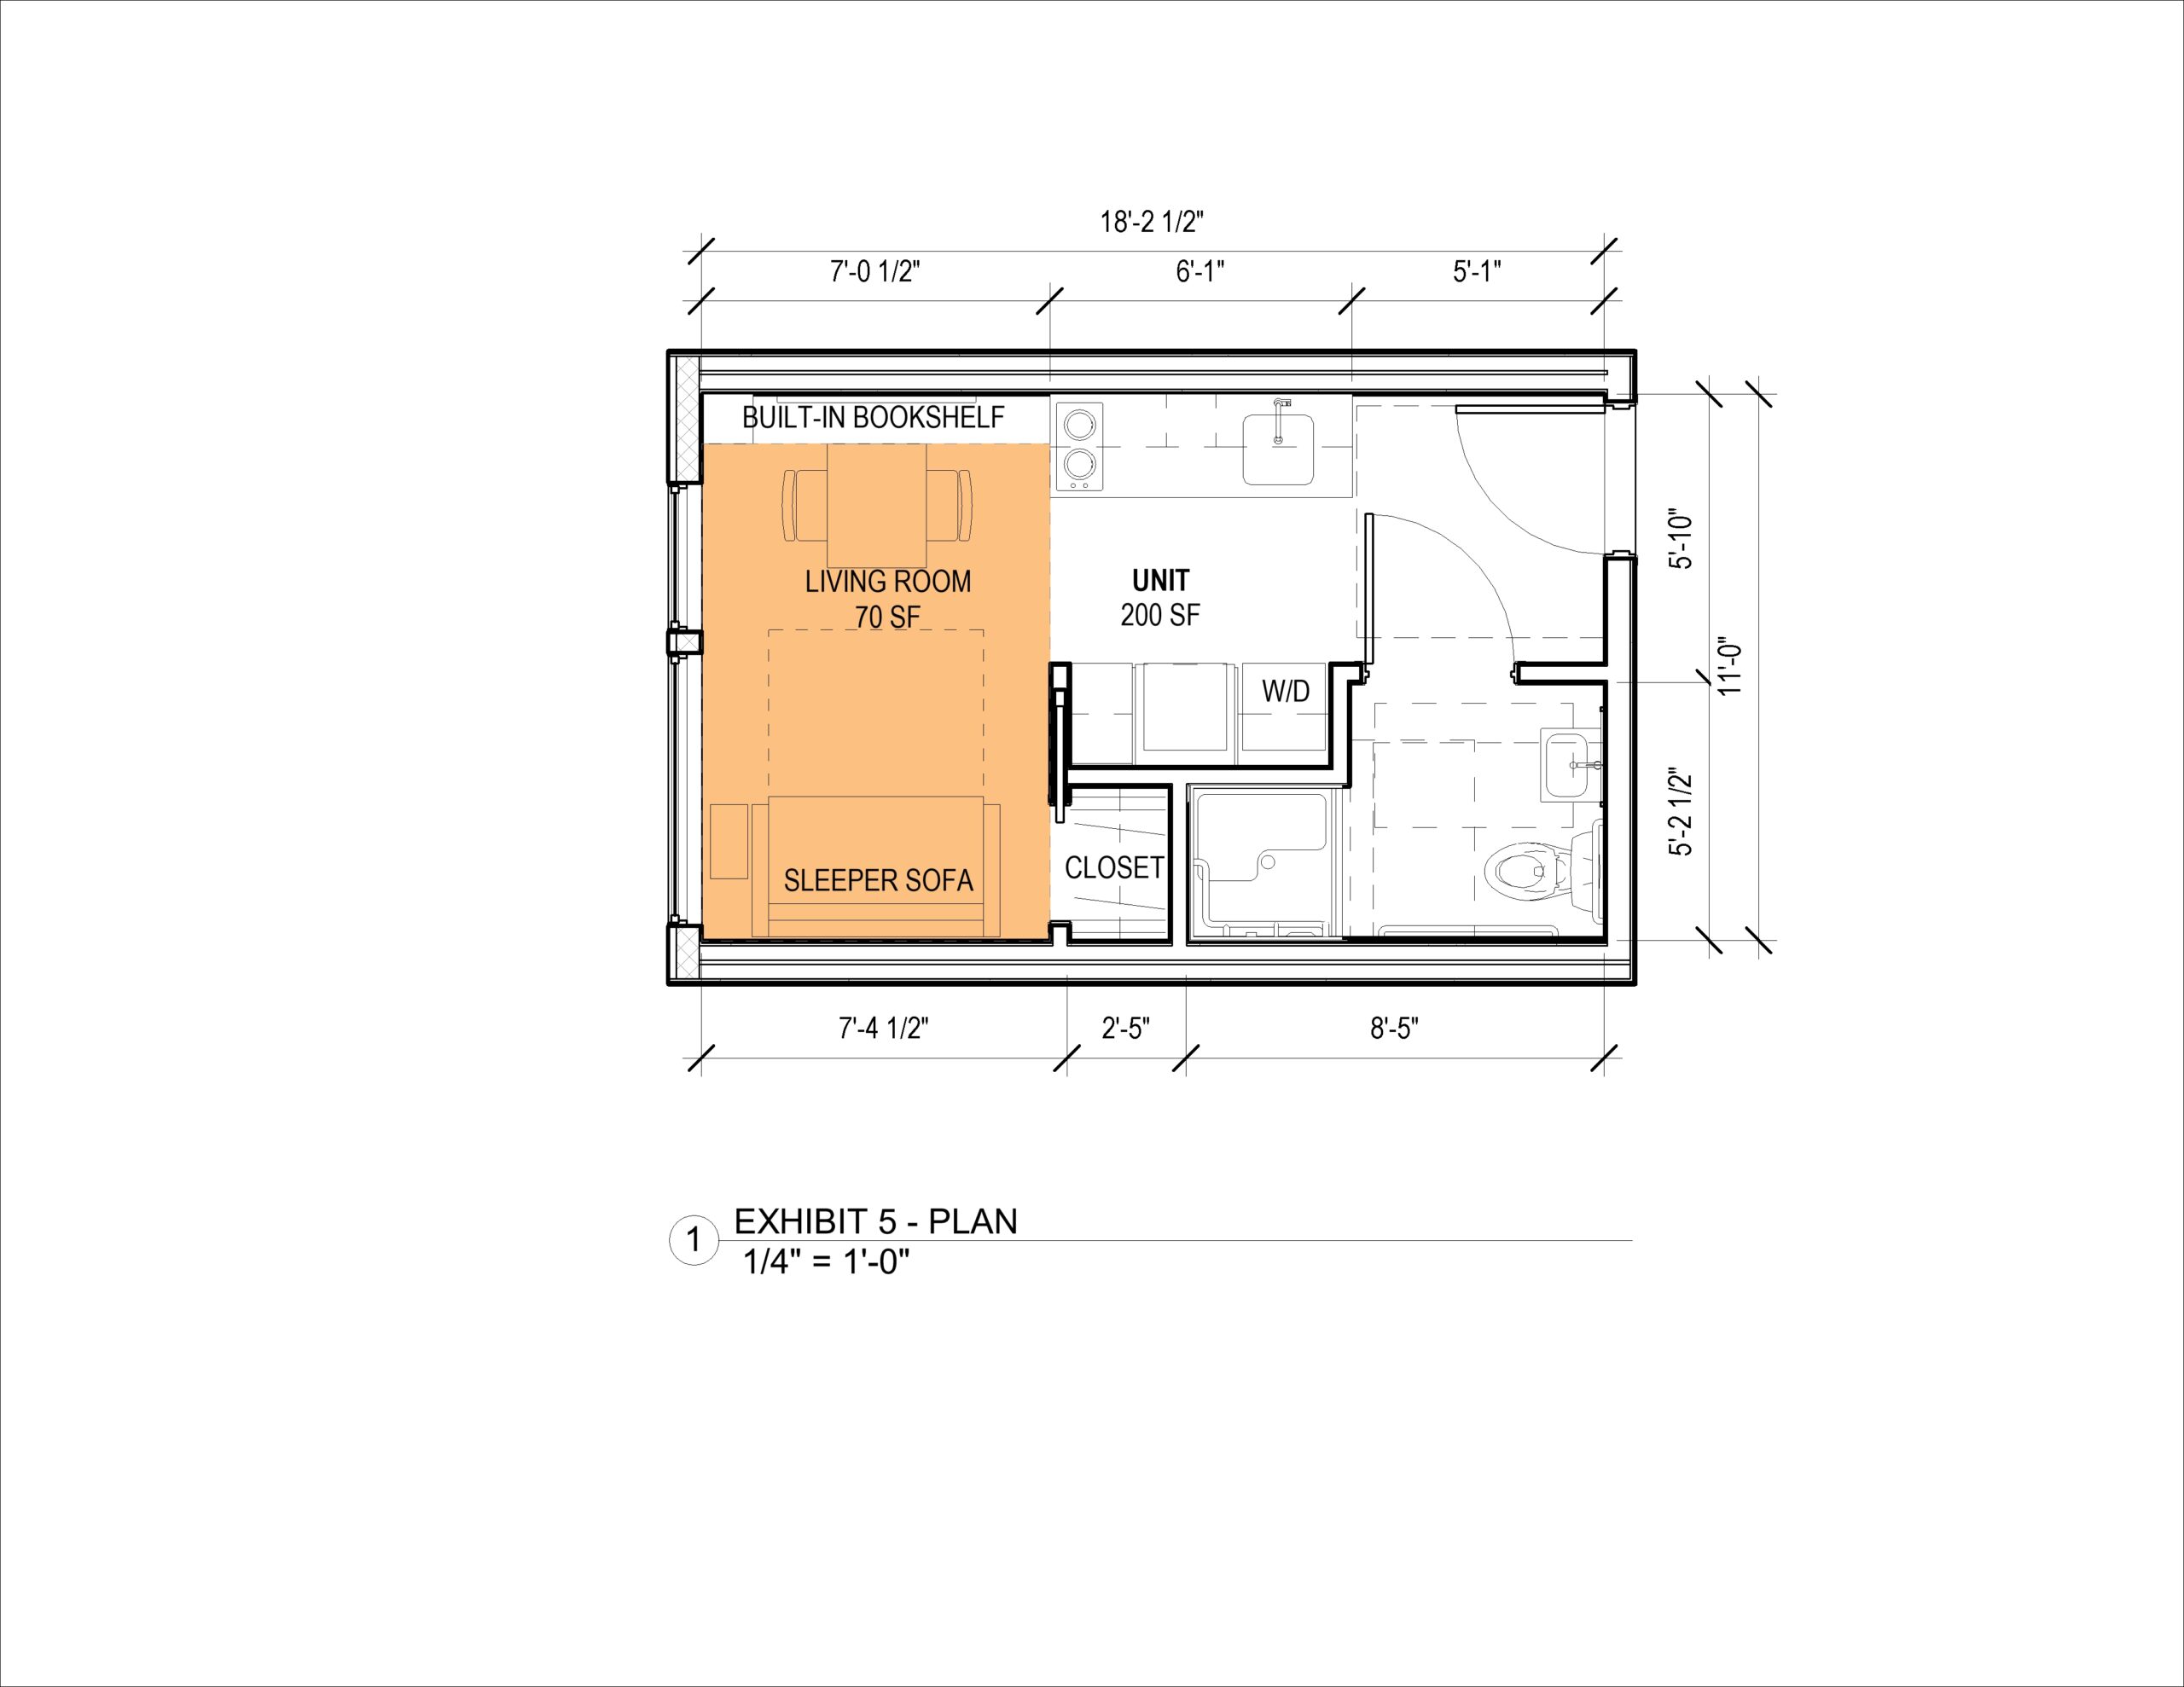
Figure 5: A 200-square-foot micro-home with a 70-square-foot living room boasts more kitchen and storage space, plus a handy built-in bookshelf, all compliant with the National Healthy Housing Standard. Image by Neiman Taber Architects.

The NHHS says that the minimum habitable space for a dwelling unit’s living room is 70 square feet. So let’s look at what that accomplishes in terms of the overall unit size and layout 

We’ve kept a similar suite of amenities in the kitchen and bathroom as the prior design, meaning more kitchen countertop and storage, plus a washer-dryer. And with only 70 square feet of living room area, there’s still enough room for a sleeper sofa and dining table, plus we’ve increased the functional use of the room with a built-in bookshelf. It’s cozier than the versions with larger living rooms but still a functional home that serves a person’s basic needs well and comfortably. The overall size of this unit comes out to just over 200 square feet. 

Policymakers should prioritize livability and an abundance of housing options 

The IBC standards that we use today to regulate small unit housing are clearly counterproductive. They prohibit the creation of smaller, more affordable units that could help put a dent in our housing crisis, and they prioritize space over livability, functionality, and cleanliness.  

If lawmakers have concerns about the livability of small units, they should look to the standards of the NHHS for guidance. Current living room requirements have no empirical basis; they make our housing less plentiful and more expensive; and contrary to their intent, they result in less functional housing units with fewer amenities. It’s possible to make desirable homes for people far smaller than the size required by the IBC. The options we illustrated work well down to about 200 square feet.  

It’s possible to go even smaller. In our congregate housing projects, units can be as small as 120-150 square feet when the building also provides common kitchen, dining, and other amenities that supplement the private units. This illustrates a larger point, which is that beyond the basics, the specific features of the private unit are often less important than the quality of the environment in which they are situated. 

Likewise, micro-homes work best in neighborhoods that provide residents with easy access to amenities such as parks, grocery stores, libraries, schools, restaurants, retail, and services.  

Policymakers can unlock housing opportunities for thousands more people in Washington and across Cascadia by amending our state building code to reduce the minimum living room size, allowing builders throughout Washington to create plentiful, affordable homes for their communities.  


Recent Reforms Could Make a Real Neighborhood of Downtown Anchorage

Find audio versions of Sightline articles on any of your favorite podcast platforms, including Spotify, Google, and Apple.

Anchorage is exceptional. You can be neighbors with moose and see the aurora from your deck. But on housing policy, Anchorage conforms to the Anytown, USA model of zoning rules that stock neighborhoods with a generic product: suburban one-unit homes. The intentions behind the code weren’t necessarily nefarious, but the effects certainly are. Anchorage zoning code limits market choice, contributing to a shortage of homes across the price spectrum, and weakens Alaskans’ spending power by flooding the state’s economic hub with the priciest of housing types.

The severity of Anchorage’s housing shortage has brought Anchorage’s conservative mayor and majority-progressive Assembly into agreement on reforms to help expand housing choice. In the past year, they have made accessory dwelling units easier to build, repealed parking mandates, which can block housing and business development, and introduced a potentially game-changing rezoning ordinance that put a spotlight on the concept of middle housing. In a unanimous vote in April, the Assembly updated downtown zoning code to encourage more housing development on the acres of parking lots and other underused properties in the city center.

The downtown reforms were a necessary step toward unlocking millions of square feet for housing and the businesses that support car-optional downtown neighborhoods. Adding more units downtown could help stabilize prices city-wide, provide more apartment-style living options, and achieve the city’s longtime goal of keeping downtown’s vibrant summer economy alive year-round. Downtown businesses need customers after the tourists leave in the fall. With remote work likely here to stay, Anchorage’s office workers aren’t enough. The only way to create a permanent pool of customers is to turn downtown into a place for locals to live.

Scant housing in Anchorage’s “most desirable neighborhood”

Most Anchorage residents live in suburban neighborhoods that look like countless others across America. But many would happily move to a more urban setting if the market produced the type of housing they truly preferred. Household sizes have shrunk in the last two decades, both in Anchorage and nationwide, and cross-generational competition for more compact housing is fierce. A downtown flat can fit the lifestyles and budgets of these smaller households—empty nesters, retirees, young professionals, and single parents—better than an overlarge single-unit home. In a 2018 Anchorage Economic Development Corporation housing survey, nearly one-third of 1,110 respondents ranked downtown as one of their top three neighborhoods. The city’s Downtown District Plan calls it “the most desirable neighborhood in Anchorage.”

There’s a huge disconnect between demand and supply. Between 2000 and 2020, the share of one- and two-person households in Anchorage grew. At the same time, the share of households with three or more people shrank. And yet, Anchorage’s housing market prioritizes the one-unit-per-lot model—the largest, most expensive housing type. In 2000, 46 percent of occupied homes were single detached houses. Twenty years later, the market share of these houses had swelled to 58 percent. Adding more housing units downtown can help correct the imbalance in the market.

Existing housing units in downtown Anchorage (Image Credit: Municipality of Anchorage, Anchorage Downtown District Plan 2021)

Existing housing units in downtown Anchorage (Image Credit: Municipality of Anchorage, Anchorage Downtown District Plan 2021)

Only 614 units exist in the downtown core, according to municipal data. In producing its 2021 Downtown District Plan, the city began exploring ways to add another 1,400 housing units and envision what they might look like. But the architecture firm contracted to produce renderings depicting the Plan’s vision for new housing downtown came back with bad news. The city’s own zoning code, written years earlier, discouraged attractive, modern residential developments.

“They hired us to do the renderings, and we found we couldn’t accurately portray the vision in a way that was true to what was possible according to Title 21 code because a lot of these newer residential building types the plan called for downtown were not allowed,” said Mélisa Babb, a landscape architect who managed the project for architecture and design firm Bettisworth North. “We kept having to come back and say, ‘Well, you can’t build that nice new tower because we can’t do residential like that downtown.’”

Concept illustration of a mixed-use corner block of homes

This block of homes would have been illegal before the Anchorage Assembly unanimously passed downtown zoning code revisions in April 2023.

This realization gave rise to reforms for the three zoning districts that make up downtown, roughly bordered by K Street, 9th Avenue, Gambell Street, and the Ship Creek industrial area. Among the changes:

  • Expands the list of businesses and institutions allowed to operate downtown
  • Bans new surface parking lots
  • Adds flexibility to design constraints or gets rid of them entirely

Changes to land use rules alone won’t lead to abundant housing downtown, but they are a low-cost way for the city to remove obvious regulatory barriers. These and other zoning reforms are part of a larger suite of support for downtown housing that could include financing and tax incentives, as well as public spending on sidewalks, lighting, and safe options for non-motorized and public transit.

Bans on convenience stores and other businesses lifted

Walkable neighborhoods have huge appeal for people who envision themselves living downtown. Across the country, neighborhoods with high walk scores command premium prices because demand for walkable neighborhoods exceeds supply. They require, among other features, the close proximity of housing with key businesses and services. But in Anchorage, downtown caters primarily to visitors and office workers. Without a critical mass of residents, the businesses essential to everyday life are rare to nonexistent. Eateries, bars, and retailers abound, but some shut down or shorten their hours when customer traffic dwindles outside tourist season. Downtown Anchorage has two convention centers and plenty of coffee shops but no grocery store. It has a half-dozen cannabis retailers but no pharmacy.

Downtown Anchorage has two convention centers and plenty of coffee shops but no grocery store. It has a half dozen cannabis retailers but no pharmacy.


Tweet This

The recent round of code reforms lifted prohibitions on businesses that would support residential life downtown, such as convenience stores, veterinary clinics, and community centers. Other newly allowed institutions include an aquarium, school and university facilities, and pet boarding. The reforms also eased restrictions on small libraries.

“All these things were not allowed,” Babb said. “It’s invisible. You’re not going to see the difference until people open new businesses.”

The code changes alone won’t be enough to actually bring these new businesses downtown, but they do remove a major barrier. For example, the University of Alaska Anchorage now has the option to move offices or entire academic programs to city center, just as other universities have elsewhere. Adding student housing downtown would drive growth for existing businesses and perhaps attract others.

Convenience store owners should have an easier time now that their businesses are no longer prohibited. Proprietors have long used a loophole that classified them as restaurants as long as they sold food prepared on-site (which explains why you can get a chowder to-go and lip balm at that place on 4th Avenue). The reforms give them the option to jettison their commercial-grade kitchens and focus on selling snacks, band-aids, and beverages.

A much more diverse ecosystem of retail, services, and eateries would bring about more consumer choice, support neighborhood cohesion, and lay the groundwork for residents to leave their cars at home. Crucially, the city would need to work with the state to make downtown, including 5th and 6th Avenues, more bike and walker-friendly, while still accommodating motor vehicles. These and other changes can make downtown Anchorage living accessible to more people who don’t own a personal vehicle, want to minimize time spent in a car, or can’t drive for medical reasons. Pro-driving die-hards should likewise support safe alternative transit, like the city’s protected bike lane pilot projects. Fewer drivers mean less traffic and more available parking spots for them.

As a recent Brookings Institution report noted, “Ironically, an American economy that prides itself on consumer choice offers less transportation choice than our global peers.” By allowing more types of businesses downtown, Anchorage has moved an increment closer to transit diversity.

Surface parking lots banned

Surface parking lots encase huge swaths of downtown, turning some of the most valuable property in Anchorage into urban dead zones. Instead of millions of square feet of housing, boutique hotels, or cool restaurants generating the property taxes Anchorage relies on to function, the city center hosts acres of asphalt deserts. To slow the creep of this wholly inefficient use of land, the Assembly banned all new surface lots. (New multilevel parking structures are still allowed since they use land more efficiently.)

The search for parking downtown can be a minor hassle, but not for lack of spots. It’s just that most drivers (myself included) want a cheap spot on the street. The truth is that excess parking riddles the city, especially downtown. A 2007 study by the Anchorage Community Development Authority found that at peak downtown drive times, 5,445 parking spaces went unused. Driving tends to rise and fall with economic activity. With the 2023 economy slower than it was in 2007, the number of empty spots is plausibly even larger now, according to an analysis in the 2021 Downtown District Plan.

The city calculated that the unused spaces represent about 1.5 million square feet of “at grade” development (meaning just one story)—and that doesn’t count the multiple stories that could have been built above those spaces. With property taxes as the municipality’s main revenue source, the underutilized space represents a loss in funding opportunities for additional services and public infrastructure investments. But it also represents future opportunities for growth and improvement.

Surface parking bans aren’t common, but Anchorage isn’t alone. Last year Cincinnati instituted a temporary ban on new surface parking lots downtown. Its city council votes this year on whether to extend the ban in the urban core.

Pink highlights showing buildable lots in downtown Anchorage. Most of the highlighted lots host surface parking. (Image Credit: Municipality of Anchorage, Anchorage Downtown District Plan 2021)

Pink highlights showing buildable lots in downtown Anchorage. Most of the highlighted lots host surface parking. (Image Credit: Municipality of Anchorage, Anchorage Downtown District Plan 2021)

Surface lots are lucrative and relatively cheap to maintain, giving owners little incentive to sell at prices that would make an urban residential project pencil out. The rates that lot owners charge for parking essentially cover the minimal property taxes they pay, giving them a way to wait out the market while generating income on an otherwise vacant property.

Instead of millions of square feet of housing, boutique hotels, or cool restaurants generating the property taxes Anchorage relies on to function, the city center hosts acres of asphalt deserts


Tweet This

“A lot of the larger parking lots downtown are owned by out-of-state operators,” said Anchorage Assembly member Daniel Volland. “They can essentially sit on that land while everything else is improved around them. And the property value goes up over time, and they can sell it for a big reward.”

Volland said that moving the downtown core away from being a giant parking lot will require additional policy tools. For example, the city could establish a stormwater utility funded by fees on the impermeable surface of the land. A grass lot with natural drainage would incur lower fees than a parking lot whose runoff would enter city storm drains.

A split-rate property tax, where the tax on the land itself is more heavily weighted than the building, is another idea for incentivizing surface parking lot owners to improve their property. Volland floated the idea of a land value tax that also provided residential property owners some relief.

The city for decades didn’t force developers or landowners to provide a defined number of spots for vehicles downtown, though it did for the rest of the city, at least until last year. And yet the problem of excess parking is arguably worse downtown than in any other part of Anchorage. The zoning code’s so-called “bonus table” for downtown incentivized parking by allowing developers to add more square footage to buildings but only if they added more parking or other features. As part of the reforms, the Assembly got rid of the bonus table, too.

Lowering the hidden dimensional barriers

The Assembly also modified the rules dictating the size, shape, and spacing of lots and buildings. Known as “dimensional standards,” these arcane columns of numbers in a typical zoning code determine a city’s beauty and livability (or ugliness and un-livability, depending on your viewpoint). Let’s say a developer wants to turn a giant parking lot into apartments with a convenience store and restaurant on the ground floor. Dimensional standards that require a setback, or buffer zone between the sidewalk and the edge of the building or between buildings, could add significant costs to the project.

The Assembly also modified dimensional standards downtown by

  • Reducing front, rear, and side setbacks to zero and allowing buildings to cover 100 percent of a lot, giving neighborhoods like Ted Lasso’s in London a chance to take root in Anchorage; and
  • Getting rid of rules that set minimums for lot sizes and lot widths in all three downtown zones, giving property owners the flexibility to pursue a wider range of building shapes and sizes, like Rue Wellington in Montreal.

Federal height limits related to Merrill Field, the nearby municipal airport, still apply, and range from about 260 feet on the east side of downtown, gradually increasing to 480 feet on the western edge. But apartment buildings reaching those heights are unlikely in the near future. The Assembly added de facto height restrictions in the form of building step-backs, where floors above a certain height must be set back a certain distance from the edge of the building. In the central business district, the step-back rule kicks in at 112 feet, or about 10 stories. Building step-backs add to construction costs and may discourage builders from exceeding the height at which the requirement applies. No complaints here, though. A 10-story apartment building in downtown would add a significant percentage of housing to the area. The iconic Haussmann apartment buildings of Paris max out at 66 feet and none exceed six stories.

A downtown that’s everything to everyone all at once

Alaska communities and other tourist destinations often reserve the best of themselves for visitors. By opening downtown to more residents, the city can share the neighborhood with locals while continuing to accommodate tourists and the rest of us in Anchorage who are by turns office workers, theater-goers, bar-hoppers, restaurant patrons, and recreationalists. But in creating a downtown for residents, the city shouldn’t lose sight of what makes it work for visitors. Tourists flock to destinations, like cruise ships and Disneyland, that offer a large chunk of Maslow’s hierarchy of needs within walking distance. Ideally, downtown would provide the same all-inclusive resort convenience for its residents, along with everything else people appreciate whether or not they’re wearing their tourist hats: safe, clean streets, low vehicle traffic, public art, beautiful outdoor places to people-watch and socialize, and a strong sense of exactly where they are.  

Learning from the Least Housed

Find audio versions of Sightline articles on any of your favorite podcast platforms, including Spotify, Google, and Apple.

Governments rule and fund from the center, and markets typically build for the top down. How, then, do those on unserved fringes adapt and house themselves? 

To find out, look around. As Cascadians scramble for solutions to our housing crises, we could all gain some new ideas by observing the innovations of those already on the edges. 

For the last decade I have taken a deep interest in—and it has taken me into—researching and living on the housing periphery. I’ve lived in warehouses, across a wide archipelago of house-sits and couch-surfs, and on rural sojourns off grid. I’ve lived in backyards, houseless villages, parking spaces, and prototype structures and vehicles. Living on these ever-shifting social shorelines, I am increasingly convinced that if we are all to survive and thrive, we must let the edges teach us.  

Living in more “makeshift” housing has taught me to make and shift my own ways of living. It’s about playing the cards in hand, deftly. Surprisingly often, I discover unexpected ways it sharpens my game: I’ve learned that sleeping under a cloth roof gives me soft illumination in the morning and an energetic wake-up. I’ve learned that hot water bottles aren’t merely more efficient than hot air; they’re also cozier. 

Cascadian housing policy can sharpen its game, too. Drawn from my experiences and research, I’ll discuss here three related housing approaches for radical agility and affordability. 

  1. Create evolvable housing, not temporary shelter: “New Starter Homes” 
  2. Facilitate self-building: Let people define, design for, and build for their own needs
  3. Roll out the ultimate scalable infill: The “Wheeler House” vehicle dwelling

1) Create evolvable housing, not temporary shelter: “New Starter Homes” 


Three eclectically designed tiny houses on wheels sit around a courtyard covered by a sun shade, atop a large smooth concrete slab that features painted polka dots, chairs and tables.

Choose your habitat. Above: Custom tiny houses at former Caravan Tiny House Hotel, 2021, photo by Tiny House Expedition, used with permission. Below: “Pallet Shelter” brand pods for homeless people in Portland, photo by Tim McCormick, 2020.

Village of "pod" homes with a city in the background
In recent years, US governments have invested a lot of money and focus in “pods” (temporary, free-standing, typically pre-fab structures) for unhoused people. In many cases, I believe, a better response would be quickly available housing that can evolve into permanent housing. 
 

A recurring priority in disaster and homelessness response is reconnecting people with a regular, sustainable life as soon as possible, minimizing limbo. That sense of living in suspension, including the use of temporary housing forms, can inhibit recovery and redevelopment. Ian Davis’s 1978 classic, Shelter After Disaster, argued this point, and it’s a key part of the “Housing First” homelessness response philosophy.  

A “sustainable life,” however, is not the same as getting to a permanent situation, conventional housing, or restoring the former state of someone’s affairs. Placement into something termed “permanent” might not be someone’s goal, could prove a dead end, or could soon become unsuited to a person’s or family’s evolving needs.  

Instead, to rebuild lives, people need to see they are on a sustainable path, one on which they can step forward and self-determine rather than dwell in stasis or feel themselves as just a service recipient. People also generally want options to stay in, design, build, adapt, expand, and control or own their own homes. By contrast, pods and leased motel rooms don’t offer long-term and self-determined paths, nor is it sustainable to “reintegrate” people into conventional housing they can’t see a path towards affording. 

So, what exactly are pod shelter sites usually missing? A direct, self-determining path to sustainable housing. Pod structures are typically temporary and non-durable, and residents aren’t allowed to stay on. Even the site itself is usually only temporarily permitted and planned for its location, even as subsequent housing options are by no means assured. Sites are also typically run by organizations that don’t themselves provide long-term housing. Likewise, as recently reported by The Oregonian, other common approaches such as rent assistance and hotel or motel stays often come with looming deadlines but no visible path to stability. 

Applying this idea of creating direct paths of adaptation rather than interim states, I propose the “portable affordable dwelling,” or PAD, as an alternative to the now-pervasive pod. Or we might adapt a phrase from the real estate industry and call it the “new starter home.” 

In this model, multiple levels of government, advocacy, design, and local communities variously collaborate to develop fast but evolvable, creative housing approaches. These could include portable homes that eventually become cottages in a backyard or cottage cluster—“the food cart of housing,” as I put it to Portland City Council last spring. Relatedly, a site itself, or the micro-community it hosts, might evolve from an outdoor shelter site into cottage cluster housing, a resident-owned mobile home park, or even a Baugruppe-type, resident-run co-op building.  

Developing housing in stages is common practice in the developing and more recently developed world, such as Chile’s “half-a-house” concept, which prioritizes a basic, high-quality structure that can be expanded later if the owner chooses. I saw a similar approach in action this year while living and working on the site of a Portland nonprofit, Cascadia Clusters, which develops alternative housing forms. “New sites offering outdoor alternative shelter in Portland should be allowed to evolve into sites that have more permanent structures,” its director told a local TV station earlier this year.

2) Facilitate self-building: Let people define, design for, and build for their own needs

A disassemble-able pop-up frame for an 8’x10’ cottage.
The pop-up with a shed roof and sleeping loft, and fabric shell and bracing being added.

One of the key lessons policymakers can learn from alternatively housed neighbors is that people can and do build for ourselves, if allowed. For example, I recently built a lightweight, small cottage prototype for myself, in just a few days (shown under construction above), using “grid beam” DIY building methods. My beams are the same reusable, square, perforated steel tubing used for street signs all over Portland. The “Summer Pavilion,” as I have called this prototype, serves me now as a workspace and trailer-port.  

Most housing professionals might see a laughable plaything. To my beginner’s mind, though, the Pavilion offers many possibilities and fits my present needs. I designed it as an agile, immediate, small home that, if I choose, can later be upbuilt into a more substantial, permanent, year-round home. I can add rooms to it, such as a kitchen and bathroom, or I can place it inside an existing room or building, to efficiently and flexibly offer its modular storage, sleeping platform, and desk/table. And because I can disassemble and reassemble the Pavilion as I like, I can put it in storage for a time or relocate it to stand as a backyard ADU, part of a village cluster, or even a rural off-grid cabin. 

For me, this upbuild-able, disassemble-able, highly portable home is appealing, appropriate, and empowering—even joyful in a way. A self-built cabin like this indeed feels in some ways more fit and helpful to me than being handed keys and placed into the gold-standard, capital-A Affordable Housing solution: a new, subsidized, permanent apartment.  

What’s more, the Pavilion uses just $500 in reusable materials, where the apartment costs about $500,000. But the law and our affordable housing practices, in their majestic equality, disdain homes like my Pavilion as “substandard.” They instead uphold human dignity by offering one lucky person a mayoral-class apartment. The ninety-nine others who are unhoused are offered only hope.  

So, prioritizing both affordability and self-determined paths to stability, I would offer such housing kits to unhoused neighbors along with support to legally site and upbuild them. Such lightweight but capable housing is suited, I believe, to many people who need and want fluid, low-cost dwellings. To adapt that quote about fishing: Give a person a house, and you house them for now. Teach them to house themselves, and you house them for life.  

3) Roll out the ultimate scalable infill: The Wheeler House vehicle-drawn dwelling 

Have I successfully rattled any conventional American middle-class housing ideals yet? Well, let’s move on to what I’ll call the Wheeler House. 

A 2016 prototype of the Wheeler House.

Less palatial than the 8’x10’ Summer Pavilion, this dwelling easily mounts on a 5’x8’ car trailer. In roof-down position, it appears to be a small tool or storage trailer about the height and length of a sedan. 

The Wheeler House can park in a driveway, street space, or garage, yet also has sleeping and work space, a hinge-up roof, and a pop-out patio or deck. It also includes standing height inside, wash and shower space, and a composting toilet.  

Sketch dimensions of a wheeler house concept

Sketch by Tim McCormick

Wheeler Houses don’t need to stand alone. One or more could be used as movable work or sleeping spaces that are components in a larger dwelling compound. They can also offer versatile private, focus, or refuge spaces amid a larger village or co-housing context with shared facilities. Under Portland’s current zoning, a Wheeler House can also legally be used as a detached bedroom or an accessory structure in a backyard. 

Another case where a Wheeler House might be rather handy is after, say, a massive Cascadia earthquake, if your home is gone or uninhabitable. A dwelling that’s secure, off-grid, and pullable by two people by hand or one on bicycle might be useful once the region’s petro-industrial complex has collapsed and gasoline and utilities are unavailable. In the meantime, you could have yourself a nice backyard studio, guest room, or fun micro-trailer to take down to the coast occasionally. Plus, perhaps you could house someone in need in your driveway. 

That brings me to another possible use for the Wheeler House: dismantling homelessness. In Portland in July 2023, a new citywide camping ban made the habitations of thousands of the poorest Portlanders likely illegal. These residents became subject to citation and jail sentences overnight, even as it remains legally contested how this policy could be compliant with Federal court rulings and with Oregon law HB 3115, which require shelter or accessible space to be reasonably available.   

Many argue, persuasively, that a lot of unsheltered people will not voluntarily go to today’s city-run shelters or don’t consider them reasonably available. This may be due to issues including inconvenient location, trauma from previous shelter experiences, restrictions on schedules or cohabitation, and prohibition of pets, possessions, and vehicles.  

Sketch of a simple wheeler house design

Sketch by Tim McCormick

Basic-variant Wheeler Houses, including provisioning the trailer base and vehicle registration, could rapidly house hundreds or thousands of people for about $2,000 each. This would be a quickly deployable, customizable, and evolvable alternative to street tent camping or residence in broken-down vehicles parked on city streets. A complementing “Parking-Dwelling Permit” system could help manage allowed locations, vehicles, services such as garbage and waste, and good neighbor agreements.  

Radical? Yes. But planners and housers are gradually coming around to seeing more legitimate possibilities in mobile dwellings. For more on such designs’ historical, cultural, and legal contexts, see my talk at the 2022 National Vehicle Residency Summit, “Vehicles as Housing, Housing as Vehicle.” 

Dynamic housing for open futures 

Marginally housed people like me know that there is loads of available space in the world. In North America, that is often thanks to sprawling and fractured urbanscapes, overbuilt parking lots, giant roadways, big houses, and little-used yards. 

Our main obstacle in this crisis isn’t a lack of space. It’s our own shackled thinking. Paraphrasing Hamlet: we could be kings of infinite space, were it not that we dream poorly.  

We need to challenge cultural assumptions that land use and buildings and housing placement must be permanent—that is, fixed in place and forever after—in order to be legitimate. This way of thinking, and the land use rules enforcing it, freeze up vast space and potential, often enshrining waste, disuse, and inequity. We urgently need to be building our lives, our homes, and our cities for permanent adaptability. 

We don’t really need to suffer the endless thirst of scarcity, nor allow for so many the misery of unsheltered homelessness, when we live in this ocean of space. We all just need, at a given time, a place or two that suits us, fitting our diverse lives, needs, priorities, and preferences. There are ample ways for all of us and all of them, if we can open our eyes, imaginations, hearts, and policies and allow building from the bottom up. 

Who Will Pay for Cascadia’s Transmission Lines?

Find audio versions of Sightline articles on any of your favorite podcast platforms, including Spotify, Google, and Apple.

Editor’s note: This is the second of three articles discussing the major challenges—planning, paying for it, and permitting—to building the transmission lines needed to transition to a cleaner energy future. 

Transmission lines cost a pretty penny. Take for example the only new regional transmission project that will break ground in the Northwest anytime soon. Idaho Power and PacifiCorp’s 290-mile Boardman to Hemingway line will cost more than $4 million per mile, for a total of $1.2 billion. And that’s hardly the steepest line in the works in the United States right now; developers anticipate footing multibillion-dollar bills for several large transmission projects outside Cascadia.1This article and series focus on transmission capacity just in the US portion of Cascadia, given the fundamental differences between American and Canadian electricity systems and grids.
 

Most incumbent transmission developers in the Northwest, namely the Bonneville Power Administration (BPA) and investor-owned utilities (IOUs), balk at building projects sporting these price tags.2Investor-owned utilities are private, for-profit utilities owned by shareholders, including Puget Sound Energy, Portland General Electric, and PacifiCorp.
BPA shies away from large investments that would require it to raise rates on its public power customers and assume additional federal debt. And most IOUs fear tying up billions of dollars for years or even decades only to risk state regulators ultimately not allowing them to recoup their investment. As a result, neither BPA nor IOUs are investing in the grid infrastructure Cascadia desperately needs to decarbonize. 

But if building transmission lines is expensive, not building them is exorbitant. Total decarbonization costs could rise by up to $13 billion if the Northwest does not expand transmission capacity. And unless Cascadia builds a grid that can support the end of climate-destroying fossil fuels, we will pay the highest price of all in the form of more devastating wildfires, oppressive heatwaves, and dangerous droughts. 

All Northwest leaders can help untangle the financial impediments to building new lines. Washington senator Maria Cantwell and the Northwest congressional delegation can pressure BPA to deploy more low-cost federal debt to the cause. The Oregon and Washington state legislatures can set up state entities to partner with private non-utility transmission developers. Oregon governor Tina Kotek and Washington governor Jay Inslee can initiate the development of a multistate cost allocation agreement to offer IOUs greater assurance that they will earn back their transmission investments. The best and least expensive options are those that leverage low-cost public financing so as to maintain to the extent possible the Northwest’s relatively low electricity prices. Still, given the dire urgency of the climate crisis, all options are worth pursuing. Otherwise, Cascadians will be left holding the bag, coughing up for expensive and inefficient infrastructure projects while the planet burns. 

BPA’s priorities: Low debt, low rates, few builds 

BPA is, as Sightline has written about extensively, the Northwest’s transmission giant. And it looks flush with cash to pay for new wires: it has only tapped $5.7 billion of the $17.7 billion Congress authorizes it to borrow from the US Department of the Treasury.3The 2021 Infrastructure Investment and Jobs Act increased BPA’s federal borrowing authority from $7.7 billion to $17.7 billion. Of the $10 billion increase, $4 billion will not be available until 2028. BPA has tapped $5.7 billion as of September 2022.
 

But BPA doesn’t see it that way. Understanding why requires looking back at the agency’s foundational statutes, which direct it to sell power from US government dams on the Columbia River to “public bodies and cooperatives” at “the lowest possible rates.” These “preference customers,” as they are known, include municipal utilities like Seattle City Light, public utility districts (PUDs) like Snohomish County PUD, consumer-owned cooperatives like Umatilla Electric Cooperative, and tribal utilities like Yakama Power. Just as these preference customers depend on BPA for power and transmission service, so too does BPA depend on them. US federal statute requires BPA to recover its costs, including debt repayment and interest, by selling power and transmission service; BPA does not receive annual Congressional appropriations. As of 2022, a full three-quarters of BPA’s operating revenue came from selling power, primarily to the agency’s preference customers. 

In other words, if BPA were to reach further into its deep pockets to build a few multibillion-dollar transmission lines, it would need to pay back its federal loans by raising rates on its customers. And BPA has given no indication it is willing to do this. In fact, BPA’s 2022 financial plan emphasizes the opposite: maintaining low rates, reducing interest expenses, and lowering its debt-to-asset ratio. The agency’s financial challenges in the late 1990s and early 2000s, which included a precipitous drop in BPA’s cash reserves and concern that it would not be able to repay its US Treasury debt, likely contribute to the agency’s skittishness. 

As a result, BPA places most of the financial risk for new transmission projects onto renewable developers that need BPA’s grid to zap power from solar and wind farms to homes and businesses across the Northwest. BPA’s requirements, including that developers post a security deposit or letter of credit to cover the cost of a transmission upgrade or new line until it is up and running, can be too high a hurdle for some developers to clear. And when no one wants to foot the bill, nothing gets built. 

Then there is the contentious issue of whether BPA, to cover the cost of a new project, would raise its transmission rates only on the developer(s) that requested the additional grid capacity or on its entire customer base. Some, like the Northwest & Intermountain Power Producers Coalition (NIPPC), which represents the region’s independent renewable developers, argue that raising rates only on developers “can be a kiss of death” for their solar or wind projects. Plus, NIPPC contends, doing so ignores the broad benefits that new transmission provides to all BPA customers. Others disagree.  

“Why should a public facility pay for a transmission upgrade that is designed to help one private entity provide power to another private entity?” asked Nicolas Garcia, policy director for the Washington Public Utility Districts Association (WPUDA), in a conversation with Sightline. He argues that since BPA’s preference customers already rely almost entirely on carbon-free electricity from BPA’s hydropower resources, they shouldn’t pay for grid upgrades, the purpose of which is to help IOUs clean up their power sources.  

Still, appetite among BPA’s preference customers to see the agency invest in more transmission wires may be growing. Garcia acknowledges the need for more transmission capacity, especially across the Cascade mountain range. Lauren Tenney Denison, director of Market Policy & Grid Strategy at Portland-based Public Power Council (PPC), a membership group that includes BPA’s preference customers, echoed the sentiment. While traditionally raising transmission rates “has been a huge concern” for PPC’s members, she told Sightline, she sees interest growing in getting new projects built. 

In sum, BPA is sitting on billions of dollars of federally financed debt. But despite enjoying the statutory authority to tap this money and construct new wires, BPA approaches this essential climate strategy with wariness and trepidation. And IOUs, which own most of the rest of the region’s grid, aren’t hankering to pay for new large lines, either. 

IOUs make an easier buck on small, local projects than on regional transmission lines 

IOUs only profit by investing in new infrastructure. In theory, then, building pricey transmission lines should look like a sweet deal to them. But in practice, most IOUs consider transmission lines, especially large regional ones, too risky for four main reasons: 

A. Transmission lines take longer for IOUs to build and recoup costs on than other infrastructure projects.

While a new solar or wind farm might take around five years to get up and running, transmission projects can drag on for 10 or even 20 years, primarily due to lengthy siting and permitting processes.4 For example, see several timelines for Washington renewable projects.
Idaho Power and PacifiCorp first proposed the Boardman to Hemingway line almost 20 years ago, and it still hasn’t broken ground. 

“No certainty for 15 years is unacceptable for a utility business,” Mitch Colburn, vice president of Planning, Engineering, and Construction at Idaho Power, told Sightline. “Our shareholders don’t want us to take big risks.” 

These delays matter because IOUs cannot recoup their investment in transmission lines through state-approved electricity rate increases until the line is “used and useful” to ratepayers. And if the utility ends up having to cancel a project before completing it, the company will have to eat any costs it already spent. Such was the case with Portland General Electric’s (PGE) Cascade Crossing transmission project, which would have carried power across the Cascade mountains, now a heavily congested route. After opposition from BPA, which argued that the line was unnecessary, PGE canceled the project in 2013 and lost the $50 million it had already spent.5According to a Sightline interview with a representative from Portland General Electric.
The utility has not proposed a major transmission line in the decade since. 

B. IOUs worry that state regulators may not allow them to recover transmission project costs through higher rates.

Compounding the timing challenge is that IOUs do not know if state regulators will ultimately allow them to recoup their investments by raising retail rates. 

“The limit is the willingness of state commissions to put more and more projects into rate base,” said Maury Galbraith, executive director of the Colorado Electric Transmission Authority (CETA). And building lines that cross multiple states adds to the challenge.  

“Take a hypothetical transmission project to bring wind from Wyoming to Oregon,” Shaun Foster, transmission strategy manager at PGE, explained. “We could see a scenario where Wyoming regulators don’t allow that.” 

Indeed, this dynamic already plays out in the Northwest. PacifiCorp has developed an agreement for how to allocate its transmission costs (and other costs) across the six states where it operates.6PacifiCorp’s service territory includes parts of California, Idaho, Oregon, Utah, Washington, and Wyoming.
Public utility commissions in all six states must agree to the terms, a process that is “neither clean nor easy,” according to Bob Jenks, executive director of the Oregon Citizens’ Utility Board (CUB), which is party to the agreement. 

C. The sheer cost of transmission lines makes them hard for IOUs to finance.

That transmission lines are billion-dollar or multibillion-dollar projects further exacerbates the timing and regulatory uncertainty IOUs face.  

“Most utilities don’t have the balance sheet to carry a $2 billion transmission line,” Foster said. Indeed, most IOUs in the Northwest have less than $5 billion in long-term debt on their books today; in that context, an additional, say, $1 billion in long-term debt—for a single project that may not pay itself back for at least 10 years—is usually too big a risk to take on.7Source: PSE, PGE, Avista, and Idaho Power Federal Energy Regulatory Commission Form 10-K. Utilities finance capital expenditures through a combination of debt and equity.
  

The major exception again is PacifiCorp, the utility giant owned by billionaire Warren Buffett’s Berkshire Hathaway Energy. It already possesses one of the largest privately held transmission systems in the United States and is investing billions in new transmission projects across the western United States.  

D. IOUs must compete for regional transmission lines, but they enjoy monopolies over local ones.

Finally, large regional transmission projects are unattractive to IOUs because of the different requirements that the Federal Energy Regulatory Commission (FERC) places on them compared with local transmission lines. Since 2011 FERC has required that utilities compete to build regional lines, but it allows them to maintain monopolies over wires in their own service territories. While FERC had intended this rule to spur competition at the regional level, in practice it simply encouraged utilities to forgo regional transmission projects altogether.  

Instead, utilities focus on local transmission projects where there is “no competition to them and they can do anything they want,” explained David Pomerantz, executive director of the Energy and Policy Institute, a nonprofit utility watchdog. FERC is now considering re-granting utilities monopoly rights over regional projects, but many public interest groups argue that this would be a step in the wrong direction.8This is known as the “right of first refusal.”
9See September 19, 2022, public comments under FERC Docket No. RM21-17-000.
An alternative approach could be for FERC to open up competition for local transmission projects.  

As a result of these compounding disincentives, IOUs spend chump change on regional transmission projects. The chart below shows that since 2016, Northwest IOUs have deployed nearly $10 billion in ratepayer money to new generation and distribution projects and just $2 billion to transmission ones.10Distribution lines are low-voltage power lines in neighborhoods that carry electricity to homes and businesses. Transmission lines are long-distance, high-voltage power lines that carry electricity from their source to substations.
The vast majority of these transmission investments are for local projects; PacifiCorp and Idaho Power are the only IOUs in the Northwest proposing any regional transmission lines.11Idaho Power is a co-developer on several of PacifiCorp’s projects, but PacifiCorp is a majority owner.
 

Chart showing the bottleneck of 5 times the amount of projects on generation and distribution than transmission 

Northwest leaders can help break the transmission funding deadlock 

Northwest leaders, from state legislatures to the Northwest congressional delegation, all can play a role to unleash funds for new transmission lines. The best and least expensive options are those that leverage low-cost public financing, whether via BPA or a state-led entity (options 1 and 2 below). But, given the urgency of the climate crisis and the current transmission deadlock, all three strategies outlined below are worth pursuing together. 

1. Washington senators Maria Cantwell and Patty Murray and the Northwest congressional delegation can encourage BPA to assume more low-cost debt.

The least expensive strategy would be for Northwest leaders to pressure BPA to use more of its federal borrowing authority (i.e., take on more debt) to proactively build new lines. Unlike an IOU, BPA has no profit motive, and it has access to some of the lowest-cost financing available. BPA’s weighted average interest rate for its federal debt was 3.1 percent, according to its 2022 annual report; that’s less than half the 7.23 percent that Puget Sound Energy, Washington’s largest IOU, reported as its weighted average cost of capital the same year. Plus, as the largest supplier of electricity in the Northwest, BPA could soften rate impacts by spreading the costs of large transmission projects over a wide swath of customers—something a single utility could not do. 

But encouraging BPA to assume more debt will be no easy task given its stated financial priorities to do essentially the opposite. Changing those priorities will require leadership from the Northwest congressional delegation, which some observers regard as BPA’s informal de facto board of directors. Especially critical would be buy-in from Senator Maria Cantwell, who led the charge to increase BPA’s federal borrowing authority by $10 billion and recently applauded BPA’s decision to take steps toward $2 billion worth of transmission improvements. 

2. The Oregon and Washington legislatures can create state entities to partner with non-utility transmission developers.

In parallel, Northwest legislators could establish state transmission entities with the ability to partner with non-utility transmission developers, following the lead of Colorado and New Mexico.12All the >projects New Mexico Renewable Energy Transmission Authority (RETA) has or is developing are in partnership with merchant developers. The Colorado Electric Transmission Authority (CETA) has not initiated any projects yet but anticipates primarily and potentially exclusively partnering with merchant developers to develop new lines.
These transmission developers, known as merchant developers, are far less risk-averse than BPA or IOUs are. That’s in part because they do not face the same heartburn as utilities do over recouping their project costs through state regulatory proceedings. Instead, merchant developers earn back their investments by selling transmission capacity to utilities or renewable developers, who in turn pass along the costs to ratepayers. But merchant developers’ risk tolerance comes at a premium.  

“These developers really aren’t interested in the ratepayer impact,” said Galbraith of CETA. “What they want to lock in is a profit margin for their investors and shareholders.”  

The potentially higher cost of merchant transmission lines might be mitigated, though, if a state entity partnered with them and opened the door to low-cost financing. Both Colorado and New Mexico’s transmission authorities can issue government-backed revenue bonds, which are, Galbraith explained, “if not the lowest cost capital, pretty close.” He is interested in arrangements with merchant developers that would require them to use some of this low-cost capital in exchange for the benefits of partnering with CETA, most of all its eminent domain authority.  

By contrast, New Mexico Renewable Energy Transmission Authority (RETA) has not issued any bonds to help pay for the projects it has pursued with merchant developers. But that may be because its transmission lines export power; ratepayers outside New Mexico will bear the costs of the lines, likely lessening RETA’s concern with lowering project costs. 

3. Governors Jay Inslee and Tina Kotek can lead a multistate cost allocation framework for regional transmission lines.

Finally, Northwest states could collaborate with utilities and BPA to agree on a way to allocate the costs and benefits of regional transmission projects. “If a regional body identifies a cost allocation framework, utilities have some semblance of assurance when they seek recovery at a state regulatory body,” said Foster of PGE. 

Developing this type of agreement would, however, require a regional planning body, whether a regional transmission organization or some other entity. Today the Northwest sorely lacks this type of forum, as Sightline covered extensively in the first article in this series. Creating one would necessitate leadership from Northwest governors, likely beginning with those already committed to addressing the climate crisis. While NorthernGrid, the region’s current planning body, does technically have a cost allocation process and methodology, as FERC requires, it has never used it for any project, and state representatives have no influence over it.13See August 17, 2022, comments by the Washington Utilities and Transportation Commission, Oregon Public Utility Commission, Washington State Department of Commerce, and Oregon Department of Energy in FERC Docket No. RMI21-17-000.
 

Jenks of the Oregon CUB agrees with Foster that a planning process that identifies how to allocate costs and benefits for necessary regional projects would likely increase the willingness of state utility commissions to allow IOUs to recover their transmission investments. However, he does not believe state regulators should preemptively approve IOUs’ potential transmission investments. Utilities can, he argues, “mismanage any project,” leading to potentially exorbitant costs for ratepayers. Plus, any transmission project that an IOU develops will inevitably be more expensive than a project that can leverage public financing, such as one BPA could build. 

Some improvements could come when and if FERC finalizes a new rule it proposed in April 2022 that would require transmission planning entities, including NorthernGrid, to actively involve states in cost allocation processes. However, even if FERC finalizes this rule, BPA’s participation in any Northwest cost allocation framework would be entirely optional because the agency is not under FERC jurisdiction. As such, state leaders would still need to pursue a voluntary multistate, multiparty cost allocation agreement that includes BPA so as not to put all the financial burden for new regional transmission lines on IOU customers. 

Not paying for more transmission capacity is the costliest choice of all 

Transmission lines are expensive, but not building them is costing the Northwest dearly. As BPA and IOUs close their purses to regional transmission projects, our region is racking up an ever-worsening climate bill. In just the few weeks since Sightline published the first article in this series, hundreds of people in British Columbia and Washington lost their homes in devastating wildfires, Seattle’s air quality ranked the worst in the world, and Portland hit its highest August temperature on record and third hottest of all time. All the while, ratepayers are stuck paying billions for inefficient grid projects. 

Northwest leaders, including Senator Maria Cantwell and Governor Jay Inslee, can break this logjam. They can lessen the impact on ratepayers with solutions that leverage low-cost public finance, though the climate crisis demands that all options be on the table. The question facing the Northwest is not whether we will pay, it’s what we will pay: the cost of a few more electric wires, or our health, livelihoods, and a livable planet. 

Sightline fellow Laura Feinstein contributed research to this article.

Four Ways to Improve Portland’s Housing Affordability Mandate

Find audio versions of Sightline articles on any of your favorite podcast platforms, including Spotify, Google, and Apple.

In 2016, when Portland’s city council voted to start requiring a share of homes in new buildings to be made affordable to lower-income Portlanders, some predicted disaster. 

“Could well make the city’s housing affordability problems demonstrably worse,” urban economist Joe Cortright warned. 

Others rejoiced. 

“Would harvest the windfall profits that our wildly inflated housing prices are creating,” John Mulvey, a housing advocate with the East Portland Action Plan, predicted. 

Others said that it might need to be adjusted in the future. 

“At the earliest possible stage, if there is a need for us to reconvene and rethink any part of it… I want to make sure that that’s baked into our policy,” City Commissioner Nick Fish said. 

Well, it took six years for the city to get around to it, but that self-assessment is finally underway—and it points the way to a handful of relatively modest changes that could mend (and not end) a program that looks like a pretty good deal for both tenants and taxpayers. 

Since last fall, I’ve been honored to serve among 10 fellow Portlanders on the city’s volunteer “inclusionary housing calibration work group” that has teamed with the city’s staff and consultants to dig into the program’s numbers, goals, outcomes, and future. Though there have been a few moments of healthy tension, the process left me impressed by the city staff’s interest in getting the details of this policy right. 

In that time, I’ve also learned just how unusual Portland’s program is among similar “inclusionary zoning” programs. The key difference: unlike almost all similar programs in the United States but like more productive flavors of inclusionary zoning such as this one in France, Portland’s program is at least partially funded. 

In Portland, the public pays for the program in the gentlest of ways: by waiving some taxes and fees on buildings that comply with it. And as the city’s contractor found, that waiver can potentially be enough to make the program work. The catch: if the program will both maximize the number of below-market homes and avoid driving up market prices, it needs full funding. 

Happily, full funding is within reach. With just a few tweaks, criticism of Portland’s program would likely recede. In fact, it can become a model for other North American cities that want to mandate mixed-income homes in new buildings. 

Here’s what that would take. 

1. Define success 

Portland’s program has an essentially qualitative purpose statement: the program should “increase” the number of less expensive homes available in areas with “superior access to quality schools, services, amenities and transportation,” especially affordable to households making less than 60 percent of the city’s median income. (For a one-person household, that’s $47,400; for a three-person household, it’s $60,960. At those incomes, federally defined “affordable” rents, including utilities, are capped at $1,185 for a studio, $1,524 for a two-bedroom, and so on.) 

Having a purpose is good. But Portland hasn’t actually set any quantitative criteria for the city to judge this program’s success or failure. This is bad. 

Here’s one simple figure that could be used to evaluate the success of the program: not just to “increase” but to maximize, given available public resources, the number of new homes in desirable areas that are affordable to Portlanders making 60 percent of the median income. 

This is a crucial difference. Any construction at all under a mandatory inclusionary housing program will “increase” the number of below-market homes built, compared to a city with no such program. Someday, Portland might mandate that 40 percent of homes in new buildings have regulated affordability, with no public funding to offset those costs. If that set of rules resulted in a single 100-unit building each year, the current program language would count those 40 homes as a sign of success. 

But in a city of 600,000, just 40 new below-market homes per year isn’t a success. It’s a flop. A “maximization” policy, by contrast, wouldn’t be satisfied with a flop. Instead, it would keep pushing Portland to fund its mandates. This is what’s needed to make them productive. 

This principle can unite Portland’s left (which tends to advocate most fiercely for below-market homes) and center (which tends to advocate most fiercely for market-rate homes). A strong inclusionary housing policy is a win-win from both these perspectives. 

2. Fully fund it 

The crucial piece of a healthy inclusionary zoning policy is simple and intuitive: public benefits require public expenditure.  

The good news is that this expenditure doesn’t need to be huge. 

The city’s economic consultant found that although Portland’s inclusionary housing program is not currently fully funded, there’s a clear path to getting it there, at least for rental properties. But it will take a little time to explain why the program is working in one part of the city and not in another. 

2a. Today’s program in central Portland: fully funded and cost-efficient 

Below is a financial analysis of Portland’s program as it applies to the “Central City,” local planning jargon for both the skyscraper-studded downtown and the ring of neighborhoods around it on both sides of the Willamette River, west to Interstate 405 and east to approximately 12th Avenue. 

The tables below summarize research by BAE Urban Economics, a consulting firm hired by the Portland Housing Bureau to interview local development industry professionals and capture current development cost factors. This first table imagines a hypothetical 7-story apartment building in central Portland. Four Central City scenarios for that building are listed: a “high-rent” location and a “medium-rent” location, and in each of them the city’s two primary ways for buildings to comply with inclusionary housing rules, the so-called 60% MFI option (in which buildings set aside 10% of their homes to rent at fairly low prices) and the so-called 80% MFI option (in which buildings set aside 20 percent of their homes to rent at more midrange prices). 


Here are two important things to notice in this sea of numbers: 

In these Central City scenarios, the program is healthily funded. Look at the bottom line, labeled “cost-benefit ratio.” This is the cost of the inclusionary housing program (to the public, in waived taxes and fees) divided by the benefit of the program (to the public, in the form of rents that are lower for some homes than they would otherwise have been). 

For a program in perfect balance, the figure would be 1.  

In each price scenario (“high-rent” and “medium-rent”), the developer of this hypothetical project has an option (60% AMI) where the tax and fee breaks (“city incentives/fees”) exceed the costs of offering some homes below market value (“cost to market rate developers”).  

However, because the program also puts some administrative costs on landlords that aren’t captured above, it may make sense to target a ratio a bit above 1. Is 1.4 or 1.6 more tax abatement than necessary? That’s debatable. However, we might not want to worry about it because…

Even in the fully funded scenarios, the “incentives per affordable unit” line is below $250,000. This is the combined value of all the city’s tax and fee waivers divided by the number of below-market homes. As affordable homes go, this is quite a good deal. In Oregon, apartments in dedicated “affordable housing” projects currently require an average of about $225,000 from the state trust fund and federal tax credits, typically matched with locally administered federal and local funds. The city’s inclusionary housing program, by contrast, is doing the whole job with that sum in local funds alone.

Consider, too, that these affordable homes aren’t cutting corners by concentrating poverty in low-rent areas. The whole concept of inclusionary housing is that it ensures that some low-price homes end up in the sort of desirable areas where people are willing to pay relatively high market prices. If the public wants to make investments in affordable housing, this looks like a relatively efficient one. 

2b. Today’s program outside central Portland: underfunded and malfunctioning 

Outside of central Portland, by contrast, the city’s economic analyst found signs of trouble. Here’s the same table again, this time with “low rent” scenarios added: 


Outside the Central City, the program is deeply underfunded.
Check out the crucial “cost-benefit ratio” line this time. In the places outside the Central City where people most want to live (the places that can command the highest rents), the program is only about 20 percent funded today. For a hypothetical four-story, 84-unit apartment building, the project is short at least $1 million, which means that these 84 homes (nine to 19 of which would have been priced below market) won’t get built at all until market-rate rents in Portland climb by hundreds of dollars per month. That’s probably not the world Portland’s leaders want to create. 

Even in medium-rent scenarios, the program is at most half funded. It’s not until you get to truly low-rent parts of Portland (mostly east of Interstate 205) that the program comes close to balance again, simply because there’s not much difference between the officially “affordable” rent and the market rent. But in low-rent areas, market rents generally aren’t high enough for anyone to be building new apartment buildings anyway. 

When an affordability mandate is heavily underfunded, developers start bending over backwards to game it. Pages 12 to 15 of this city slideshow offer a tour of the ways that’s happened in the last several years: buildings that are slightly too small (19 units) to trigger the affordability mandate; big projects split into multiple 19-unit buildings; and buildings of nothing but studio apartments, to get a tax break on a housing type that’s already inexpensive.  

A city analysis found that though these 12- to 19-unit buildings still aren’t common, the number of new homes in such buildings approximately doubled when the city’s affordability mandate was introduced in 2018, and that number has been more or less consistent since. That’s real-world evidence of an underfunded program that is a net cost burden on projects of every size. 

Bringing the program into balance would require a larger property tax abatement. Why is the program fully funded in central Portland but not elsewhere? Because in central Portland, local taxing districts currently waive property taxes on the entire building for 10 years; outside the Central City, they waive those taxes only for the below-market units. There’s a simple fix here: the city and Multnomah County would need to agree to temporarily waive property taxes on a larger share of buildings outside the Central City as well. 

The program would be fully funded just by waiving taxes that are not currently being collected on buildings that do not currently exist. 

3. Smooth it out 

As you may have gathered by now, one awkward thing about Portland’s inclusionary housing system is that it assumes there are exactly two parts of Portland: the Central City and everywhere else. 

But that’s not how Portland works. Neither Southeast 16th Avenue nor Southeast 162nd Avenue is in the Central City, but economically they’re in different worlds. Things change over the years, but this has been the case for decades. This is what accounts for the big differences between the “high-rent” and “low-rent” parts of the “outside central Portland” table above. 

One way to make Portland’s system smarter without introducing needless complexity would be to map the city into three parts rather than two. In fact, the city already has a useful map: 

Map of the Portland, OR metro area showing rent costs in a color coded design

Source: Portland Bureau of Planning & Sustainability’s Anti-Displacement Action Plan


Every five years, the Portland Housing Bureau updates this map of “opportunity” in the city of Portland. Parts of town that are physically close to jobs and have schools with high graduation rates, frequent transit, and other amenities get high opportunity scores (the deepest shades of red in the map above). This score is informed by lots of empirical research (this, for example) showing that the location of our home greatly affects our lives, especially as children. To give more people the choice to live in places they feel are right for them, it makes sense for the city to prioritize below-market housing in the highest-opportunity areas. 

These “opportunity areas” also correspond roughly to rent levels—and, therefore, to the viability scenarios for inclusionary housing. Depending on the numbers, Areas 5 and 4 might fall in one category, with the highest tax abatements; Area 3 in a second category; and Areas 2 and 1 into a third. 

That would roughly ensure that projects anywhere in town could be fully funded while minimizing waste. 

Another possibility for Areas 2 and 1 might be for the city to raise the trigger for its program somewhat, from 20 units to 30 or 35. That would reduce regulatory burden on smaller-scale investments in those areas and reflect the fact that at least right now, there’s not actually a big difference between market rents and “affordable” rents. These lower-opportunity areas mostly need investment, period. 

4. Focus it on folks who need it more 

Since 2015, when Oregon’s legislature allowed affordability mandates to exist, some have chafed at one of the so-called sideboards the state has imposed: legislators required any such program to let developers comply by building a certain share of homes at 80 percent of the median income. 

In Portland today, that means $63,200 for a one-person household and $81,280 for a three-person. Do people making that much money sometimes struggle to afford good housing? Of course. But generally speaking, if you make that much money, you can find a decent market-rate home in Portland, if not a new one. More than half of all homes in Portland rent for less than the rent of a one-bedroom home affordable to someone making 80 percent of the city’s median income. 

That’s not the case for someone earning 50-60 percent of the citywide median (e.g., nursing assistants, preschool teachers, clerks, retail workers). That’s approximately the point at which public subsidies start making a big difference to whether people get housed. 

A possible solution: Portland can comply with the letter of state law by allowing an 80 percent option without fully funding that option. Almost every developer would choose the fully funded 60 percent option instead. The end result: directing the government’s limited tax abatement dollars to people in more need. 

A few things to avoid 

Most of the suggestions above are consistent with a letter of recommendations, released on July 28, from the advisory work group I’ve been part of. That letter also recommends some more technical tweaks (like a simpler and more objective way to identify “equivalent” homes) and some suggestions for future work (like a similar math exercise for condo projects, which have all but vanished since the affordability mandate launched and might require a different approach to fully fund). 

It’s worth briefly mentioning three possibilities that could unintentionally harm the program and, as a result, the tenants who benefit from it. 

  • Doling out public subsidy on a case-by-case basis. In theory, it would be very efficient to allocate projects only as much tax abatement as a developer can prove their building needs if it’s going to exist. The trouble is that development math isn’t so clear-cut. A project that pencils in May might no longer pencil in October, or vice versa. This would inevitably lead to guesswork and, potentially, discretionary decisions by city staff or even elected leaders. This might be good for well-connected local developers but it would also be a mess. It might even be better to slightly underfund some buildings than to introduce this much uncertainty. 
  • Fully funding only big buildings. Big buildings can be great for cities and for neighborhoods, but so can medium-size buildings such as three-story apartment buildings that don’t require land assembly or Wall Street investors. Sometimes you need one or two medium-size buildings before you can get the next big one down the street. Portland shouldn’t go out of its way to juice up big projects at the expense of smaller ones. 
  • Thinking this is the only policy that matters. Portland’s affordability mandate has been blamed for a lot during its young life. Debate is healthy, but Portlanders shouldn’t let a debate fool them into thinking this mandate is the only reason apartment construction has ebbed, or that fully funding it would be enough to make every new project work. 

Fortunately, all these possibilities are easy to avoid if the city wants to.  

And despite a lot of drama over the years, that’s consistent with the rest of this program’s calibration. A decade of public debate and a year of mathematical self-scrutiny have come down to a few boring, straightforward steps for local leaders. Portland and Multnomah County should decide what exactly this program is supposed to do; fully fund that mission; and then get on with the rest of their important work.

Oregon’s Land Use Law Creates Wildfire-Adapted Communities

Find audio versions of Sightline articles on any of your favorite podcast platforms, including Spotify, Google, and Apple.

William Kuhn, who lost his Bend, Oregon, home in the Awbrey Hall Fire, has a warning: “Anyone who decides to live on the edge of the forest risks losing their homes. We know that.” 

Once considered rare, the “fire weather” that fueled the 1990 Awbrey Hall Fire is now a fixture of Cascadia’s climate. “It’s not a question of if, but when fires come through,” said Boone Zimmerlee, Deschutes County’s fire-adapted communities coordinator. 

The 2013 Green Ridge Fire burns in the Deschutes National Forest (source: US Forest Service).

Building wildfire-resilient communities is key for climate adaptation. As I recently documented, the best tool for the job is guiding growth away from areas of fire hazard, which I call fireplains. Building new homes within existing urban areas, or “infill,” is the safest solution, followed by compact development contiguous with existing city limits. 

This is exactly what the residents of Bend, Oregon, did circa 2009, when they invoked the state’s landmark 1973 land use law and prevented houses from being built in a fireplain by instead directing growth inside city limits. 

Across the state, Oregon’s land use law has been silently protecting life and property from wildfire. As Rory Isbell of Central Oregon LandWatch noted, “If you think of where the Labor Day fires burned a few years ago, up and down the Santiam, the McKenzie, and the Clackamas, if they’d had big, sprawling residential suburbs, the fires would have been a heck of a lot worse.” 

Bend’s case shows how growth management policies can empower Cascadians to build wildfire-resilient communities. It also offers correctives to upgrade Oregon’s land use law, or at least to improve how it is used. 

Growth is coming 

Along with the rest of the West, Cascadia’s population is growing. To keep up with the influx, by 2040, Idaho needs to build about 660,000 new dwellings, and Washington will need an additional three million. 

Population is growing fastest in areas abutting or intermixing with wildlands, called the wildland-urban interface (WUI). Specifically, people are flocking to fireplains, where wildfires naturally return every few decades. 

Cascadians face a choice: continue to grow fastest in places that inherently require millions of dollars of firefighting every year, or direct growth into compact communities. 

As a “nature lover’s dream,” the city of Bend, Oregon, is among the fastest growing cities in the United States. Over the next 50 years, the city will likely more than double its population, welcoming 120,000 new residents. 

The big question: where will they live? 

North Sister and South Sister, Three Sisters Wilderness, Deschutes National Forest (source: Bonnie Moreland).


Pushing more houses into a fireplain: An ill-advised solution 

Bend sits directly east of the seasonally dry Deschutes National Forest, putting it at the edge of a “frequent fire” zone, where wildfires naturally return every 35 years or earlier. 

In 2009 the city of Bend and Deschutes County announced plans to expand Bend’s urban growth boundary and add as many as 5,000 new dwellings in this fireplain. The map below illustrates the proposed expansion. (The area within Bend’s original 2009 urban growth boundary is shown in white; the proposed expansion area is shown in pink.)

Map showing the various parts of a planned expansion outward for Bend, OR (into fireplains)
To the west of Bend, this proposed expansion
overlapped with the footprint of the Awbrey Hall Fire that had burned homes and forced the evacuation of hundreds of people less than 20 years prior. The wind-whipped fire rebuffed the attack of fire crews fighting the main blaze’s 150-foot flames and the exponentially expanding spot fires ignited by flying embers. Within ten hours, the fire spread six miles, jumping over three major roadways and the Deschutes River. 

The Awbrey Hall Fire would have been catastrophic had the wind shifted slightly and blown the wildfire head-on into downtown Bend, which could have caused a domino effect of house-to-house ignitions. But to the relief of residents and drivers idling in the backup of fleeing vehicles, a quirk in the weather saved the city. In the end, only 22 homes were destroyed, no lives were lost, and all fire crews came out safely. 

Residents redirect new construction to safety 

When Bend and Deschutes County proposed expanding the city’s urban growth boundary into this fireplain, residents objected. Not only was there a high fire hazard but converting this natural area to houses would also degrade the sensitive watershed around Tumalo Creek, which empties into the Deschutes River. The creek provides rare surface waters and riparian habitat in an area where porous soils mean that the Deschutes is mostly fed by groundwater. 

To protect this natural area, residents used Oregon’s statewide land use law to appeal the new development. The law, in addition to preserving farm- and forestland, aims to limit urban sprawl by prohibiting subdivisions outside designated urban growth boundaries around cities and towns. Cities and towns set urban growth boundaries to accommodate about 20 years’ worth of growth, and the boundaries can only expand after the enclosed area is developed. 

The Oxford Building in Bend’s upzoned Central District (source: City of Bend).

Bend residents and the nonprofit Central Oregon LandWatch successfully argued that the city had not considered existing opportunities for growth inside the current urban growth boundary. Over the past decades, Bend had grown outward subdivision by subdivision with very little multifamily construction and almost no mixed-use development outside the small historic downtown. So when city planners were forced to look, they found lots of room to grow within city limits. 

The city revised the plan, shrinking the growth boundary expansion by 70 percent and redirecting some housing growth inward by upzoning nine “opportunity areas” inside existing city limits 

In the heart of downtown Bend, within walking distance of shops, restaurants, and the river, a swath of underutilized and vacant land is now zoned for residential development up to six stories tall mixed with commercial and retail spaces. Bend also secured funding for climate-smart urban infrastructure such as school capacity, sidewalks, bike lanes, and street trees for its new residents. Bend’s Central District is becoming a place, as Isbell put it, “where people can actually live and not have to drive a car everywhere.”  

Elsewhere in the city, Bend accommodated future growth by upzoning areas of single-detached housing to allow multifamily construction. 

The map below contrasts the proposed expansion (shown in pink) with the much smaller footprint of the revised expansion (shown in purple). As before, the area of Bend’s original 2009 urban growth boundary is shown in white. Scattered within this existing boundary, the upzoned opportunity areas are in green. 

Map showing how the new Bend, OR plan builds infill housing instead, away from fireplains


The new plan drastically reduced the expansion of the urban growth boundary and limited the number of homes in the fireplain west of Bend, leaving room for a fire break between the city and Deschutes National Forest.
 

While wildfire played a minor role in the appeal,1Bend residents had argued, under Goal 7, which mandates that counties identify hazards, that wildfire hazard made the proposed development inappropriate. However, the court ruled against them. Goal 7 only requires counties to identify natural hazards and does not specify how to protect against them. Isbell and Paul Dewey, former director of Central Oregon LandWatch, both argue that Goal 7 needs to be revised in light of the huge fires that burn in Oregon.
wildfire hazard has since become a top public concern in Bend, and all sides in the negotiations, from developers to plaintiffs, credit the revised plan as a wildfire success story. In 2014, before the new growth boundary was finalized, the Two Bulls Fire blazed just west of Bend, burning 6,908 acres, prompting the evacuation of 635 households, and only avoiding the city by a lucky change of wind. 

By redirecting houses away from the fire-prone Deschutes National Forest, Oregon’s land use law is saving lives and property, not to mention untold firefighting dollars. 

Loopholes for leapfrogging 

The full story is more complicated. While Oregon’s growth law has succeeded in protecting forest- and farmland, cities have sprawled more than intended, often in the low-density and leapfrog patterns that pose the greatest risk of wildfire damage. 

First, by itself, the land use law would not have prevented Bend from sprawling into the fireplain. It was Bend residents’ wielding of this law that led to more compact growth. According to Isbell, “it took a lot of community organizing and advocacy to shrink the expansion.” 

Bend has expanded subdivision by subdivision (source: City of Bend).

Second, exurban “exception areas” allow large-lot development outside growth boundaries. So even with an organized and resourceful community, Bend residents had to compromise. Like many Oregon cities, exurban land surrounding Bend was zoned for exception areas of minimum lot sizes of 2.5 to 10 acres per dwelling. (For reference, a 2.5-acre minimum restricts building to one house for every two-and-a-half football fields’ worth of land.) Without expanding the urban growth boundary, developers could build large-lot houses. This was their bargaining chip. On the other hand, without expanding the urban growth boundary, they couldn’t build the high-density subdivisions that are most profitable. 

To prevent a landscape crisscrossed with large-lot development, residents negotiated to allow a greater number of subdivisions than existing exurban zoning would have permitted in exchange for a compact placement of development that minimized habitat loss and wildfire risk within a modestly expanded urban growth boundary. 

Third, counties can authorize large-lot development (greater than one acre per house) within urban growth boundaries on land not annexed into a city. When this happens, subsequent subdivision of these lots becomes less likely and costlier, causing future development to leapfrog over these areas and accelerating the need for an urban growth boundary expansion. 

Bend avoided this fate through explicit amendments in the Deschutes County subdivision code. Paul Dewey, former director of Central Oregon LandWatch, credits the success in part to collaboration among property owners, community advocates, and government officials. 

“The county and the city have worked really well together,” he said. “Despite a wide spectrum of political views, this plan had far more public support than opposition.” 

climate-smart cities are fire-smart cities 

On the other side of the equation, cities aren’t necessarily making infill easy. Where it’s allowed, local governments typically don’t nurture the growth of compact, vibrant cities. 

With its revised growth plan, Bend upzoned some areas designated for single-detached housing and allowed vertical growth and mixed development in its walkable downtown. And since the Oregon legislature passed HB 2001 in 2019 and complementary reforms, internal growth will now be easier in all Oregon cities. 

The pressure is on to house Oregon’s growing population, which will likely require about 30,000 to 40,000 new homes every year. By nurturing compact, vibrant, and climate-smart cities, land use laws help address the classic challenges of growth: coordinating infrastructure and public services, efficiently using land, and protecting natural resources. 

They also safeguard against wildfires, which makes land use laws invaluable firefighters in our increasingly fire-prone region. 

Keeping houses out of fireplains makes it easier to return beneficial fire to forests. Pictured is a Prescribed Fire Training Exchange (TREX) burn near Bend (source: US Bureau of Land Management).

From Vermont to Oklahoma, Legislatures Challenge Parking Mandates

Find audio versions of Sightline articles on any of your favorite podcast platforms, including Spotify, Google, and Apple.

In the 2023 legislative session, more than a dozen US states have proposed legislation to reduce or eliminate parking minimums.  

“It’s exciting,” said Tony Jordan, founder of the national Parking Reform Network, which connects advocates and policymakers with resources. To Jordan, the number of state bills introduced signal a quietly growing number of people working on the issue. “It’s becoming very popular.” 

For decades, nearly every town across North America has required all new homes and businesses to have a pre-determined number of parking spaces. But as widespread housing shortages and empty office buildings multiply, states are increasingly taking up the effort to roll back parking mandates instead of waiting for cities to adopt new codes one by one. Last year, Oregon and California both adopted policies that struck down parking mandates at the state level.  

Widespread parking reform proposals have yet to be as successful in other states, but the number of bills popping up in states across the political spectrum illustrates the movement’s growing influence.  

Reducing parking minimums is most commonly found as one part of a larger reform package to increase housing supply, like in Colorado’s comprehensive More Housing Now bill. Legislators from multiple states, though, have begun to address parking minimums directly with simple bills only a few pages long. In Oklahoma, a bill was introduced that would have ended parking minimums outright. Washington attempted to eliminate mandatory parking near frequent transit stations. Another transit-oriented measure in New Jersey would cut parking minimums near transit in half; that bill is still alive, having passed the state senate in May. 

Stand-alone parking bills

Arizona HB 2259 

To prohibit parking mandates statewide for all affordable housing. Failed in committee. (Did not pass)

Maryland HB 819 

To remove parking minimums within ¼-mile of all existing or planned Metro or Purple Line transit stations, in anticipation of a new 16mile light rail line in the DC area. Passed the House unanimously, but the Senate dropped the bill after Montgomery County (the only jurisdiction affected) pledged to introduce a similar measure at the local level. (Did not pass)

New Jersey S 3605/A 4984 

To reduce local parking mandates by 20, 30, or 50 percent based on proximity to a transit station. Passed the Senate 21-12 in May, now in House committee. (Pending)

Oklahoma  S 246 

To prohibit local governments from imposing minimum parking requirements. Failed in committee. (Did not pass)

Washington HB 1351/SB 5456

To eliminate parking minimums within a halfmile of frequent transit. Failed in committee. (Did not pass)

Parking reformers’ biggest 2023 wins so far have come in Vermont and Montana. Despite very different political majorities, both states legalized more housing while capping local parking mandates at one parking space per home through much of the state. Other successful housing supply bills, like ones that legalized accessory dwelling units, included pre-emptions of parking requirements. 

Parking reform in abundant housing policies

Arizona SB 1117 

Part of a larger state zoning reform, this bill aimed to eliminate parking mandates for residentially zoned areas in cities with more than 30,000 residents. After this bill failed a Senate vote, a very similar provision was briefly amended into another zoning reform bill, HB 2536, which also failed in the Senate. (Did not pass)

Arizona HB 2272 

To require cities with over 75,000 residents to adopt a housing plan and 7 of 13 zoning reforms; eliminating parking minimums was one of them. Failed in committee. (Did not pass)

Colorado SB23-213 

Part of the comprehensive 150+ page More Housing Now bill. To eliminate parking minimums for multifamily housing near transit stations and for accessory dwelling units, and middle housing types. Passed the House, failed in Senate. (Did not pass)

Maine HP 1071 

To establish a new state program to assist in redevelopment of commercial corridors. Eliminating parking minimums, in addition to other zoning changes, would have been required for project areas. Failed in committee. (Did not pass)

Massachusetts S.858/H.1379 

Part of a broad housing supply proposal to eliminate parking minimums for multifamily housing within ½-mile of transit stations. Caps parking minimums for accessory dwelling units at 1 space per home, with driveway tandem parking allowed. Vacant commercial properties to be free from parking mandates if being converted to housing, if 20 percent of the residential space is dedicated to affordable housing. Hearing scheduled for July 26, 2023. (Pending)

Montana SB 245

Originally proposed with no parking requirements, this bill that legalized multifamily housing in commercial areas ultimately set a statewide cap on parking minimums: 1 parking space per home in cities with over 5,000 residents. (Passed)

Montana SB 528 

Legalized 1 accessory dwelling per lot, no parking required. (Passed)

Montana SB 382 

The Montana Land Use Planning Act requires local governments to adopt at least 5 zoning reforms from a list of 14, one of which is to eliminate or reduce parking requirements to 1 space per unit. (Passed)

New York S162/A5700 

To prohibit local governments from imposing parking mandates, along with other exclusionary zoning practices. Failed in committee. (Did not pass)

New York A6670 

This transitoriented development bill would have restricted local governments from regulations that effectively prevent the construction of buildings, including parking requirements. Failed in committee. (Did not pass)

North Carolina HB 409 

To legalize accessory dwelling units. Local parking requirements may not apply. Passed the House 106-7, now in Senate committee. (Pending)

Rhode Island S 1037 

Capped local parking minimums at 1 parking space per home for low- to moderate-income housing, up to two bedrooms. (Passed)

Texas HB 3921/SB 1787 

To ease regulatory barriers for small lots (under 4,000 square feet), local parking mandates to be capped at 1 parking space per lot, and no covered parking can be required. Would apply to cities over 85,000 residents. Passed out of the Senate, but did not advance to a House vote. (Did not pass)

Vermont S.100 

This omnibus housing supply bill capped parking minimums at 1 space per dwelling in areas served by water and sewer infrastructure. Outside of those areas, 1.5 parking spaces per home can be required for multifamily buildings under certain conditions. (Passed)

Vermont H.68 

This House version of a housing supply bill would have set a statewide zoning standard at 1 per dwelling. Failed in committee. (Did not pass)

Washington HB 1337 

Eliminated parking minimums for accessory dwelling units within ½-mile of a frequent transit stop. Elsewhere, cities cannot require more than 1 space per home for properties smaller than 6,000 square feet, or 2 per home for larger lots. (Passed)

Washington SB 5466 

To eliminate parking minimums in areas near transit stations as part of a broader transitoriented upzoning package. Passed the Senate, failed in House. (Did not pass)

Washington HB 1110 

Eliminated parking minimums for middle housing within ½-mile of a frequent transit stop. Elsewhere, cities cannot require more than 1 space per home for properties smaller than 6,000 square feet, or 2 per home for larger lots. (Passed)

These efforts were buoyed by 2022 breakthroughs in state-level parking reform. Both Oregon and California adopted policies to make parking fully optional for properties near transit service, and for certain uses in Oregon. The new policies went into effect in both states on January 1, 2023. 

Oregon’s parking reform survived the legislative session intact. The sole public hearing on a bill that would have nullified the state’s new land use and transportation rules was canceled after more than 140 Oregon residents and organizations submitted testimony to oppose it. It was never rescheduled. 

In May, California Representative Robert Garcia broke another barrier, elevating the issue to the federal level by introducing the People Over Parking Act in Congress. Modeled after California’s state law, the bill would eliminate parking requirements within a half-mile of transit service. He was joined by Representatives Earl Blumenauer (OR), Greg Casar (TX), and Seth Moulton (MA). 

The shifting Overton window is a welcome development to advocates like Jordan, who first got involved with parking reform a decade ago. He described the phases of policy change like steps on a ladder. “First, they cap what you can do. Then you legalize certain kinds of housing without it. And then maybe you go for the transit stations,” he said. “Eventually someone’s going to do the whole thing.”  

The day when parking minimums are wholly relegated to the past might be a ways off yet, but it’s clear that interest in removing them isn’t going away anytime soon.  


Did we miss one? Let us know about your statewide parking reform at editor@sightline.org. 

Why Is It So Hard to Build New Transmission Lines?

Find audio versions of Sightline articles on any of your favorite podcast platforms, including Spotify, Google, and Apple.

Editor’s note: This is the first of three articles discussing the major challenges—planning, permitting, and paying for it—to building the transmission lines needed to transition to a cleaner energy future. 

Electric transmission lines—those giant high-voltage wires that zap electricity across long distances—recently graduated from a fringe topic to a core challenge in the quest to decarbonize Cascadia. More leaders and climate hawks now recognize the centrality of transmission capacity to meeting climate goals, but that recognition has yet to yield action. The Northwest grid is jammed, and hundreds of wind and solar projects are languishing as a result. Neither the Bonneville Power Administration (BPA) nor Northwest utilities—nor anyone else, for that matter—is building the new transmission lines necessary to power millions of households and businesses in Cascadia with clean electricity. Why? 

Much of the national conversation diagnosing impediments to new wires in the United States focuses on complex and lengthy permitting processes and their adjacent challenge: local communities’ opposition to new energy projects in their backyards. But a smooth permitting process is only one leg of the three-legged stool that successful transmission projects rest on. The other two are adequate planning and the right incentives for paying for the expensive lines. 

Sightline looked into each of these three barriers in the unique context of Cascadia. This article, part of a series investigating the challenges of building transmission lines, focuses on planning. 

If transmission lines aren’t planned, they aren’t built. And if transmission lines aren’t built, neither are new wind turbines or solar farms, prolonging our dependence on planet-destroying, war-fueling oil, coal, and gas. But the organizations that plan Cascadia’s future wires (largely, BPA and utilities) are plodding along the same way they have for years, ticking boxes and averting their gaze from the impending new demands on the grid. Meanwhile, Cascadia is on fire, and heatwaves are shattering temperature records around the world. 

A different way forward is both imperative and entirely possible. Instead of betting our future on outdated, fractured, and myopic planning processes, Northwest leaders could establish a new regional transmission planning entity with the authority and resources to shepherd the region’s grid into the twenty-first century. Until they do, Cascadia’s climate ambitions grow more precarious by the year. 

Cascadia’s transmission planning process: Fractured, shortsighted, and perpetually behind the times 

“A goal without a plan is just a wish,” author and aviator Antoine de Saint-Exupéry is said to have written. If you ask anyone at BPA or a Northwest utility whether they are planning the grid for the future, they will assure you that they are. But plunge into the murky depths of transmission planning processes yourself and you will quickly become alarmed that Cascadia’s audacious climate goals may turn out to be mere wishes unless we chart a different course. 

Since 2011 the Federal Energy Regulatory Commission (FERC) has required all utilities that own transmission wires to participate in regional planning processes. In the Northwest, NorthernGrid leads that process. The group counts 16 members, including BPA, the region’s investor-owned utilities (e.g., Portland General Electric [PGE], Puget Sound Energy [PSE]), and some municipal utilities (e.g., Seattle City Light).1NorthernGrid is the successor organization to ColumbiaGrid and the Northern Tier Transmission Group.
 

But NorthernGrid is ill prepared for the task at hand: ushering the Northwest’s grid into an entirely new era dominated by climate change. The association has no full-time staff, no independent leadership, and is not accountable to state regulators or policymakers. It is essentially a small club of BPA and the biggest power utilities in the region that meets the letter, but not the spirit, of FERC’s planning requirements. 

For evidence of these deficiencies, look no further than NorthernGrid’s only regional transmission plan to date, which spans 2021–31. The “plan” simply rubber-stamps all the regional transmission lines BPA and NorthernGrid’s utility members have proposed. It offers no new or different lines that might be imperative to meeting climate goals efficiently and cost-effectively. And it includes no interregional lines or wires proposed by non-utilities (known as merchant transmission lines). In other words, NorthernGrid’s “regional plan” copies and pastes whatever BPA and the utilities had already decided to do without examining what Cascadia needs to build to stave off an ever-worsening climate crisis. 

NorthernGrid’s plan also ignores the impending surge of new clean energy resources Cascadia is counting on to decarbonize. The plan only looks as far as the next decade, rather than more prudently chalking out the next 20 years. And it relies on old data utilities developed before game-changing climate laws like Washington’s Clean Energy Transformation Act went into effect. 

Sightline compared the data NorthernGrid is using to develop its forthcoming second regional transmission plan against the latest publicly available data in Northwest investor-owned utilities’ most recent integrated resource plans (IRPs).2IRPs are public 20-year plans that the law requires utilities to file with public utility commissions every few years.
The chart below shows just how unhelpful NorthernGrid’s yet-to-be-released plan will likely be at providing a trustworthy road map to decarbonize the region’s grid. The bar at left represents the new wind, solar, and storage resources that NorthernGrid assumes the Northwest will add over the next decade. By contrast, the bars at right represent the new resources that utilities estimate they will need to clean up their portfolios over the next 10 and 20 years, according to their latest IRPs.3Twenty-year resource timeframe varies slightly by utility. Avista and PSE project to 2045, PacifiCorp and PGE project to 2043, and Idaho Power projects to 2041.
NorthernGrid is not only lowballing the 10-year resource additions, but also wholly ignoring nearly 20,000 megawatts of new renewable energy the region is depending on to decarbonize in the subsequent decade. 

Bar graph showing how there is a disconnect between what is planned and what is being expected
Many of these renewable projects will require new transmission capacity to get off the ground, and new wires can take 10 or even 20 years to build. In this context, NorthernGrid resembles a driver planning for a weeklong road trip who decides what to pack based on last year’s balmy weather and only checks the three-day weather forecast. Meteorologists warn that a blizzard will hit in five days, but NorthernGrid ignores them, grabs a sunhat, and leaves the tire chains at home.
 

With NorthernGrid phoning it in, one might assume that BPA would step up. After all, BPA built thousands of miles of transmission wires in the 1960s and 1970s and now owns and operates 75 percent of the region’s high-voltage lines. Enjoying a full-time transmission planning staff and flush with more than $17 billion dollars in borrowing authority from the US government, BPA is the Northwest grid’s 500-pound gorilla. But BPA’s grid build-out screeched to a halt in the 1990s (see chart below). Each bar represents the miles of high-voltage transmission lines BPA built per decade since 1960. 

Bar graph showing the lack of new transmission lines built, which has come to a halt lately compared to growth in previous decades
Shortcomings in BPA’s planning process explain some of this standstill. Like NorthernGrid, BPA plans its transmission system only 10 years in advance and does not model climate change or climate policies when determining whether to build new lines and where to locate them. Instead, BPA is entirely reactive: if a wind or solar developer needs transmission capacity and commits to shelling out for a new line, BPA will consider the project and may include it in its transmission plans. It will also build new capacity if necessary to meet
reliability standards. But it doesn’t proactively plan much of anything to help the region achieve climate targets. 

In April 2023 BPA announced it is considering six transmission upgrade projects that it claims will be sufficient for Oregon and Washington to meet their respective 2030 clean electricity targets. But BPA has refused to publicly share any data or analysis to defend these assurances, despite repeated requests from Sightline and others. It also claims to have modeled the grid’s needs even further into the future but has stonewalled Sightline and others who have asked for details. BPA confirmed its commitment to these projects in a July 2023 press release. However, the projects still need to go through environmental review, and BPA will only begin construction if developers agree to pay for the projects.  

This leaves only one longer-term transmission planning effort in Cascadia today, which doesn’t inspire confidence. The Western Power Pool’s 20-Year Extended Planning Horizon Study is a voluntary effort by BPA and most Northwest utilities that has already fallen months behind its own deadline. Study participants have yet to announce a new expected release date for draft results. 

A Western RTO to the rescue? 

One idea to address regional planning shortcomings is already on the table. In April 2022 FERC proposed a new rule that would require regional planning entities, including NorthernGrid, to map out transmission systems 20 years out instead of 10 and to better account for “changing generation mix, shifting demand patterns, and extreme weather.” However, the proposal is in purgatory; FERC is currently stuck in partisan gridlock. After Senator Joe Manchin withheld his support for the confirmation of FERC Chairman Richard Glick to a second term, only four of FERC’s five seats are full, evenly split between Democrats and Republicans. 

Even if FERC does finalize the rule, it might not help much in the Northwest given our lack of a Regional Transmission Organization (RTO), according to Ari Peskoe, Director of the Electricity Law Initiative at Harvard Law School. RTOs are nonprofit entities responsible for, among other things, maintaining the grid and planning new transmission lines. (For a good primer on RTOs, see this 2021 study that the Oregon legislature commissioned.) RTOs manage the grid for about two-thirds of the total US electricity load (see Figure 1 below). 

Figure 1: The Northwest is unusual in North America in its lack of an RTO. 

Map showing various regional RTO's, with the West mostly absent of any.

Source: ISO/RTO Council

RTOs differ from planning assemblies such as NorthernGrid in that they have their own staff and board and “at least some semblance of an independent organization,” Peskoe said. And some RTOs already boast proactive long-term transmission needs assessments even without the FERC rule change. California’s RTO, the California Independent System Operator (CAISO), released the gold standard of this type of analysis in 2022.4 (CAISO is the only RTO in the West, created by the California legislature in 1998.) Rather than cobbling together individual utility transmission plans, as NorthernGrid does, CAISO spearheaded its own study. CAISO worked backward from the state’s 100-percent clean electricity law, derived anticipated changes to electricity load and resource mix, and then identified $30 billion worth of transmission upgrades and build-outs needed to meet the state’s 2040 goal. Technically, CAISO’s “outlook” is not, in transmission-speak, a “plan” because it does not determine which transmission projects to build. Nonetheless, CAISO’s analysis gives utilities, regulators, and other transmission developers in California a clear road map. 

Since 1996 multiple attempts to create an RTO in the rest of the West have failed, but momentum may be shifting. A 2021 US Department of Energy Study found that a Western RTO would lead to benefits of up to $2 billion annually by 2030. That same year, the legislatures in Colorado and Nevada required utilities in those states to join an RTO by 2030. And BPA and Western utilities are taking baby steps toward regional integration. The Western Energy Imbalance Market, for example, now allows utilities to buy and sell energy across the region in real time, and the Western Markets Exploratory Group is a new collection of utilities evaluating options for regional electricity market solutions. 

An RTO could serve as solid scaffolding on which to build a new and improved transmission planning process in the Northwest. Although a worthy goal, an RTO does not, by itself, automatically lead to effective planning. 

“Utilities are very influential in the RTO process,” Peskoe cautioned. He explained that each RTO has its own structure and that some have been more successful at proactive regional transmission planning than others. And setting up an RTO across the West would take years due to contention around the governance of multiple utilities across multiple states, not to mention BPA, which is not under state or FERC jurisdiction. Realistically, a Western RTO is unlikely to emerge until the late 2020s to 2030s, according to Michael Wara, Director of Climate and Energy Policy at the Stanford Woods Institute for the Environment. 

With wildfire smoke polluting our air and overheated oceans decimating marine ecosystems, the Northwest doesn’t have until 2030 to develop a plan. The only big new transmission line in our region right now (the Boardman to Hemingway project) won’t break ground until later this year. Project backers first proposed it almost 20 years ago. 

We need a better way to plan, and we needed it yesterday. 

The best hope: State leaders taking the wheel 

With NorthernGrid and BPA asleep at the wheel, it’s time for Cascadia’s leaders to move to the driver’s seat. They are arguably the best hope for unleashing construction of transmission wires. Legislators have already taken some steps, including Washington passing a law in 2023 to extend utility planning to 20 years instead of 10 and establishing a Transmission Corridors Work Group that released a report in 2022 outlining principles for building new transmission lines in the state. 

But these efforts are small potatoes compared with what the climate crisis demands. The governors of Idaho, Montana, Oregon, and Washington would be smart to establish and convene a new regional transmission planning authority instead of relegating this most-essential task to NorthernGrid, BPA, and Northwest utilities. The primary purpose of the new assembly would be to answer the basic but currently vexing question: How much more transmission capacity does the Northwest need to decarbonize? A successful outcome would identify where transmission lines could and should go to leverage renewable resources efficiently and minimize harmful impacts on sensitive ecosystems while protecting tribal treaty rights.  

To be effective, the planning authority’s leadership would include tribal representatives, environmental activists, and state representatives, who today are completely sidelined during transmission planning discussions. State legislatures and the Northwest congressional delegation could demand BPA and utilities’ active participation, including requiring that they provide any forward-looking analysis and modeling they have already performed. Indeed, several groups, including the NW Energy Coalition are already meeting with leaders to float the idea for such a forum. With independent oversight, adequate technical staffing, and sufficient resources, this new entity could likely take mere months to accomplish what NorthernGrid and BPA haven’t in years.  

With a plan in place, state leaders could choose to take even more aggressive action, such as building lines themselves or directly authorizing utilities to do so, as Nevada legislators did in 2021 with NV Energy’s (controversial) GreenLink project. 

Time to map the course 

Coral reefs are dying, species are facing extinction, and millions of people are choking on smoky air. But the institutions in charge of some of Cascadia’s most critical clean energy infrastructure are acting like they don’t notice. Today’s transmission planning processes are reactive, shortsighted, insular, inscrutable, and willfully ignorant of impending changes to the region’s energy system. As a result, the Northwest has no real transmission plan, nor a process for developing one.  

Northwest states can no longer rely on NorthernGrid, BPA, or even a long-elusive Western RTO to prepare a realistic and independent transmission plan quickly enough. It’s time for a new approach. State leaders can step in  and convene a new Cascadia transmission planning body. With the right capacity, expertise, and commitment to combatting the climate crisis, this new group can map directions for the future grid. Once we know (and trust) where we’re going, we can finally hit the road. 

Without Gas, What Business Models Could Gas Utilities Pursue?

Find audio versions of Sightline articles on any of your favorite podcast platforms, including Spotify, Google, and Apple.

Between 2003 and 2018, about 55 percent of adults in the United States abandoned their landline telephones in favor of wireless ones. Phone companies that rode the wave of innovation and diversification reaped financial rewards, while those that stuck with the outmoded landline strategy faced demise.  

Like landline telephones, Cascadia’s gas utilities’ main business is quickly becoming obsolete. Gas companies are reckoning with disruption from all angles: consumers are buying electric heat pumps instead of gas furnaces, federal laws are boosting electric appliances, and new regulation is constraining gas customer growth. To survive, gas utilities will need to transform into enterprises that advance, rather than obstruct, the clean energy transition.  

To survive, gas utilities will need to transform into enterprises that advance, rather than obstruct, the clean energy transition.


Tweet This

The decarbonization solutions of hydrogen and renewable natural gas (RNG) that most gas utilities favor are unrealistic, dangerous, and expensive, and only in a few cases can they compete economically with electrification. But a few gas companies are experimenting with novel, climate-friendly ventures, including clean heat and electrification products and services.  

Some of these ideas, namely infrastructure-intensive heating investments like GeoNetworks and district energy, meet the traditional criteria for regulated utility businesses and merit active support from lawmakers and regulators. Indeed, leaders might do well to even require that utilities pilot them. Many other ideas do not meet these criteria, but they are still worth exploring for their potential to speed climate progress and to interrupt utilities’ continuing climate obstructionism. Policymakers considering the gas industry’s nontraditional reinvention proposals will need to take care to protect ratepayers, which will include extracting concessions from gas companies to shrink the gas system, and to shield smaller market competitors from economic injury.  

Why keep gas companies in business? 

For climate hawks, putting gas utilities out of business might seem like a top priority. However, it may be worthwhile to keep the industry solvent—in a reimagined, climate-friendly form—not only both during the decarbonization transition and well into the future.  

Here are four reasons gas business diversification is even worth considering:  

  • Preventing climate obstructionism. With dimming prospects, gas utilities have been using their clout in policy and regulatory forums to mislead the public and forecast doomsday scenarios about a world without gas. For example, NW Natural, Oregon’s largest gas utility, has been bankrolling a referendum campaign to reverse Eugene’s gas ban in new homes and has pumped more than $1 million into a front group fighting the city’s policy. If gas utilities could reinvent themselves as decarbonization enterprises that earn lucrative returns, not only might they stop fighting against climate action but they might also begin fighting for it.  
  • Leveraging scale. Decarbonization solutions will have a tough time scaling up fast enough without some coordinated roll-out across blocks, neighborhoods, and cities. Gas utilities might be up to the task. They already operate across large territories, with thousands of miles of pipes snaking under Cascadia’s cities and towns. Today these utilities count more than 4 million gas customers in the region.1Sources: EIA for Alaska, Idaho, Montana, Oregon, and Washington; and Statistics Canada for British Columbia.
    Leveraging gas utilities’ broad reach and expertise in the energy sector to advance building electrification could speed climate action. 
  • Protecting retirees’ savings. Utilities provide a steady income for millions of investors, most of whom are institutional investors focused in part on dependable returns for retirees. For example, investors in Puget Sound Energy, Washington’s largest utility, include four large Canadian pension holding companies charged with managing the pensions for public sector employees in Canada, and institutional investors hold 77 percent of the ownership shares in NW Natural. Failing gas utilities could jeopardize the nest eggs of millions of retirees, from Canada’s teachers and Washington’s firefighters to Oregon’s 401(k) holders.   
  • Maintaining gas system affordability and reliability. Today 52 percent of Cascadian households are hooked up to the gas system (see Table 1). This ratio will dwindle as new dwellings go electric and as existing ones convert to all-electric, but the customers who remain connected through the transition will still need reliable heat and hot water. New revenue strategies for gas utilities could help maintain their solvency while other policies compel them to shrink the pipeline system and address stranded investments.  

Table 1. More than half of Cascadian households are connected to the gas pipeline.

Total households Number of households that use gas Percentage of households that use gas
British Columbia 1,996,3991,250,35163%
Alaska260,000160,00062%
Idaho660,000430,00065%
Montana430,000270,00063%
Oregon1,650,000788,17748%
Washington2,940,0001,251,96343%
Totals7,936,3994,150,49152% (avg.)
Sources: EIA for US states; and Statistics Canada for British Columbia.

Of course, there are other ways to achieve these goals besides gas companies reinventing themselves. For example, regulators and lawmakers could protect ratepayers from unaffordable gas bills through financial mechanisms like accelerated depreciation or securitization, and institutional investors could and should divest from fossil fuels like gas as soon as possible to lower retirees’ financial risk. In the meantime, though, gas business diversification is worth exploring.  

Taking the gas out of the gas business  

Gas utilities are already beginning to experiment with new ventures that could keep their businesses afloat and allow them to claim a piece of the impending tidal wave of electrification spending. Three new business ideas include 

  1. providing clean heating and cooling solutions as thermal utilities, 
  2. offering non-heating clean energy products and services, and
  3. financing electrification.  

Let’s take them in turn.     

1. Providing clean heating and cooling solutions as thermal utilities

Instead of selling cubic feet of gas, a gas company could reinvent itself as a thermal utility that offers clean heating and cooling services. Under this model, the utility would provide homes or businesses with the necessary heating or cooling equipment, like an air-source or ground-source heat pump. The customer would pay a monthly fee to the utility that would cover the cost of the energy service and the equipment investment plus some profit for the utility. Customers would benefit by avoiding the upfront costs of clean and efficient heating and cooling equipment while enjoying the equipment’s output. The utility would benefit from a steady stream of revenue from the energy service the equipment provides.  

At least two US gas utilities are already venturing into this space with different strategies. 

  • Eversource, New England’s largest electric and gas utility, is piloting a thermal utility approach with GeoNetworks (which Sightline has written about extensively). The utility will be providing heating and cooling services to 45 buildings in Framingham, Massachusetts, using a networked geothermal system to pull heat out of the earth in the winter and put it back into the ground during the summer. Eversource is paying the upfront costs and installing all the equipment needed to heat and cool the subscribed building for the pilot (e.g., heat exchangers, geothermal ground loop). Customers will pay a monthly fee proportional to the amount of heating or cooling they request. Eversource’s gas customers will ultimately pay for the cost of the geothermal equipment through their rates, much the same as they would were Eversource to invest in a gas pipeline.   
  • VGS, Vermont’s only gas utility, launched an electric appliance leasing program for heat pump water heaters in 2022 and extended it to centrally ducted heat pumps in 2023. Customers pay $29–$46 per month for heat pump water heaters and $58–$100 per month for centrally ducted heat pumps, depending on the equipment size and customer’s address. Using its existing technician staff, VGS offers customers installation scheduling and around-the-clock service. Vermont regulators allow the utility to earn a regulated rate of return on the equipment it purchases for the program, the same way it would on gas pipeline investments. In a nod to the benefits of electrification, regulators in Vermont also permit VGS to offer these electric appliance leases outside of its gas service area, swelling its opportunity for new revenue.  

2. Offering non-heating clean energy products and services 

In addition to switching heating systems from fossil fuels to clean electricity, households and businesses will need to decarbonize other appliances and vehicles, access clean electricity, and invest in energy efficiency. Incentives like those outlined in the Inflation Reduction Act will encourage them to do so. Savvy gas utilities could capture some of this growth market.  

At least two gas utilities are pursuing programs that advance clean energy goals beyond heating conversions. 

  • New Jersey Resources, the holding company for New Jersey Natural Gas, has diversified by bringing solar to more than 8,500 customers through its unregulated Home Services subsidiary, NJRHS. Since 2010 the NJRHS Sunlight Advantage program has installed, operated, and maintained solar generation systems on homeowners’ rooftops with service terms that offer savings of up to 40 percent on electricity bills. Under this model, NJRHS owns the solar generator on the customer’s roof and maintains the system. It charges the homeowner a monthly fee for the power the system generates. It’s a win for the homeowner, who locks in a fixed power cost that is often below market rates for electricity, and it’s a win for the service provider, which earns a low-risk multiyear revenue stream and qualifies for generous federal and state subsidies for solar.  
  • Duke Energy One, an unregulated subsidiary of North Carolina-based utility Duke Energy, offers a suite of electrification services for business customers nationwide through its Direct Efficiency program. Options include Efficiency-as-a-Service (EaaS),2EaaS is a business model whereby customers pay for energy efficiency in their buildings on a subscription basis without having to make any upfront capital investments.
    EV charging, battery storage, and microgrids. In its EaaS program, Duke Energy One works with customers to assess energy and carbon usage and identify savings opportunities. Once contracted by the customer, Direct Efficiency staff designs, installs, and maintains equipment to meet the customer’s energy savings goals, with no upfront costs to the customer. The customer pays back a portion of the monthly savings from the project, generating income for Duke Energy One. Duke Energy One is also offering EV charging.     

3. Financing electrification 

Finally, utilities might diversify into lending services for new, clean electric appliances or other electrification upgrades. Instead of a rate of return on infrastructure investments, the utility would earn interest on consumer loans, much the same as a bank would. But unlike a bank loan, utilities could offer on-bill financing, which puts the customer’s monthly payment for the loan directly on their utility bill. This model could extend financing to customers who might not qualify for a conventional loan, as customers’ utility payment history would back their creditworthiness. In a well-crafted program, customers’ monthly savings from the new, efficient equipment would fully offset the loan payment. For customers who terminate gas service in conjunction with the loan, gas companies could partner with the customer’s electric utility to put the loan repayment plan on their electric bill. 

Sightline is not aware of gas utilities exploring this type of green financing model yet, but on-bill financing programs and clean energy loans are not new. Cascadian utilities, including Avista, Seattle City Light, and Orcas Power and Light (OPALCO), all offer on-bill repayment of loans for energy efficiency projects such as installing a heat pump or insulating a home. In British Columbia, the provincial government has set up a low-interest loan program to help homeowners finance the switch from fossil fuel heating systems to heat pumps. While these financing programs have their merits, none earns interest or profits for the utility. Third-party financiers (e.g., Financeit Canada, Puget Sound Cooperative Credit Union, and CRAFT3) and federal agencies (in the case of OPALCO) provide the capital for the loan, typically offering below-market rates for these programs as an incentive to encourage homeowners to upgrade their energy efficiency. If utilities were to independently explore lending and financing programs, they would need to fully investigate the market potential and income opportunities for lending money at or below market rates while continuing to protect ratepayers.   

In British Columbia, some government-led lending programs for homeowners encourage electrification and energy efficiency investments.  The northwest corner of the United States, however, unlike many other states, does not have “green banks,” which lend public (or sometimes private) funds to homeowners for electrification and energy efficiency.3Green banks are public or nonprofit financing institutions that use public and/or private capital to underwrite clean energy projects that reduce emissions, such as electrification, renewable energy, and energy efficiency. They are not traditional banks in that they do not have depositors, nor do they offer traditional banking services.
With the public lending door closed for now in Alaska, Idaho, Montana, Oregon, and Washington, and very few banking competitors offering these loans, a potential opportunity exists for the states’ utilities to fill the gap.  

A key question for policymakers: Should Public Utility Commissions regulate utilities’ new, climate-friendly business lines?   

Today’s gas utilities operate as regulated monopolies, which state and provincial laws authorize to sell gas within the bounds of a given service territory. But state and provincial laws do not authorize gas utilities to sell heat or electric appliances or offer banking services as regulated business lines.4 British Columbia provincial law does regulate utilities selling thermal energy (heating and cooling), although the thermal energy regulation is different than that for natural gas utilities.
With their regulated status, utilities and their shareholders enjoy a guaranteed rate of return on capital investments and exclusive rights to serve customers in their service territory. In exchange, utilities must provide safe, available, reliable, and reasonably priced energy under regulator supervision. 

Because of these perks, utilities are likely to want to maintain regulated status for any new ventures and to expand the types of investments on which they are allowed to earn a rate of return. (Under traditional regulatory models, utilities can only profit on infrastructure investments like new pipelines or meters.) In fact, Cascadian gas utilities are already proposing changes to what they can earn a regulated profit on. Washington House Bill 1619, a policy proposal the gas industry supported in the state’s 2023 legislative session, would have authorized gas utilities to earn a regulated rate of return on investments in rooftop solar, battery storage, community solar, and ground-source heat pumps. (It also would have broadened the opportunity for utilities to invest in RNG.) And House Bill 1589 would have opened the door for PSE to propose decarbonization schemes, including new business ventures that lower carbon emissions through electrification. PSE would earn a rate of return through the familiar regulatory process. Neither of these bills would have prevented other businesses from offering similar products and services or competing directly with gas utilities.  

But not all new potential gas business models meet the traditional criteria for utility regulation, which include:  

  • the business providing essential services for public well-being, and 
  • a single provider being able to serve the overall demand at a lower total cost than any combination of smaller providers could (i.e., it is a natural monopoly). 

Of the three business ideas above, only some forms of the first model (heating and cooling services) meet these criteria. That’s because heating and cooling is an essential service, and some versions of this model, namely GeoNetworks and district energy, effectively function as a natural monopoly given the large infrastructure outlays they require. (It is illogical to have multiple companies lay networks of pipes and compete to deliver heating services under a single street.) As such, it makes sense for policymakers to allow or even require utilities to pilot these ideas as regulated businesses and, in turn, protect consumers against unreasonable rate hikes and abrupt termination of essential heating and cooling services.  

By contrast, heating and cooling services that do not require large infrastructure investments don’t meet these traditional criteria for utility regulation,5In this discussion, “regulation” specifically refers to state agency regulations for utilities that govern prices, resource planning and acquisitions, reliability, quality of service, and return on investments.
nor do non-heating energy services and electrification financing. None of these is an essential service, and they all face low barriers to competition. (Think of the many rooftop solar installation companies, for example.) To date, it is largely unregulated subsidiaries of utilities that have ventured into non-heating and cooling energy products and services. (Any new lending services would certainly need to be regulated in some way to protect consumers, but not by public utility commissions.) 

And expanding utility-regulated status to nontraditional ventures could be risky. Competitors like heating, ventilation, and air conditioning (HVAC) companies may challenge the utility’s entrance into the market, as they did a few years ago. In 2018, HVAC industry associations helped tank PSE’s pitch for a new water heater, furnace, and heat pump leasing program 

Nonetheless, the urgency of climate change demands that policymakers and regulators explore options beyond business as usual. Some risks may be worth accepting if these new ventures end utility obstructionism, maintain gas system reliability during the transition away from gas, speed decarbonization, and protect retirees’ nest eggs.  

And policymakers and regulators can lower the risks to ratepayers by requiring concessions from the utilities, such as that they proactively shrink their gas footprint, not invest ratepayer money in new gas pipelines, and accept lower rates of return than utilities have historically enjoyed on gas investments. (For a fuller discussion of these ideas, see Sightline’s recent article on gas decommissioning and neighborhood electrification.) Ultimately, policymakers interested in having gas companies join “Team Climate” will need to recruit them in a way that protects ratepayers and smaller competitors.  

Policymakers could pave the way for gas companies’ cleaner future   

As Cascadia decarbonizes its economy, gas is certain to meet a necessary demise. But gas utilities don’t necessarily have to face the same end if they start exploring new, climate-friendly revenue opportunities. A few utilities are already venturing into new business models like thermal utilities and clean energy services to replace the fossil-fueled revenue streams that are slated to disappear in the coming decades. And there are good reasons to want gas utilities to exist in this reimagined form. Top among them: providing stability to gas consumers and preventing utilities’ ongoing climate obstructionism.   

But these new business lines pose new challenges for policymakers and regulators. While utility regulation made sense for gas companies when their chief business was building expensive pipelines that snake beneath roads and private property, some new business ventures into competitive markets don’t meet traditional regulatory criteria. Nonetheless, gas companies are pushing for this status for new lines of business because of its guaranteed profit and familiar model. Policymakers and regulators considering regulatory innovation that could speed climate progress will need to proactively build in mechanisms to protect consumers and other business competitors from gas utilities’ overreach.  

Idaho, Montana, and Washington Could Save $30 Million by Moving Local Elections to National Election Day

Find audio versions of Sightline articles on any of your favorite podcast platforms, including Spotify, Google, and Apple.

In 2019 Wayne Thorley, then Nevada’s Deputy Secretary of State for Elections, promised a state legislative committee that Nevada taxpayers could “save a lot of money.” The trick, Thorley said, was to pass a low-profile bill to reschedule local elections so that they would be on the same ballots as federal ones. Millions of dollars of savings, he claimed, were there for the taking through election consolidation. 

Thorley’s argument was not unusual. Cost savings are a routine refrain in legislative discussions of consolidation. I have heard them invoked repeatedly, like a mantra, in election rescheduling hearings in Arizona, California, Montana, Nevada, and Washington. Over and over, from the left and the right, proponents point out that synchronizing elections not only commands overwhelming popular support, boosts turnout, improves government accountability, and brings out a more representative electorate but also saves money. 

How much money, though? Thorley didn’t say, and few others have offered estimates. 

The potential economies are large, no doubt. The cost of running local elections at off-cycle times (that is, at times other than Election Day in November of even-numbered years) runs to tens of millions of dollars a year in Cascadia. In the United States, it amounts to perhaps $2–$5 billion per year nationwide. 

An elections-cost calculation usable for any city or state 

As far as I can tell, though, no one has ever conducted a meticulous, CPA-proof before-and-after study on how much money election consolidation would save. And no one has documented the change in spending in cities that have moved their local elections to align with federal ones. 

That is surprising, given the near-violent controversy over the fairness and security of voting systems in the United States. You might assume that every aspect of the country’s elections would have been audited in excruciating detail. Instead, the question of voting schedules is a weird, neglected backwater of election debate and its costs little attended. 

Election budgets are buried in larger budgets for county clerks or auditors and for various city or state bureaus, and they are rarely analyzed separately. These budgets are also dwarfed by other spending categories and therefore draw little scrutiny. Charles Steward III, a political scientist at MIT, wrote, “The estimated cost of conducting elections on an annual basis is roughly what local governments spend managing public parking facilities.” 

In other words, it’s crumbs. 

In this article, I offer a back-of-the-digital-envelope estimate for three Cascadian states that hold off-cycle elections and their main cities. The analysis method I use is admittedly crude; I based it on all the data points I could assemble, though I could not find many data points. However, the method allows anyone anywhere to estimate potential savings for their own off-cycle city or state elections, and it’s simple and transparent enough to allow for quick upgrades as data improve. 

Examples of elections-cost savings from Idaho, Montana, and Washington 

Sightline estimates potential savings in Idaho, Montana, and Washington, the three Cascadian states that could easily move their municipal elections to Election Day, to be more than $30 million per two-year election cycle.  

The method used to determine these savings, detailed in the appendix, is simple and built from real-world examples. First, I estimated the range of total Cascadian spending for off-cycle elections based on expenditure data from two local examples: King County, Washington, and Anchorage, Alaska. Second, I estimated potential savings from two other local examples: a set of on-cycle and off-cycle elections in Nevada cities and a before-and-after estimate from the city of Concord, California. And third, I reality- checked each of these examples against other data points I could find.  

From these examples, I created a two-by-two matrix: high cost and low cost, and high savings and low savings. The matrix yielded four scenarios that ranged from savings of under $18 million to almost $47 million. These estimates included each municipality (incorporated city or town) in these states. In the case of Seattle, for example, projected savings amount to $3.2 million per biennium (see Table 1). Savings in Boise, Idaho, are estimated at $1.1 million every two years. 

The savings for any jurisdiction not listed can be estimated using the methods described below. At its simplest form, the method suggests multiplying the US Census Bureau’s estimate of citizens of voting age for any municipality by an average savings of $5.92 per biennium to estimate savings from election consolidation. 

Table 1. Idaho, Montana, and Washington could save millions of dollars by moving municipal elections to federal Election Day.
Estimated potential savings from election consolidation in Cascadian off-cycle states and their cities with a population of ≥ 100,000, per two-year election cycle

(millions)
Idaho (all municipalities)$5.4
Boise$1.1
Meridian$0.5
Montana (all municipalities)$4.4
Billings$0.5
Washington (all municipalities)$20.6
Seattle$3.2
Spokane$1.0
Tacoma$1.0
Vancouver$0.8
Bellevue$0.5
Kent$0.5
Everett$0.5
Renton$0.4
Spokane Valley$0.5
Total$30.5

Source: See appendix.

States would save “a lot” from consolidating elections 

These estimates stem from a small set of real-world examples. Thorley was not exaggerating when he quantified savings as “a lot.” The budget figures he presented, displayed in the chart below, show an average savings of 88 percent per active registered voter. If anything, these figures underestimate the gap between on-cycle and off-cycle expenses in Nevada because they do not include election department staff time in the off-cycle cities. Thorley’s data, covering 2014–2018 for cities in Nevada’s two most populous counties, illustrate the pattern evident in other comparisons among jurisdictions. 

Table showing the costs of running elections on on and off year (and the drastic differences between)For example, a 2013 Greenlining Institute study of six California cities (half of them on-cycle and half off) found that on-cycle elections cost 92 percent less per ballot cast. In 2015 legislative analysts in Sacramento noted that San Diego’s 2012 on-cycle election cost that city only 1 percent as much per voter as Los Angeles spent on its 2011 off-cycle election. With ratios like these, even with vastly higher turnout in on-cycle elections, total expenses would still shrink markedly. The city of Concord, California, for example, projected an overall savings of 57 percent from switching to on-cycle elections. 

In Arizona, even small cities that switched to on-cycle elections have reportedly been saving hundreds of thousands of dollars per election. And in big cities, the savings may even be in the millions. Joe Gloria, CEO for Operations at the National Association of Election Officials and former Clark County (Nevada) registrar of voters estimated that the savings in Las Vegas and the four other cities in Clark County exceeded $5 million per election cycle after the change to on-cycle elections. And in 2022 San Francisco’s comptroller estimated the savings from shifting five city executive elections to on-cycle at almost $7 million every two years. 

Local officials can sharpen the estimates from this initial calculation 

These figures are not definitive because actual savings depend on the particulars of each case. Balloting methods and costs vary widely, and big savings only come when a jurisdiction can cancel entire elections. Shifting the mayor’s race to the main Election Day but leaving other local elections such as those for school board on the old schedule, for example, might preclude savings. What’s more, the method estimates total savings but does not indicate to whom the savings will accrue since the division of expenses among localities, counties, and state governments varies by state and county. 

For the purposes of this exercise, I assume that election consolidation means moving all local elections on-cycle and canceling the off-cycle local election dates. Beyond that, though, administrative details matter, such as:  

  • How many local elections a jurisdiction has per biennium; 
  • Whether all off-cycle races and questions fit on the ballots that would have already been printed; 
  • Whether nonpartisan local races need different ballots in primary elections, as do partisan state and federal races; and 
  • How much extra work is required to customize ballots for different jurisdictions. (Election administrators often generate dozens of ballot variations to reflect the different offices and questions before voters in different precincts.) 

To improve these estimates, budget writers for each county’s election administrator could scrutinize their expenses line by line, separating fixed costs from incremental ones and developing precise numbers to specify election consolidation’s potential costs and benefits. What’s more, before-and-after analyses from cities that have already consolidated their elections would give us a much clearer picture of these impacts.  

In the interim, these estimates provide a starting place for grasping the scale of potential savings from election consolidation. It appears to be large (on the order of $30 million of savings every two years in just three states) and would do something that voters want anyway. 

Appendix: Methods 

Estimating the savings from election consolidation is challenging. I found no peer-reviewed studies that examined the question and surprisingly few analytic reports from any source. Election agency budgets are not usually broken out per election, and many election agency budgets are lumped in with the larger budgets of the county clerk offices where they reside. When jurisdictions calculate state costs per election, they do not often share their definitions or methods, making numbers difficult to compare. Few jurisdictions that estimate costs per election make clear whether the estimates cover only that jurisdiction’s own costs or whether they include other jurisdictions’ costs. In California, for example, cities are typically required to pay all the costs of off-cycle elections but only a few of the costs of on-cycle elections, which counties usually pay. Consequently, cost savings to cities may partly be offset by cost increases to counties. I have seen estimates of costs per ballot cast in off-cycle elections vary from pennies to more than $50. Costs do vary, of course, but in the absence of a uniform set of accounting practices, it’s hard to say anything about these values with confidence. 

In this method, I estimated Cascadian spending for off-cycle elections from two local examples. Then I estimated savings from two other examples. Finally, I reality-checked these examples against other data points. 

In all estimates, I ignored British Columbia, the Canadian part of Cascadia. The province cannot realistically synchronize local elections with provincial or federal elections because those elections are not scheduled in advance but can be initiated by the provincial or federal government on short notice. Municipalities therefore cannot consolidate their elections. 

I also omitted the Cascadian state of Oregon and the states of California and Wyoming, which are partially in Cascadia, because they conduct all or almost all their municipal elections on the national cycle. I discuss Alaska but did not include it in the summary table because its three-year municipal terms of office make consolidation a much more difficult policy change, while elsewhere consolidation is just a matter of changing an election schedule.  

I focused on Idaho, Montana, and Washington because they currently require municipalities to vote in November of odd-numbered years and they all considered legislation in 2023 to allow or require election consolidation. That said, the method of estimating used here could be applied to any state or city in which municipal elections are off cycle. 

Calculating total cost of off-cycle elections 

To estimate the range of total spending for off-cycle elections, I used two cases.  

Case 1: High cost (King County, Washington) 

King County, Washington, is Cascadia’s most populous county, with more than 2 million residents, 39 municipalities, and dozens of school districts and other local election jurisdictions. King County Elections is a leader in elections administration and known for its technical sophistication and reliability. It also conducts many elections because Washington gives localities four opportunities to hold elections in most years and five in presidential-election years.  

King County Elections estimates the average total cost of off-cycle elections, including February and April elections in even and odd years, plus odd-year primary and generals elections, at $15.3 million per two-year cycle, based on a decade of data. In 2021 King County had a citizen voting age population of a little more than 1.5 million, according to the most current data from the US Census Bureau’s American Community Survey (ACS) five-year estimates. Per citizen of voting age, therefore, King County will pay $9.98 for multiple off-cycle elections in a two-year period. This estimate more likely understates than overstates current costs because it averages ten years of expenses, without regard to inflation or the county’s rapidly growing population. 

In my estimates I rely on citizens of voting age rather than registered voters or ballots cast because the US Census Bureau regularly generates estimates for citizens of voting age in most US jurisdictions, and this figure is not influenced by the many exogenous factors that affect voter registration and turnout. By calculating off-cycle election costs and potential savings from consolidation as a value per citizen of voting age, I came to a method for generating at least rough estimates for any US municipality (or state) with off-cycle elections.

The King County estimate of $9.98 per voting age citizen is consistent with cost estimates from elsewhere and may be conservative. It’s lower, for example, than the cost of Georgia’s 2022 US Senate runoff, which was an estimated $75 million, or almost $10 per citizen of voting age in the state. (Keep in mind that this figure is for the runoff only, not the primary election or other off-cycle elections during a two-year cycle.) Similarly, in 2022, the elections budget in Missoula County, Montana, was $12.78 per citizen of voting age. New York City’s budget for its 2021 off-cycle municipal election worked out to $10.48 per citizen of voting age. 

Idaho, Montana, and Washington’s combined population of voting-age citizens who reside in municipalities, according to the ACS, is 4.9 million. Assuming that King County’s election costs are typical, off-cycle municipal election costs per two-year period in these states is $48.6 million. 

Case 2: Low Cost (Anchorage) 

Most US elections are conducted by county governments, and those governments do not (and, in some ways, cannot) disentangle the costs of conducting off-cycle elections from on-cycle ones. Some costs are fixed, such as salaries and benefits for the core staff of these agencies, who are always managing operations, planning for security and upgrades, maintaining voter rolls, buying and repairing voting machines and ballot tabulators, recruiting and training poll workers, collaborating with elected leaders on policy questions, and otherwise keeping the elections infrastructure in working order. Counties typically conduct at least two elections a year and sometimes even four or five, such as primary and general elections, runoffs, special elections, and low-profile bond measures and levies. How to allocate overhead costs among these various elections is ultimately a matter of accounting conventions and judgment calls. 

But Alaska is different, and that difference opens a window into the cost of freestanding municipal elections. In Alaska, the state government itself conducts state and federal elections, while city governments conduct local elections.1To further complicate things, Alaska does not have counties but instead has boroughs. The largest cities, such as Anchorage, are combined cities and boroughs.
These elections never happen at the same time, and they are conducted by different agencies with different staff members, equipment, and protocols. 

The city of Anchorage’s elections budget shows what it costs to run independent local elections. Since 2014 Anchorage has spent about $600,000 on each of its main municipal elections, which are in April. That’s $2.84 for each citizen of voting age. Anchorage has spent additional amounts for various runoffs and special elections over the years, bringing the average annual total costs to $670,000, or $3.17 per year for each citizen of voting age. To make this estimate comparable to the King County biennial estimate, I doubled it to $6.34 because Anchorage conducts elections every year, none of which are on cycle. Extrapolating from Anchorage’s figure to all municipalities in the three off-cycle Cascadian states, the total two-year cost of off-cycle elections is close to $31 million. 

A reality check for this figure of $6.34 comes from Minneapolis, Minnesota, where an analysis of election consolidation estimated a savings of $1.4 million in 2017, which works out to $4.70 per citizen of voting age that year. (That’s less than the Anchorage estimate but not wildly divergent.) Another reality check depends on the cost per ballot cast, a different measure of election cost. In Anchorage, the average cost per ballot cast was $9.79  for the city’s regular municipal elections between 2014 and 2021. This figure is in the same range as other estimates of cost per ballot cast in elections. For example, nonprofit organizations FairVote and Third Way surveyed election administrators in Texas and Louisiana about the costs of primary and runoff elections in 2018 and 2020 and found an average cost of $7 per ballot cast. 

Calculating potential savings 

To get from these estimates of the total costs of off-cycle elections to estimates of potential savings from consolidating local elections, I considered two cases: low savings and high savings. For low savings, I relied on the 57 percent savings projected in Concord, California. For high savings, I relied on Nevada’s 88 percent savings rate by comparing election costs in on-cycle and off-cycle counties. (As a conservatism, I disregarded Greenlining Institute’s 92 percent savings and San Diego’s 99 percent savings.) One weakness with these cases is that neither estimate makes clear whether its scope encompasses election costs for all levels of government or only those of municipal governments. If these estimates cover municipal but not county budgets, for example, they may overstate potential savings. Conversely, the Nevada data may understate the savings. In his presentation, Thorley noted that the data exclude the cost of county staff time devoted to off-cycle elections; including those costs would increase the savings to more than 88 percent. 

Table 2 shows a two-by-two matrix of these cases and displays estimated savings per citizen of voting age, per two-year election cycle, which average to $5.92. Multiplying these products by municipalities’ citizen voting age population yields a rough estimate of savings under the four scenarios and under their average (see Table 3).

Table 2. Sightline’s preliminary method finds that election consolidation could save $3.61 to $8.78 per citizen of voting age, per biennium.

Low cost of $6.34/voting-age citizen (Anchorage)High cost of $9.98/voting-age citizen (King County)
Low savings of 57% (Concord, CA)$3.61$5.69
High savings of 88% (Nevada)$5.58$8.78

As a reality check for these estimates, I used the City of San Francisco comptroller’s 2022 estimate that local election consolidation there would save $6.9 million per biennium. This estimate comes to savings of $10.73 per citizen of voting ages, which makes my estimates seem conservative. Similarly, as noted above, Gloria, as former registrar of voters for Clark County, Nevada, estimated the financial savings of on-cycle election in his county at more than $5 million per year, with the savings per citizen of voting age landing at about the bottom end of the range in this matrix. 

For the three Cascadian off-cycle states, I calculated potential savings ranging from under $18 million (for the low-savings, low-cost scenario—Concord savings and Anchorage costs) to nearly $47 million (for the high-savings, high-cost scenario—Nevada savings and King County costs). The average savings is more than $30 million. 

Table 3: Potential Savings from Election Consolidation, in Cascadian off-cycle states and their cities of 100,000 people or more, per two-year election cycle

Low Cost (Anchorage)High Cost (King County)
PlaceHigh savings (Nevada)Low savings (Concord, CA)High savings (Nevada)Low savings (Concord, CA)Average
(millions of dollars)
Idaho (all municipalities)5.13.38.15.25.4
Boise1.00.61.61.01.1
Meridian0.50.30.70.50.5
Montana,(all municipalities)2.61.78.15.24.4
Billings0.50.30.80.50.5
Washington (all municipalities)19.512.630.619.820.6
Seattle3.12.04.83.13.2
Spokane1.00.61.51.01.0
Tacoma0.90.61.40.91.0
Vancouver0.80.51.20.80.8
Bellevue0.50.30.80.50.5
Kent0.50.30.70.50.5
Everett0.40.30.70.40.5
Renton0.40.30.60.40.4
Spokane Valley0.40.30.70.40.5
Total27.217.646.830.330.5

Thanks to Sightline researcher Todd Newman and to professors Zoltan Hajnal (University of California, San Diego), David Kimball (University of Missouri–St. Louis), and Zach Mohr (University of Kansas) for their review comments on an earlier draft of this article.