Update 7/20/23: Beaverton, the state’s seventh-largest city, unanimously voted to join the club and remove mandatory parking citywide.
In cities across Oregon, parking mandates are going out not with a bang, but a whimper.
“It’s sort of been a sleeper issue here,” said Anne Catlin, the comprehensive planning manager for Albany, Oregon. When Albany repealed minimum parking requirements citywide earlier this June, not a single person from the public testified. Catlin didn’t recall the topic even making the newspaper.
Normally, parking is one of the most contentious issues for local governments. Any relaxation of parking mandates—rules that prescribe a certain minimum number of parking spaces for any new home or business—is a political hot potato. But new state parking rules have taken that status quo off the table and turned what could be a big debate into a boring compliance exercise. “There really isn’t much to provide input on,” said Sandy Belson from the City of Springfield. “We’re just going to comply with the rules.”
By June 30, affected jurisdictions could choose to either eliminate all parking mandates or enact a host of more complicated regulations if they wish to retain minimums in some instances. The two other compliance paths include regulations ranging from pricing one in ten on-street parking spaces, to separating the cost of parking from rent, to creating parking benefits districts. All of which would take additional staff time and oversight.
Planners for the City of Salem summarized the new rules succinctly in this image:
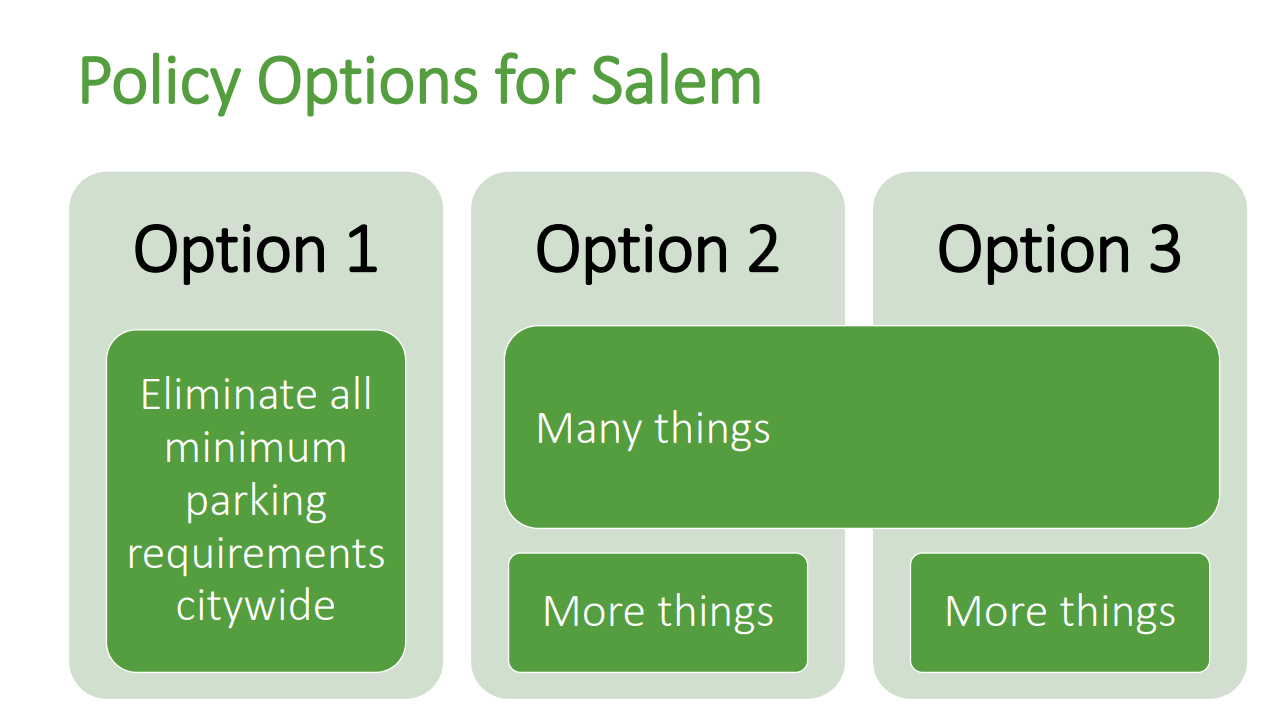
Summary of policy options presented to the Salem Climate Action Plan Committee by city staff. City of Salem.
At least seven cities have voted to go with the simple but sweeping Option 1: Portland, Salem, Corvallis, Tigard, Bend, Albany, and Central Point. Now over a million Oregonians live in communities where parking is fully voluntary. More cities are poised to join them the next year, after using a deadline extension granted by the state.
Transit proximity already removed parking mandates from majority of lots
Removing all parking minimums wasn’t the dramatic leap it would have been a year ago. Last January, state rules lifted parking mandates for all properties within a half-mile of frequent transit corridors and within three-quarters of a mile of rail stations. City-generated maps have revealed that those areas constitute the majority of lots in many cities. In Corvallis, those transit-adjacent areas covered 65 percent of the city. For Gresham, 53 percent. In Tigard, 62 percent.
The slivers of city not included were likely to be low-density residential neighborhoods, industrial land, or open space. “Most of our city falls within a half-mile of our transportation corridor,” Catlin said. “It was an easy decision.”


In Corvallis, city planners recommended removing all minimums because bus service can change over time. If transit service were downgraded, building owners might suddenly find themselves needing to add more parking to stay legal. Service-dependent rules could also give residents who like parking mandates a reason to oppose transit upgrades, thereby deepening transportation inequities.
Transit service changes are already putting zoning maps in flux. A planned improvement to bus line 71 in Milwaukie this upcoming September would have increased the fraction of the city without minimum parking requirements from 78 percent to 95 percent. Rather than keep adjusting things, they plan to fully eliminate parking mandates later this year.
In addition to areas near transit, the state has also done away with parking mandates for a long list of uses for equity reasons, including for affordable housing, small residences, childcare facilities, and more. Those rules will give more flexibility to housing projects like a senior care facility that had its expansion plans scuttled over two parking spaces last year.
State rules reduce barriers to new businesses
Local governments are often well aware of the specific sites, like oddly shaped lots or old buildings, where parking minimums pose barriers to redevelopment. But before Oregon’s state rules, they didn’t have a lot of options for reforming those counterproductive codes without an arduous political process.
One difficult property is a former restaurant in downtown Central Point, a small city outside Medford, that closed before the pandemic. After any six-month gap in use, city law requires any new user of the building to comply with current land use code, even if it hadn’t been up to code before.
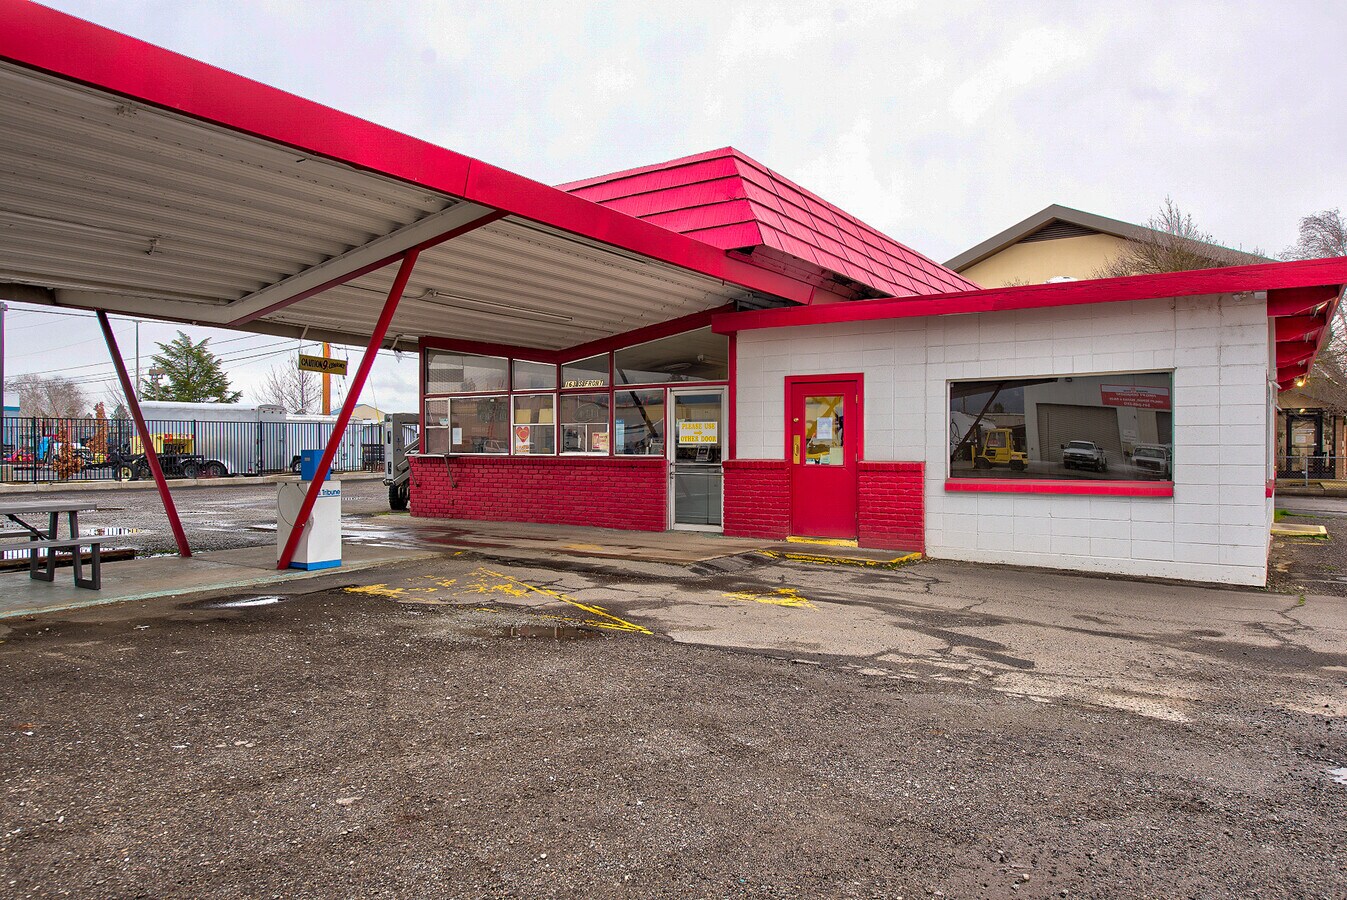
This empty 1964 building has a non-conforming parking lot, adding a barrier to re-use. Image by Loopnet.
That is no small task for this site since the current gravel lot wouldn’t meet the city’s requirements for a parking lot. “Anybody who purchased this property and developed it would be required to pay for the parking lot, have it striped, landscaped accordingly, and then provide the required stormwater quality and quantity management facilities,” said Stephanie Holtey, planning director for the city of 20,000. “The improvements for those facilities are pretty expensive.”
The planning department was planning to amend the code to give downtown properties like this relief from parking minimums, but with only two planners on its staff, the city couldn’t have started a process to consider various possible code changes until 2024. But now, the mandates are simply gone and the job is done.
The City of Tigard was Oregon’s first to officially repeal mandates citywide back in January. Tigard had already exempted some areas of the city, like downtown and the Tigard Triangle, from parking requirements. But elsewhere, parking minimums have still regularly caused headaches for Tigard. They can be a particular problem for commercial buildings whose parking lots are stuck at the same size as different businesses come and go over the years.
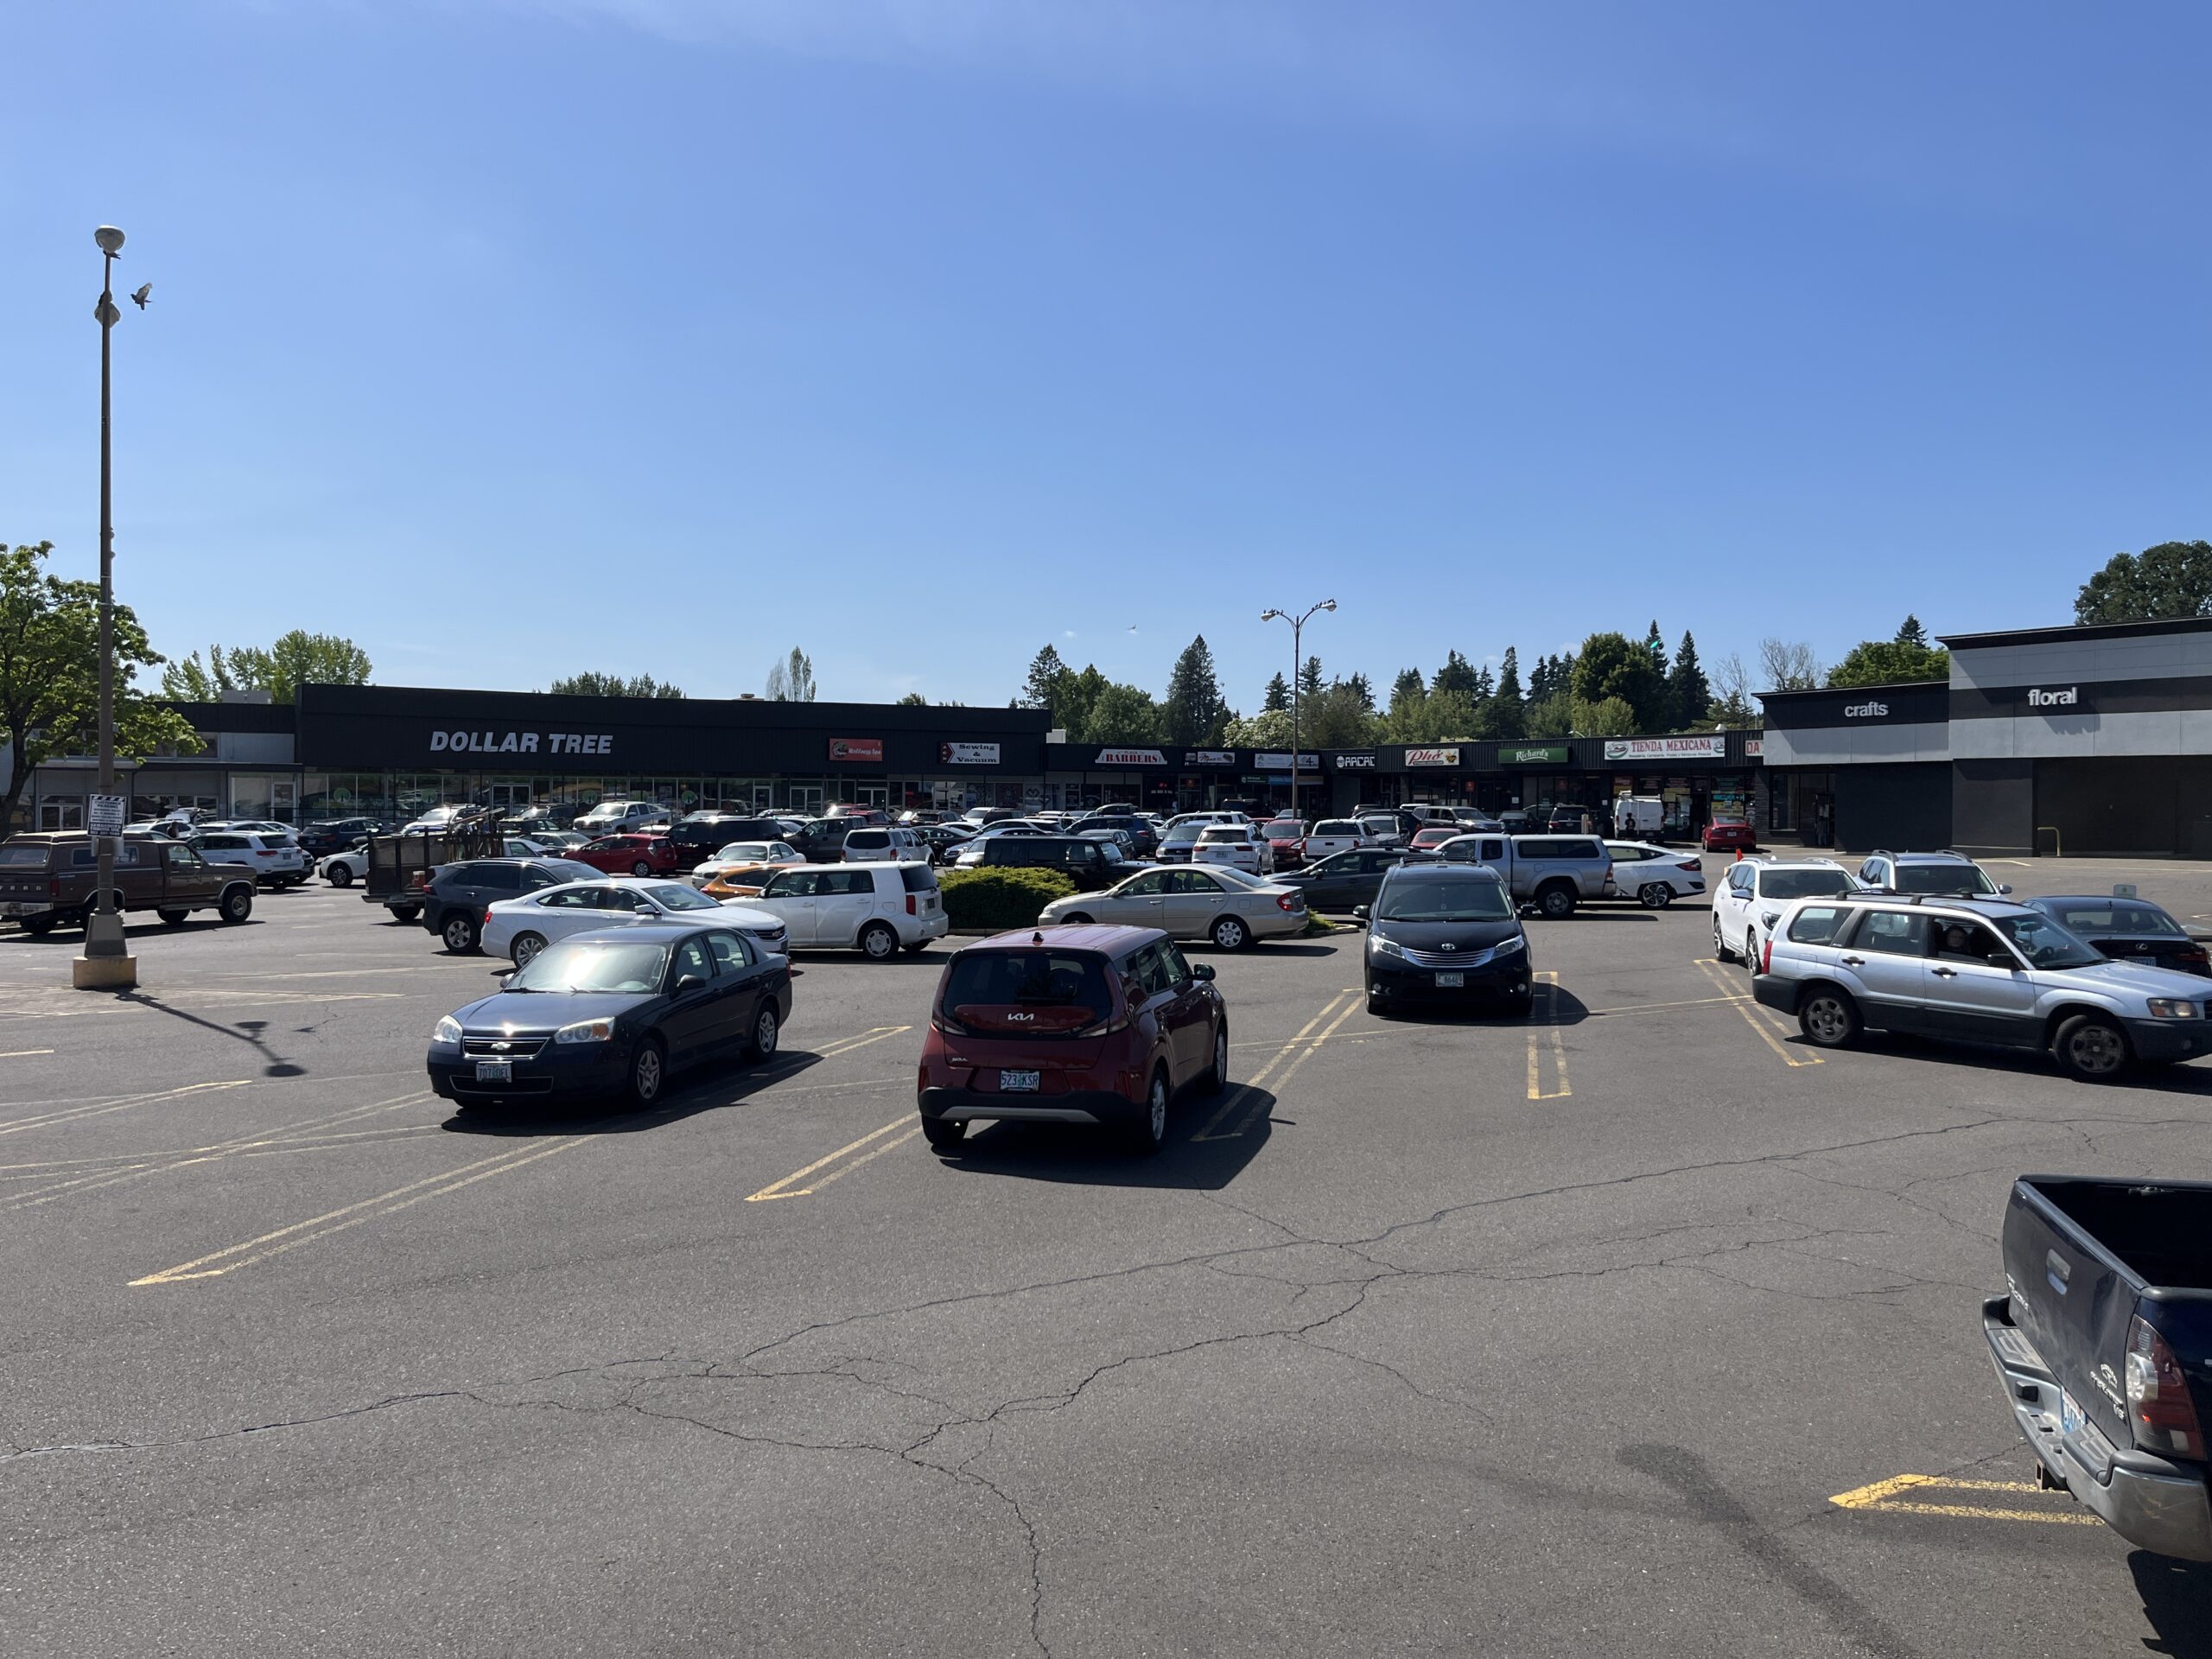
Tigard Plaza. Photo by Catie Gould.
One of those businesses is owned by Jordan Elting. Obsessed with arcade games since he was a kid, he finally opened a brick-and-mortar arcade in February of 2022. It didn’t take long for the customers to start asking if they served beer. They didn’t. But demand was high enough that Elting put in his application for a state liquor license soon afterward.
For nearly a year, his application couldn’t be approved because the new building use, now categorized as entertainment, required roughly 40 percent more parking than the former retail store that vacated the space two years prior. Meanwhile, Elting was watching potential revenue walk out his door. Later in the evenings, groups of adults would sometimes take off after learning there was no beer.
Elting pointed out that several other businesses in the strip were already allowed to serve alcohol, and there was a second parking lot on the other side of the building that was always empty. The entire situation baffled Elting. “I’ve never understood what they expected to change here.”

Jordan Elting at his business, Reset Button Arcade, in Tigard. Photo by Catie Gould.
Elting attempted to chase down documents from his landlord so the city could sign off on his application. But his issue remained unresolved when Tigard voted in December to eliminate its parking minimums citywide.
“I honestly didn’t know how I felt about it when I first read it,” Elting reflected on a news article he had seen about the parking change in Tigard. But then the city planning department called to tell him the paperwork wasn’t needed anymore. “All right, I guess that’s what it meant,” said Elting. “That got rid of what I see as absolutely ridiculous red tape. Obviously, it ends up being a good change for businesses.”
The public may save money, too. Schuyler Warren, a senior planner for the city, estimated that no longer having to work through cases like Elting’s will free up about 12 hours a week for city staff to put toward other initiatives.
Local opposition remains
Many city officials don’t like Oregon’s new rules, which the state called “Climate-Friendly and Equitable Communities,” or CFEC for short.
“Horrible name, horrible changes,” Millersburg Community Development Director Matt Straite described the CFEC program to that city’s planning commission in June. “We feel like they’ve really reached down from Mount Olympus and forced cities to do things they don’t want to do.”
It’s a common sentiment among Oregon cities. Fourteen local governments filed a lawsuit last fall that challenges procedural issues with the state’s rulemaking process. The case is still pending.
“This pretty much sucks, putting it bluntly,” Corvallis City Councilor Laurie Chaplen said in a hearing last October as she voted to comply with the new state law by repealing all parking minimums.
Part of the issue is that the statewide relaxation of parking minimums is just one rule in a larger adopted package. Other mandatory parking reforms include requirements for bicycle parking minimums, electric car charging, and tree canopy coverage. That is in addition to designating climate friendly areas in larger cities and changes in transportation planning. As a whole, the package has been criticized as overly prescriptive. This month, the agency received an additional $2.7 million in funding to assist cities with implementation costs—an unusually large sum, but far less than cities said they’d need.
In an effort to meet them partway, the state agency in charge, the Department of Land Conservation and Development, relaxed some rules this April. For example, the state reduced its standard for the mandatory amount of tree shade over large parking lots: 40 percent canopy coverage, down from 50 percent.
A boost for middle housing
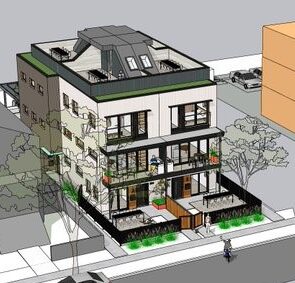
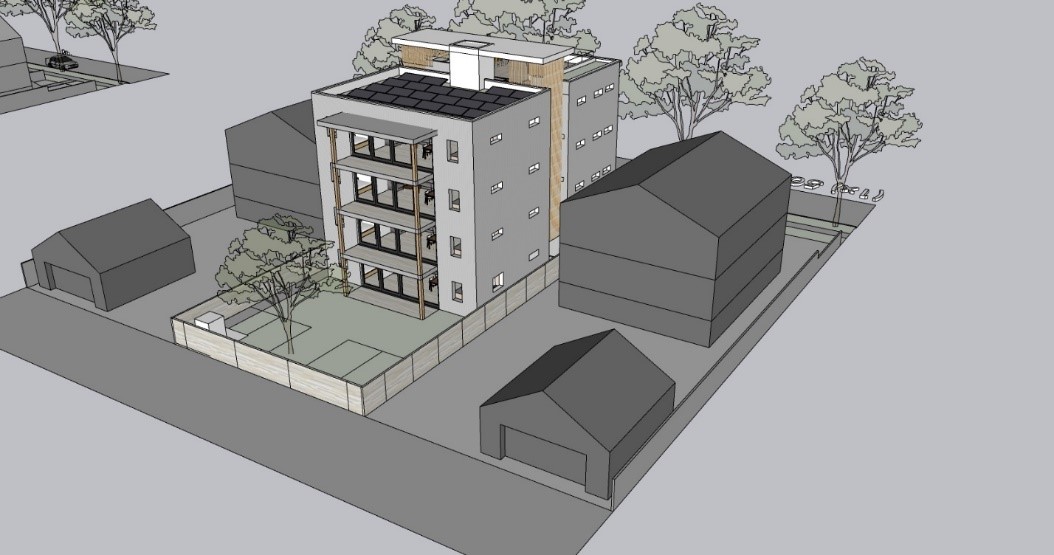
The additional flexibility over parking spaces has been particularly helpful for projects that add more homes to existing lots. In Ashland, a fourplex is using the state’s new flexibility to trade a couple of parking spaces for other outdoor amenities. In 2022, the four two-bedroom homes would have required seven parking spaces. “We could have made it work on this site,” said architect Tom DeVore, “but there are trade-offs.” After the rules were adopted in July, DeVore got together with his clients and asked, if it’s up to us, how much parking do we want to provide?
“It just opens up so many more possibilities of what you can do on-site,” DeVore said. “Parking just takes up so much space.”
Ultimately, they determined that Ashland renters would expect at least one parking spot for each household. Trimming their design from seven parking spaces to five allowed them to add a play area for children, shared gardens, and a larger shared patio. They plan to break ground in July.
Dylan Lamar, another small-scale builder located in Eugene, called the state action a blessing. “Thank god for CFEC,” he said. Lamar, who describes himself as a market-rate developer, aims to provide housing affordable to anyone making the median income and currently has two small projects in the works. Without any subsidy, he estimates his homes would sell for $210,000—half the price the typical detached home in Eugene.
Lamar recently won a grant from the city for his first affordable housing development, targeting first-time Latino homeowners in the area. The four new homes will be sold for about $115,000 apiece, with one of them being fully accessible. Referred to as “grow homes,” three of them will have an unfinished attic to which the future homeowners can add more living space later on. None of the homes will have a dedicated off-street parking spot.
These are exactly the type of projects Oregon hoped to create when it legalized “middle housing”—from duplexes to cottage clusters—in 2019. But though the housing types were now legal, even modest parking minimums could constrain sites too much to build. Lamar has no interest in tearing down the 1950s ranch house on his site, but it currently runs 8 feet away from the property line, too narrow for a driveway.
Thanks to the new state rules, he didn’t have to worry about that. The back lot homes won’t have on-site parking, and future buyers will simply use a sidewalk to reach their cars on the street.
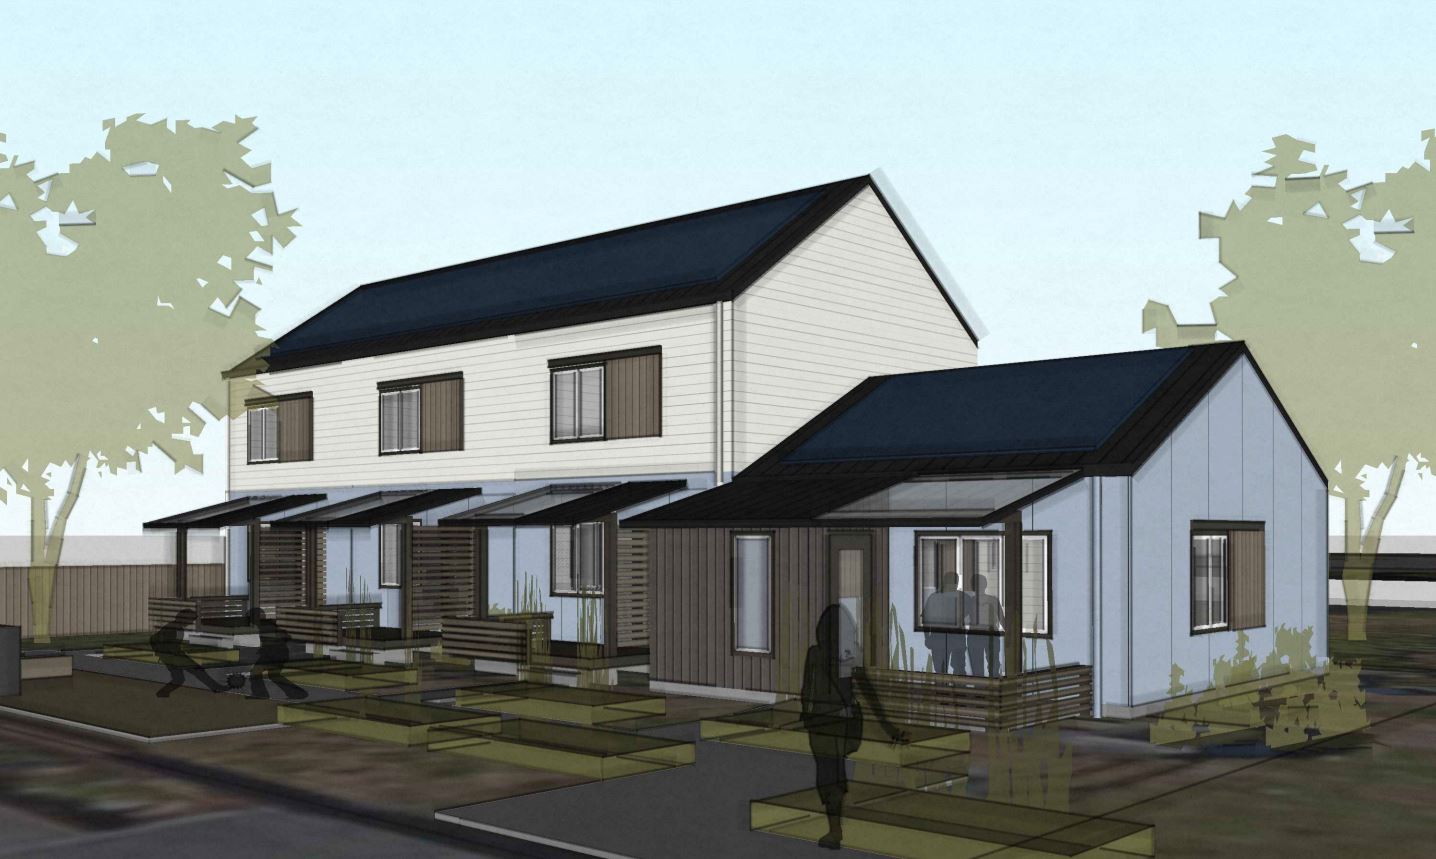
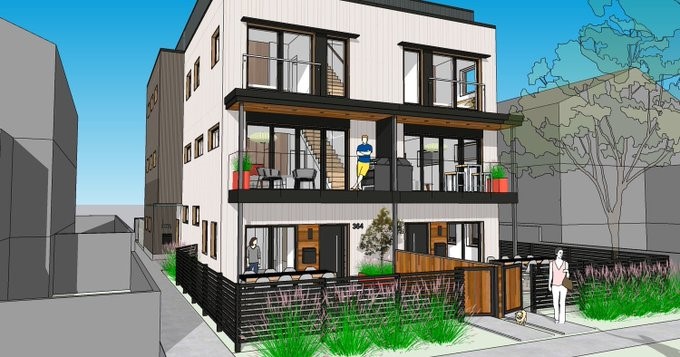
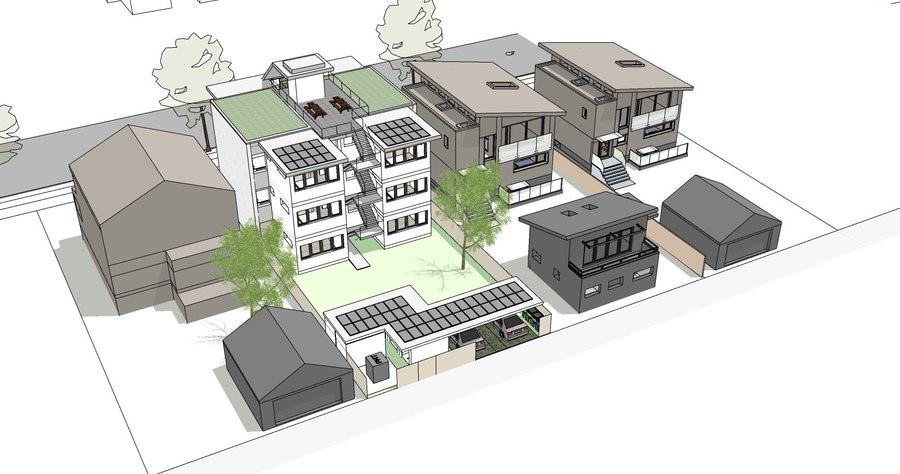
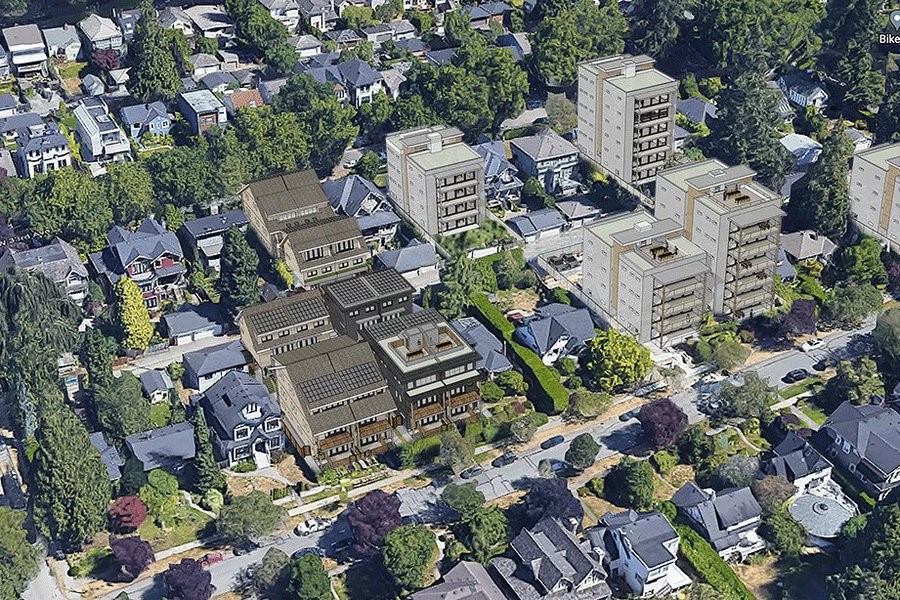
Grant Street Grow Homes will add these four new homes to an existing backyard. Image by Cultivate.
Despite the project getting a top score from city staff recommending funding, city council wrung their hands over the lack of parking.
The state rules have made these types of debates moot, tipping the scales in favor of more housing for more neighbors. “I have 100 percent confidence this project would not have happened if the state had not taken action, both on middle housing and on CFEC,” said Lamar.